The Trading Pit Week Ahead Market Outlook (April 01 – April 07)
Last week, there was a noticeable weakness in the Euro and the New Zealand dollar. The markets were digesting the Interest rate announcement by most of the Major Banks.
This week will be a short week in news announcements, as on Monday, April 1st, Australian, Switzerland, Eurozone, and UK banks will be closed in observance of Easter Monday.
In the US, the ISM manufacturing PMI will be reported during the New York trading session, and the forecast estimates a number under the benchmark of 50.
The German Prelim CPI number will be released on Tuesday. The forecast estimates an unchanged number at 0.4%. An actual 0.4% can be considered neutral for the Euro. Any positive number can critically favour a bullish move on the EURUSD.
In the Eurozone, the Harmonized Consumer Price Index will be reported, and the forecast predicts a decrease in the significant inflationary indicator to 3% compared to the previous report's 3.1%. This could weaken the Euro and continue the downtrend on the EURUSD pair.
During the New York trading session, the ADP employment change will be announced on Wednesday, an early indication of what can be expected to report the upcoming Friday at the Non-Farm Payrolls number. The ADP is forecasted to increase by 9000, from 140K to 149K. If an increase occurred, it would be considered a bullish sign for the USD.
The next significant event will be the ISM Services PMI in the US, forecasted to report above 50, which can be considered bullish for Greenbuck. Towards the end of the day, Fed Chairman Powell will host a speech.
The CPI (Consumer Price Index) number will be reported on Thursday in Switzerland. The forecast predicts a drop to 0.3% from 0.6% that is currently. If this outcome occurs and the market follows through, the weakness in the Swissy will be apparent. In this case, the USDCHF may continue moving upwards per the technical chart.
On Friday, during the Asian trading session, Australia will report the Trade Balance. The consensus predicts a decrease to 10.4 million compared to the previous report's 11.027 million.
Moving into the London trading session, the Retail Sales in the Eurozone will be reported, with the forecast estimating a reading of -1.2% compared to the previous report's -1%. This week, a weak Euro is expected if the actual number confirms the consensus and the market follows through.
All the attention will go to Friday's Non-Farm Payrolls (NFP) event. An event that attracts the attention of all market participants. A single event can cause a directional move on the US Dollar. As per the forecast, the new payrolls added to the US economy last month were 205K compared with the 275K added on the previous report. If the number reported that day confirms the forecast, a weak USD may be seen on the chart, and the GBPUSD, AUDUSD, EURUSD, and the rest will take advantage of creating upward moves. Oppositely, a positive reading number can fuel the strength of the US Dollar and surpass 104.71 on the dollar Index, as shown on the DXY weekly chart.
At the same time, in Canada, the unemployment rate will be reported, and the consensus estimates a reading number of 5.9%, which is 0.1% higher than the previous report—the higher the unemployment rate, the more it weakens the currency.
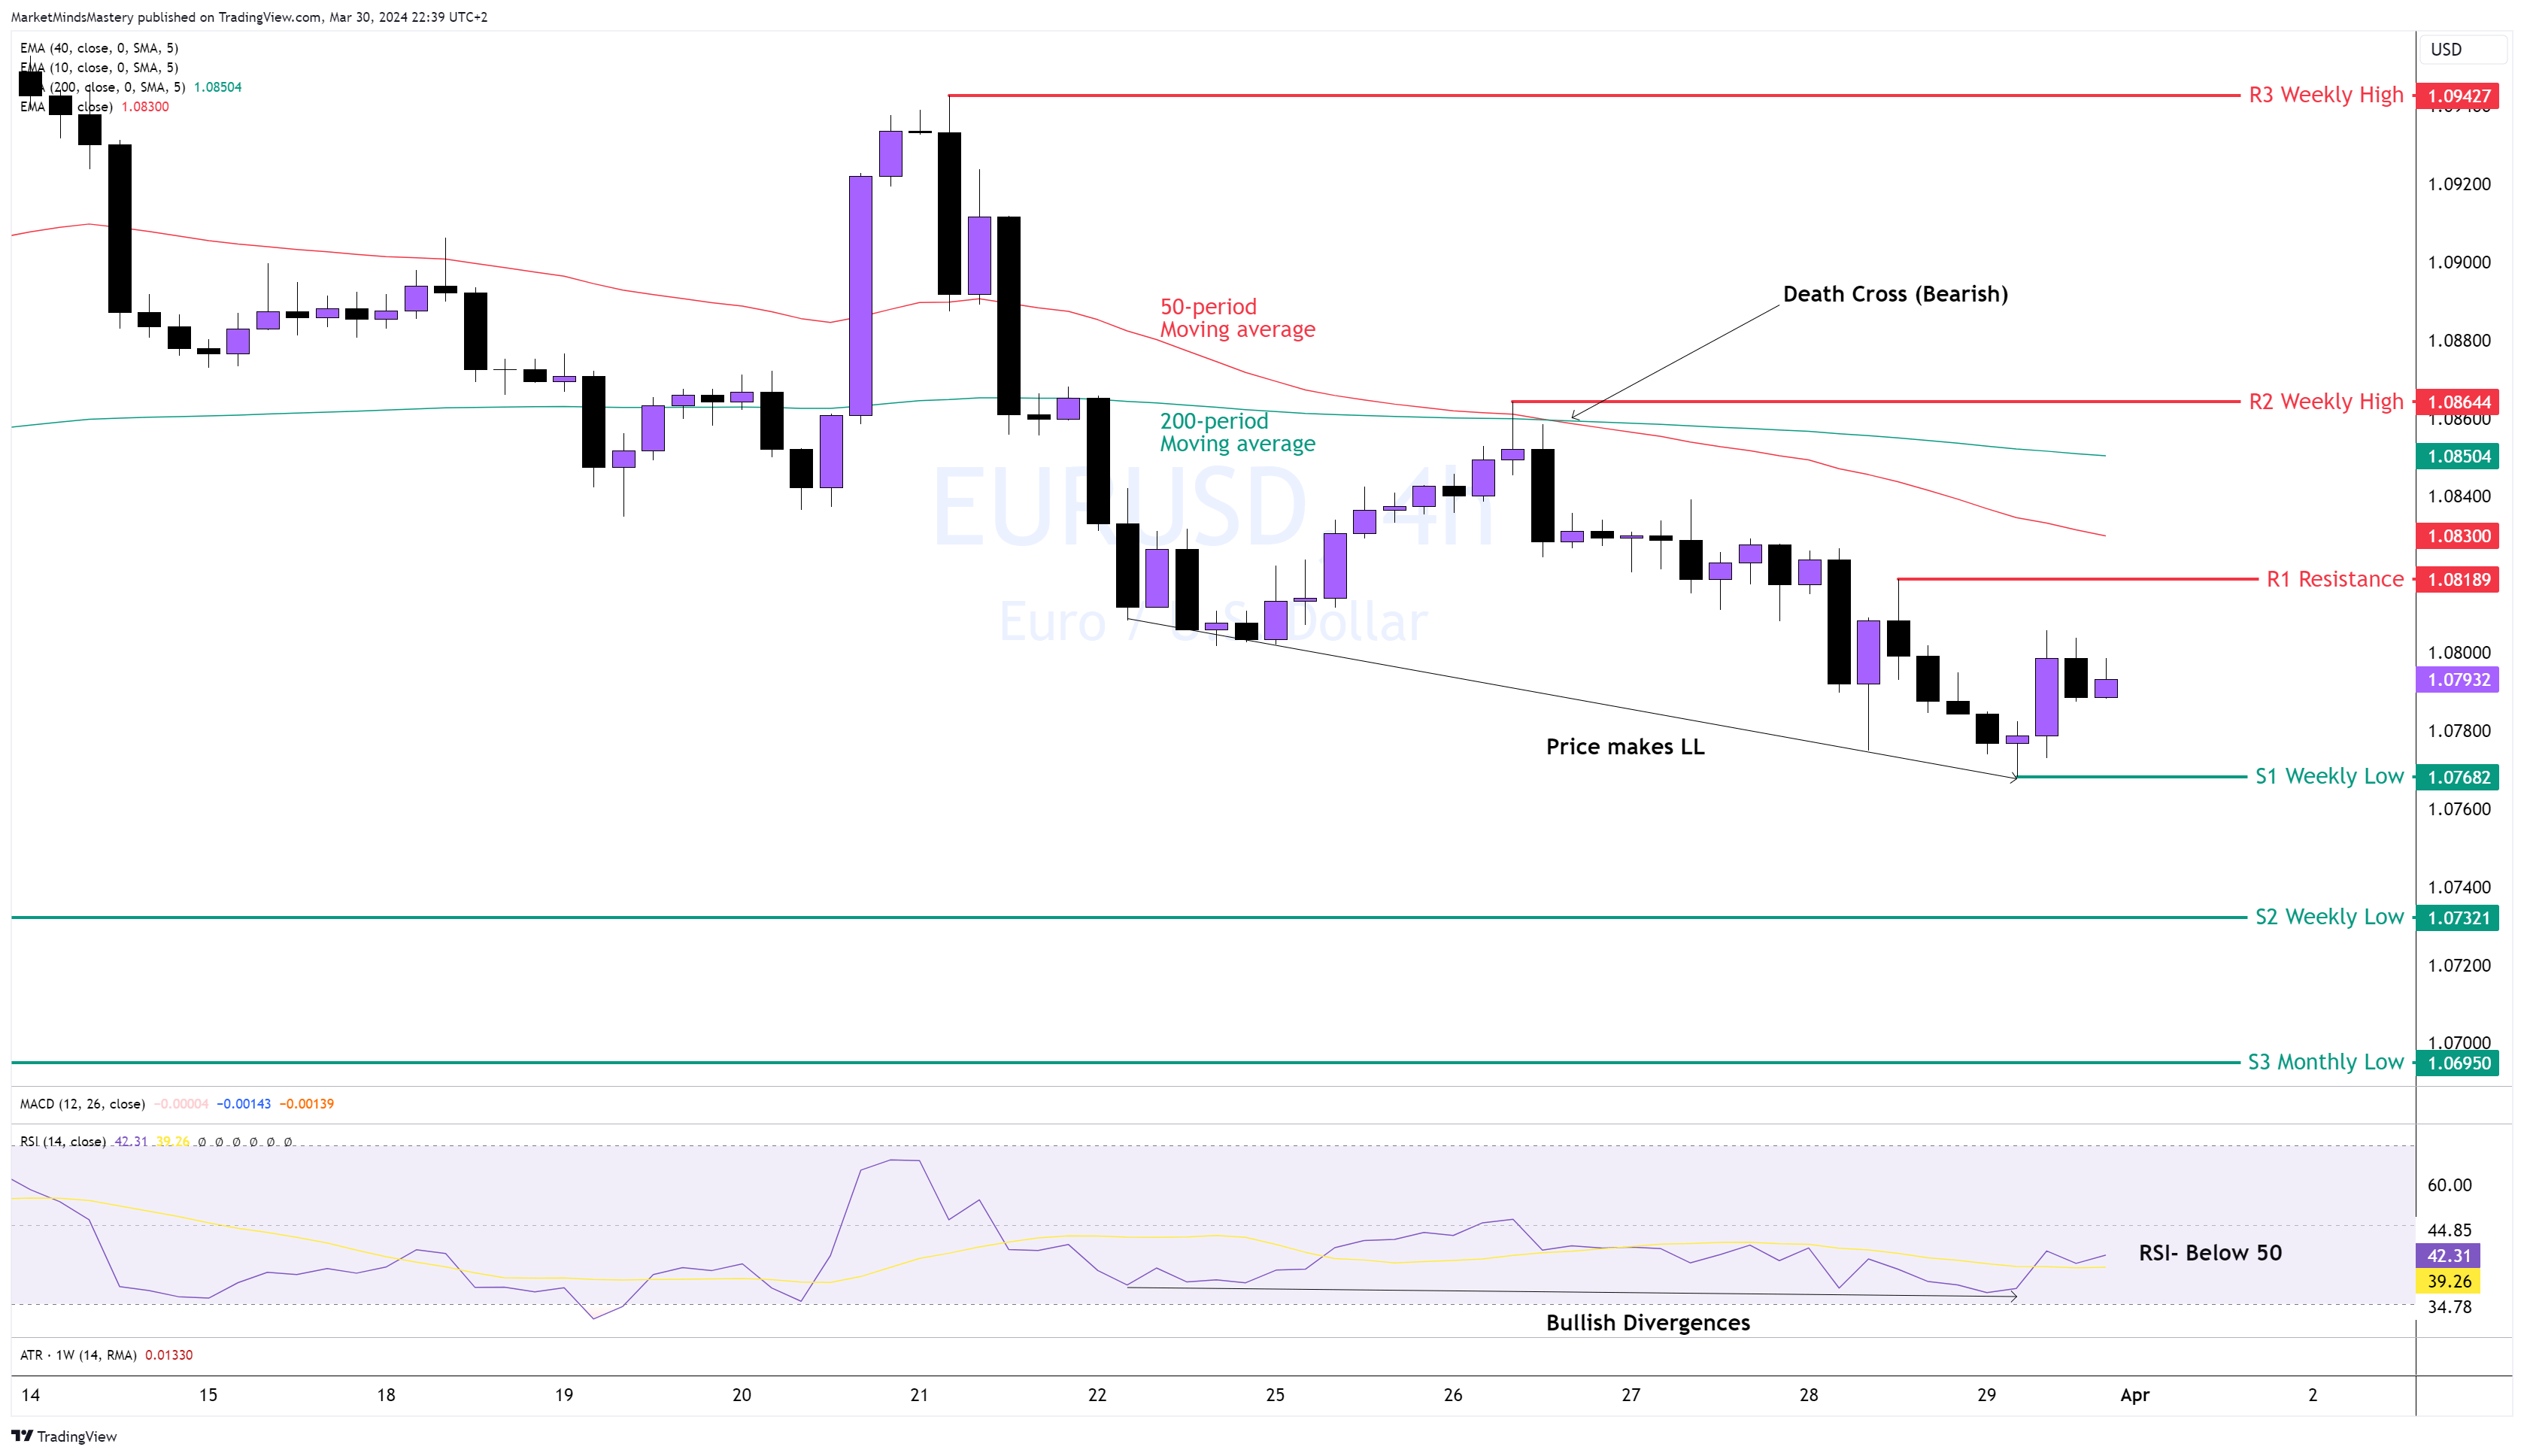
EUR USD,4H

Following last week’s analysis, the price filled up the “gap”, as we pointed out in the chart, entered into the Bearish Engulfing Order Block zone and declined. Since then, the price traded downwards with a series of lower highs and lower lows. The Euro's weakness was primarily the main force driving the market.
On the 4-hour chart, the 50 period crossed below the 200-period moving average indicates bearishness, and the RSI is under 50, indicating another sign of bearishness.
Starting Monday, if the sellers continue moving downwards, the first support area will be the previous week’s low, around 1.0768. If the price penetrates it, closes below it and moves downwards, the next support area, S2, is around 1.0732.
Oppositely, if the price advances and the buyers take control, the first area of resistance, R1, will be 1.0818. A further advance will meet the dynamic 50 and 200 moving averages. The following static resistance, R2, is the previous week’s high, approximately 1.0864.
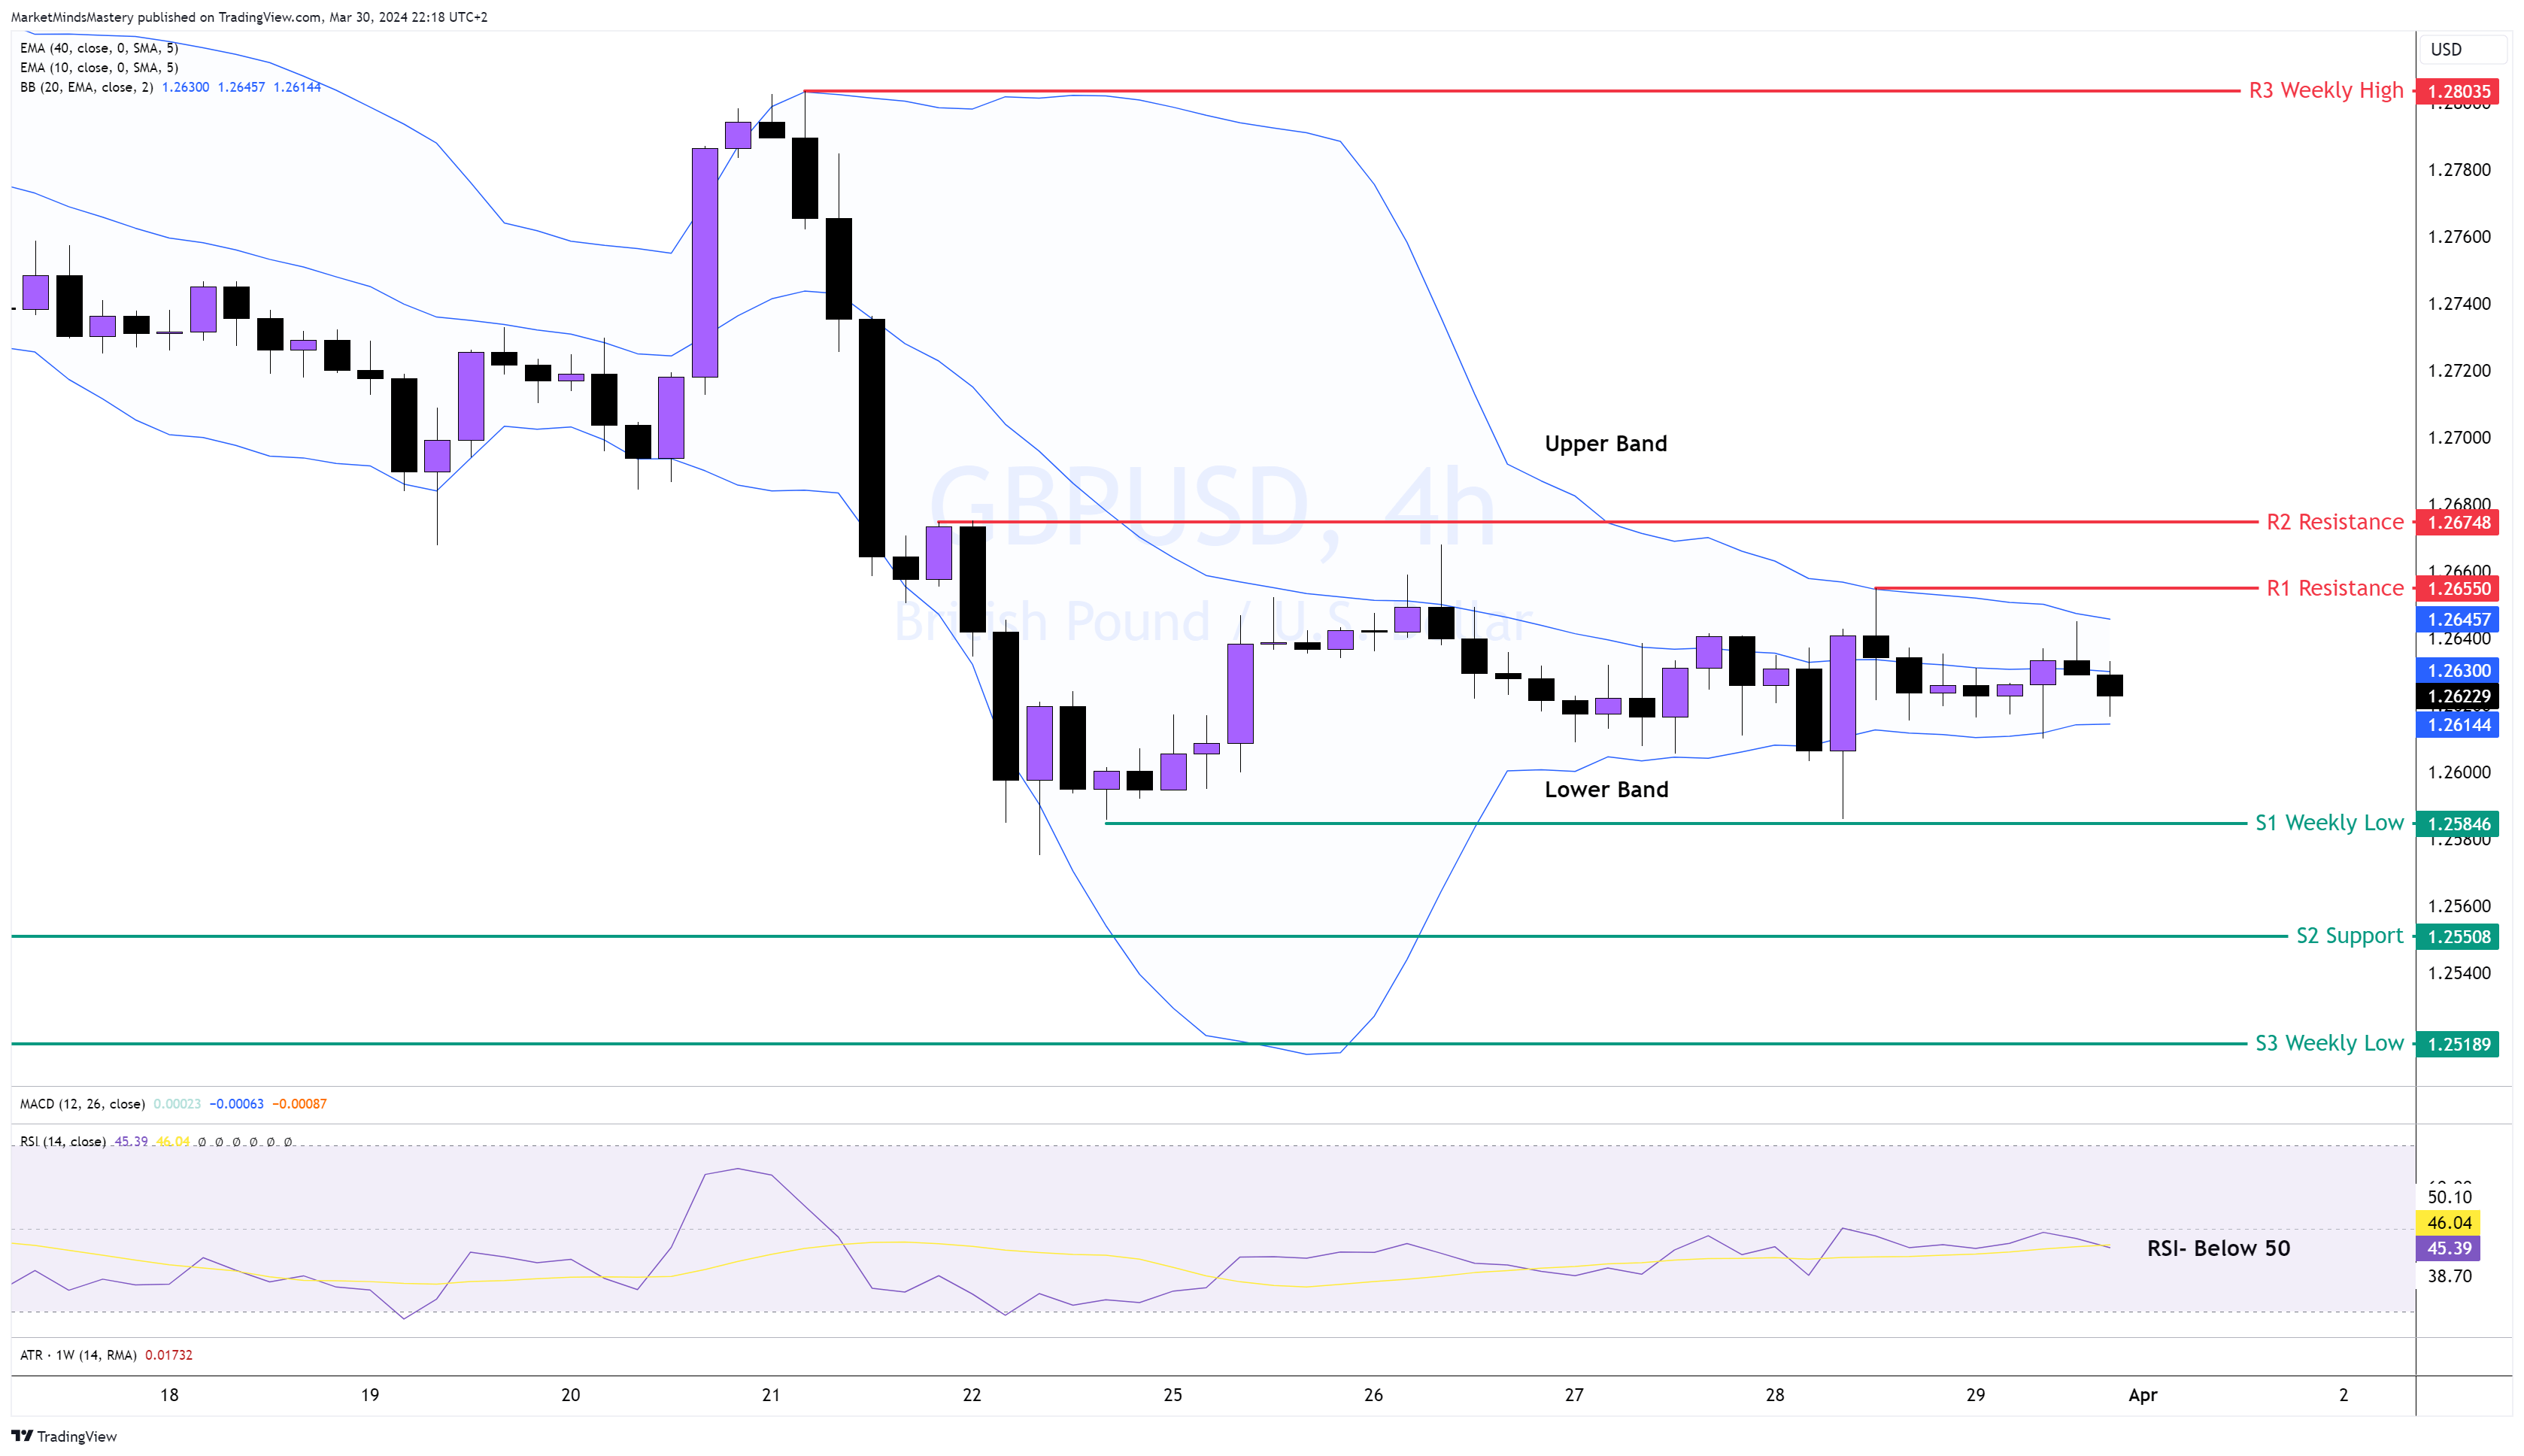
GBP USD, 4-h
As per last week’s analysis, the price filled up the “gap”, entered the Order Block area and declined successfully. Afterwards, the pair traded sideways without creating any new market structure or breaking any significant support or resistance.
The weekly chart’s moving averages point upward move, and the price action is an inside inverse hammer, indicating bullish strength.
On the 4-hour chart, the RSI is below 50, indicating bearishness and the Bollinger Bands contracts indicate a flat market. Therefore, a cautious approach is needed this week.
If the price moves upward, the first resistance area, R1, is around 1.26550. If the level doesn’t hold and the price closes above it, it will find the next resistance area, R2, at approximately 1.26748.
On the other hand, if the price declines and moves downwards, the first support area, S1, is the previous week’s low, around 1.25846. A further price decline will find the following support, S2, at approximately 1.25508.
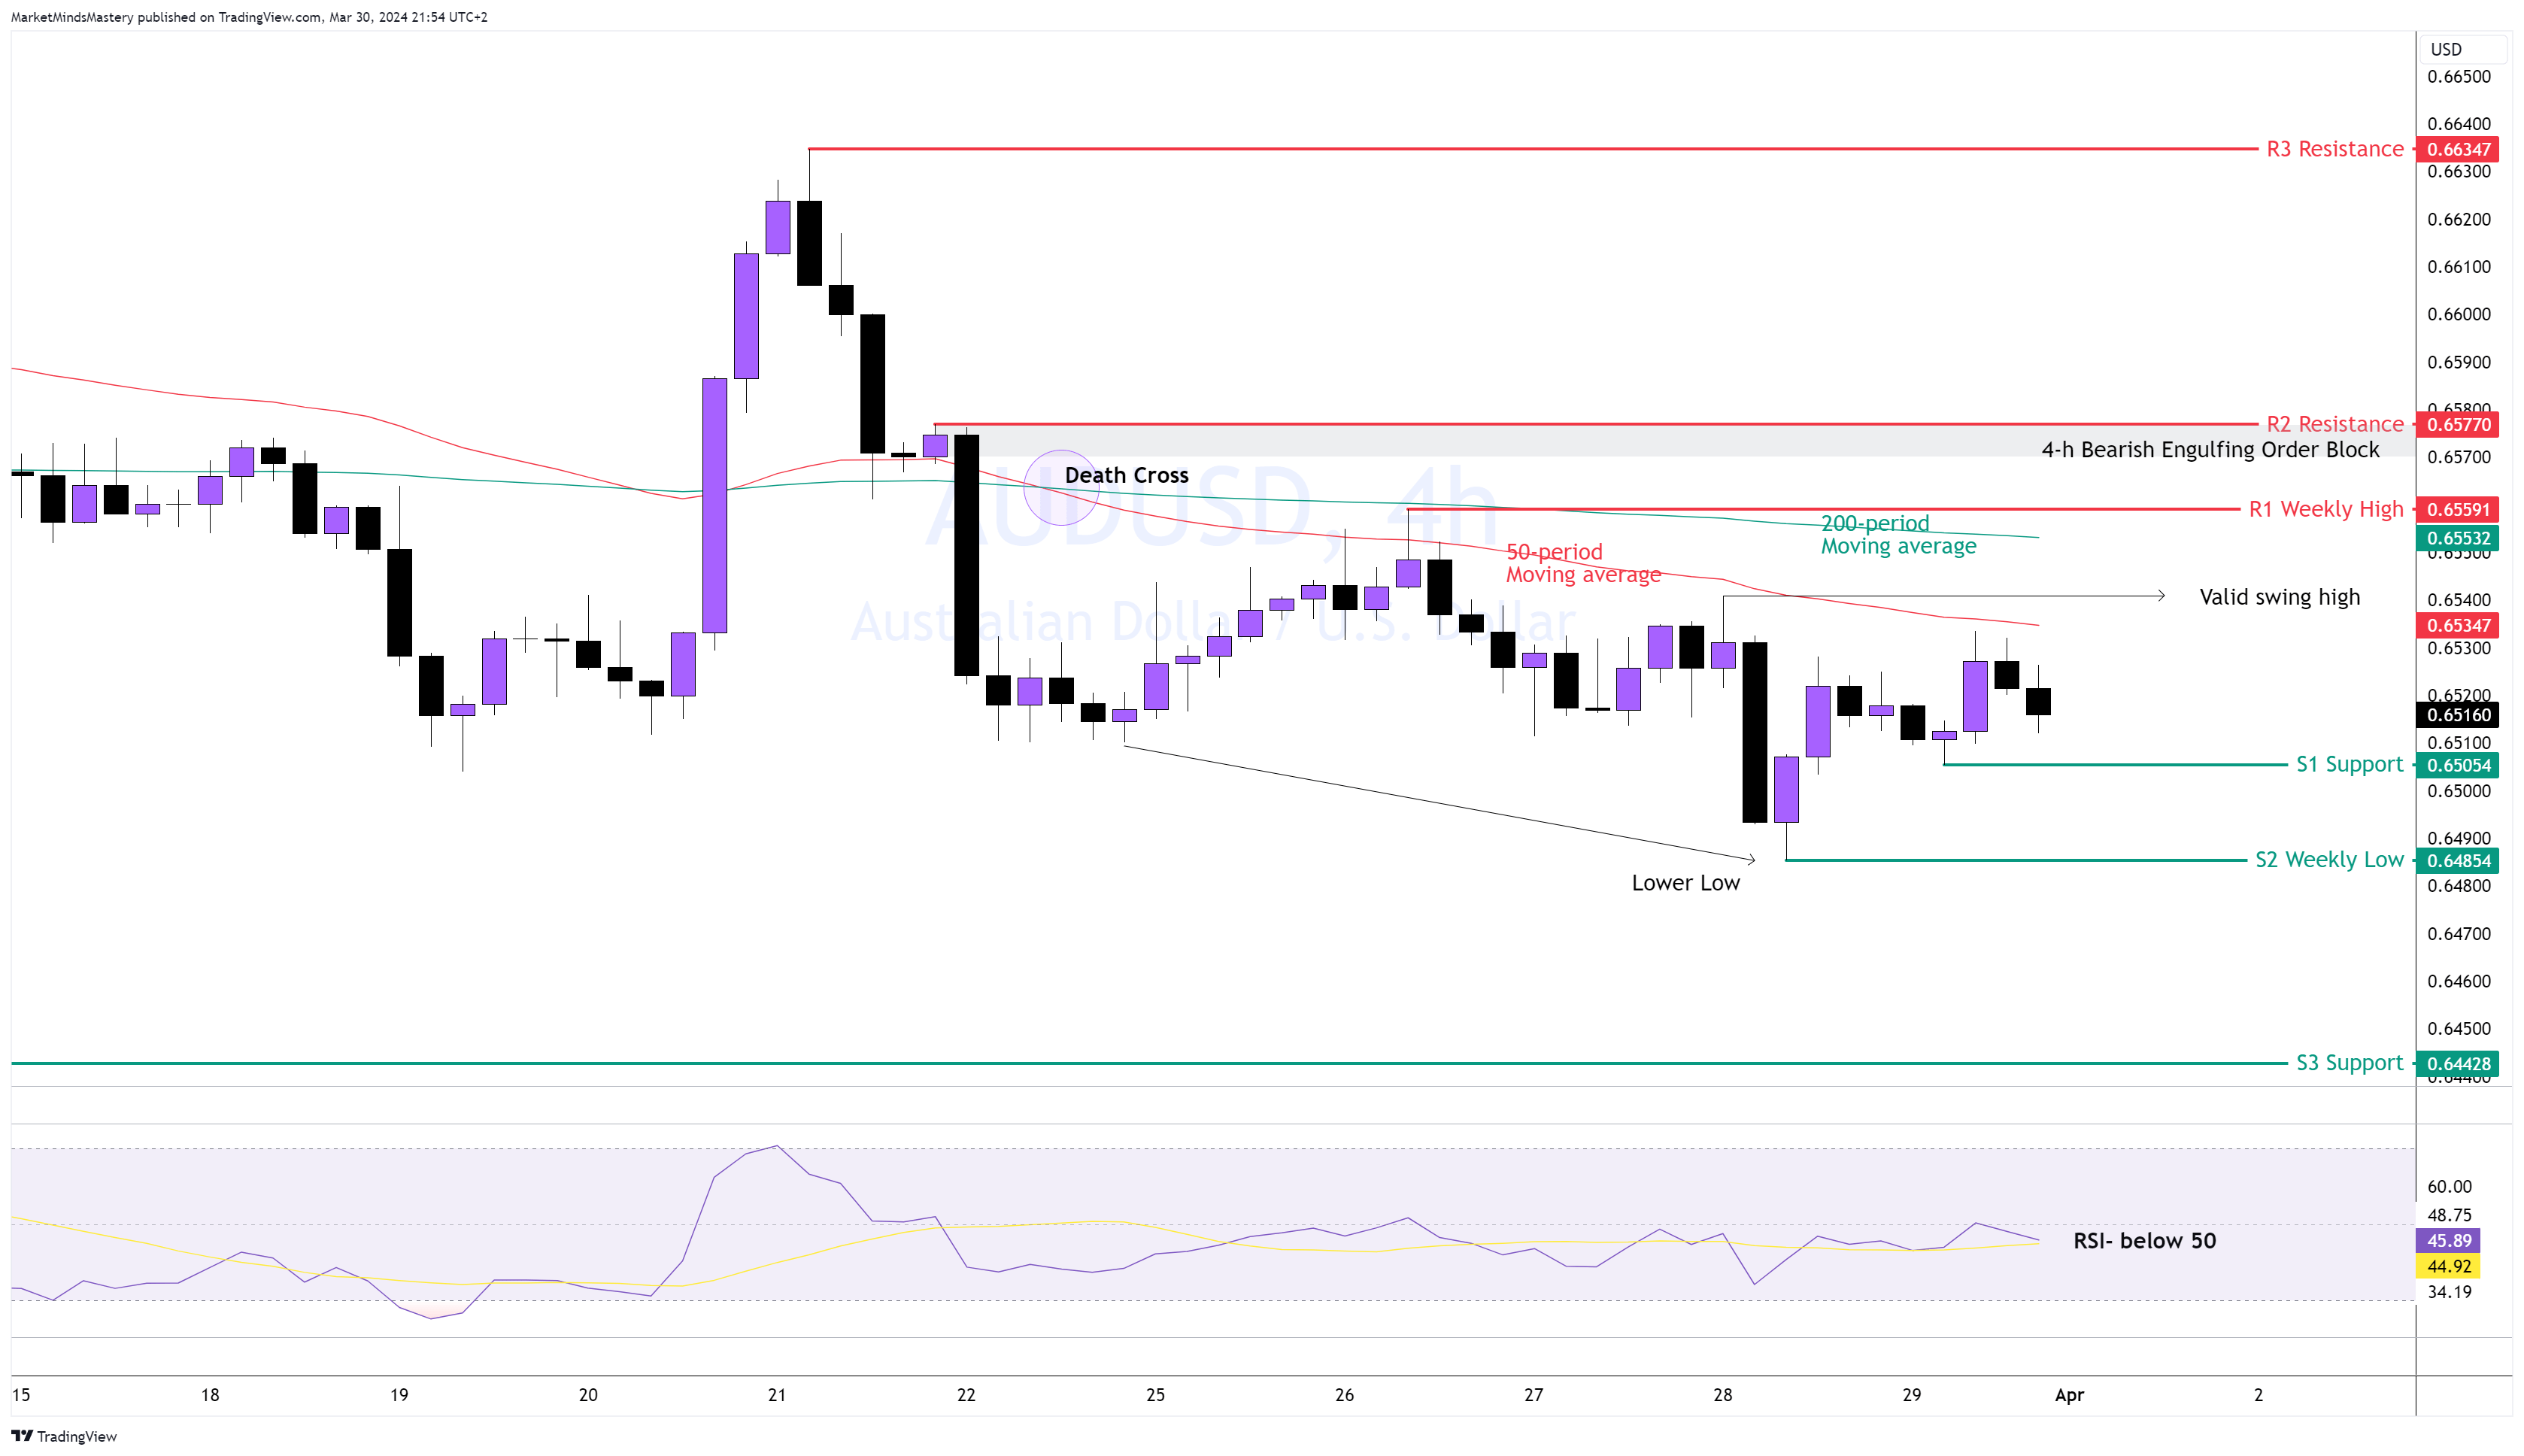
AUD USD 4H
Following our analysis from last week, the price entered into the 4-hour Bullish Engulfing Order Block bounced off and moved upwards. The weekly price action is a Long-Legged Doji candle. On the market structure on the 4-hour chart, the price created a lower low at 0.64854 last week. However, The price immediately moved back above the broken low, indicating weakness in sustaining the market lower. However, the swing high has not been violated. Therefore, the technical picture shows a seller's market. However, a cautious approach is needed this week in the AUDUSD.
The price is under the 50 and the 200-period moving averages. The RSI is below 50, which is a bearish indication.
Starting Monday, if the price declines and moves downwards, the first support area, S1, is approximately 0.65054, and the second support, S2, which is the previous week’s low, is approximately 0.64854.
Oppositely, an upward move finds the first resistance area, R1, around 0.65591 and the next area, R2, around 0.65770.
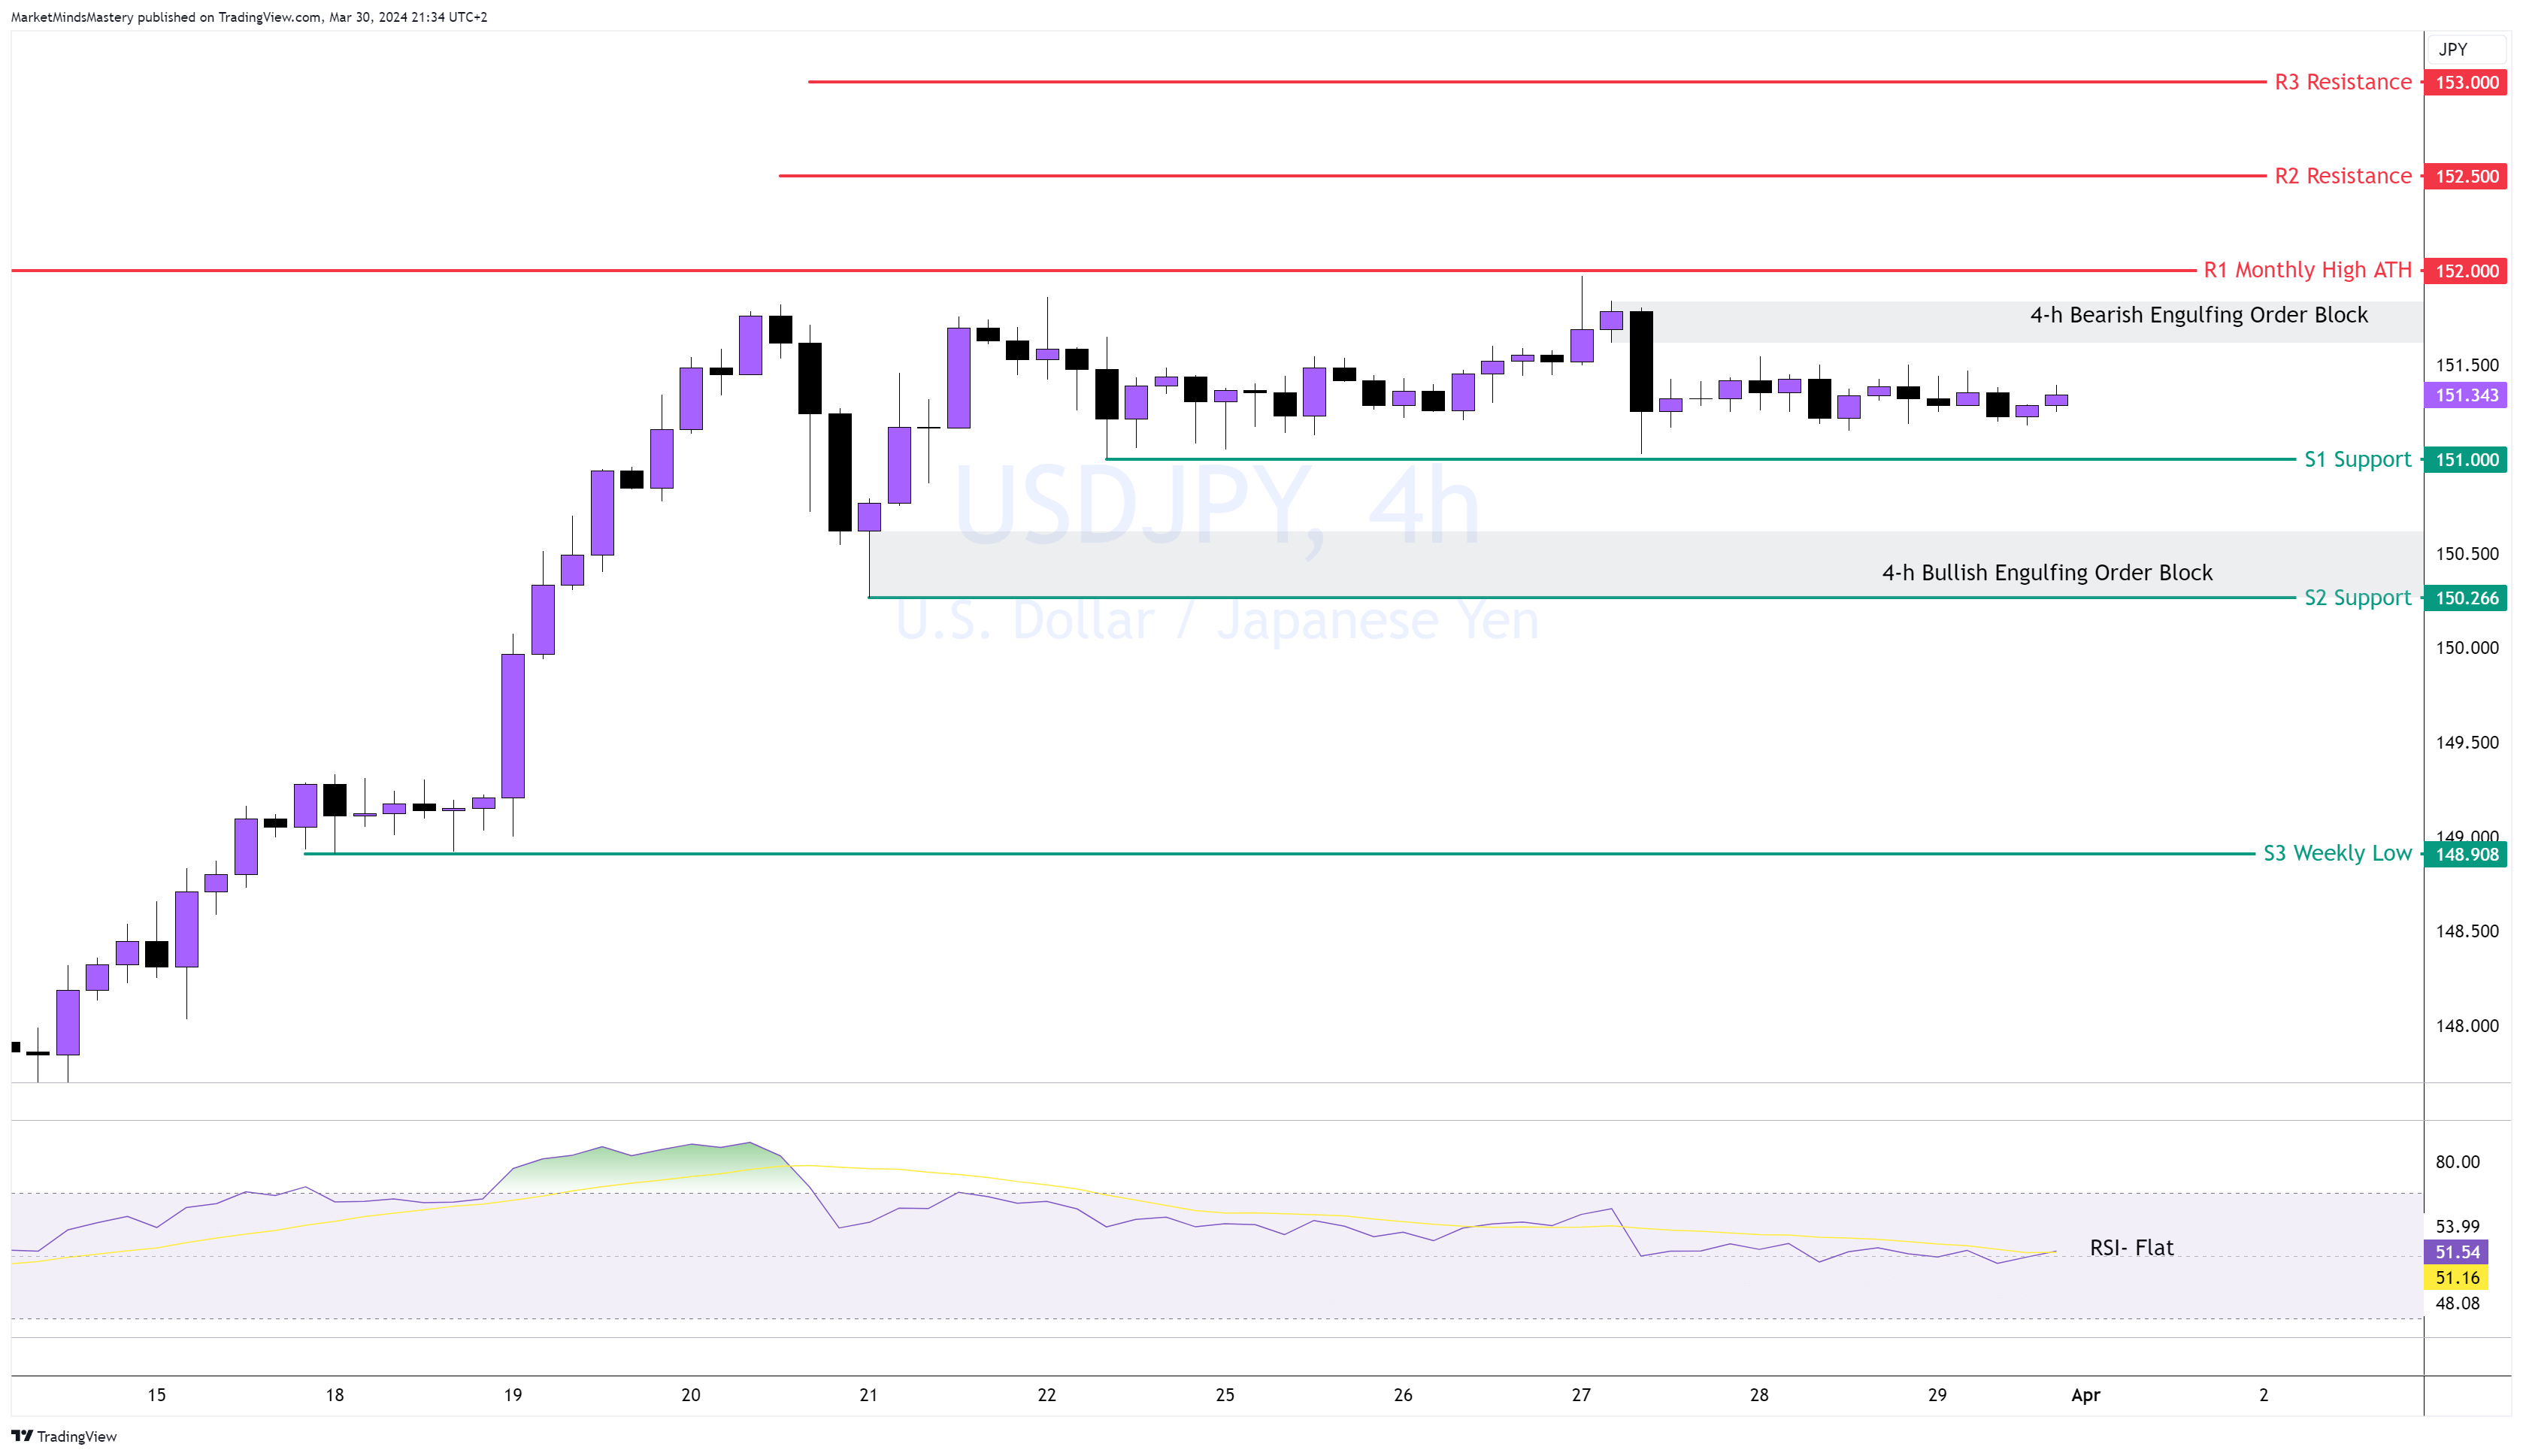
USD JPY 4H
In this particular currency pair, it is worth mentioning that on the weekly chart, the price formed a small doji candle with a total length of only 80 pips. Based on the ATR, the pair moves approximately 250 pips on average. This insignificant move usually reveals directional momentum. Looking at the 4-hour chart, last week’s Bearish Engulfing Order Block tested, and the price declined as expected, leaving behind a new Bearish Engulfing Order Block.
The price currently consolidates around 151.500, and the RSI is flat at around 50.
Hence, if a breakout occurred to the downside, the price will find the first support area, S1, at around 151. If it penetrates the S1 and moves downwards, the next support area, S2, is approximately 150.26 and hosts a Bullish Engulfing Order Block.
Conversely, if the price moves upwards, the first resistance area, R1, is at an All-Time High at approximately 152. If the price penetrates and moves above it, the next resistance area R2 will be 152.500.
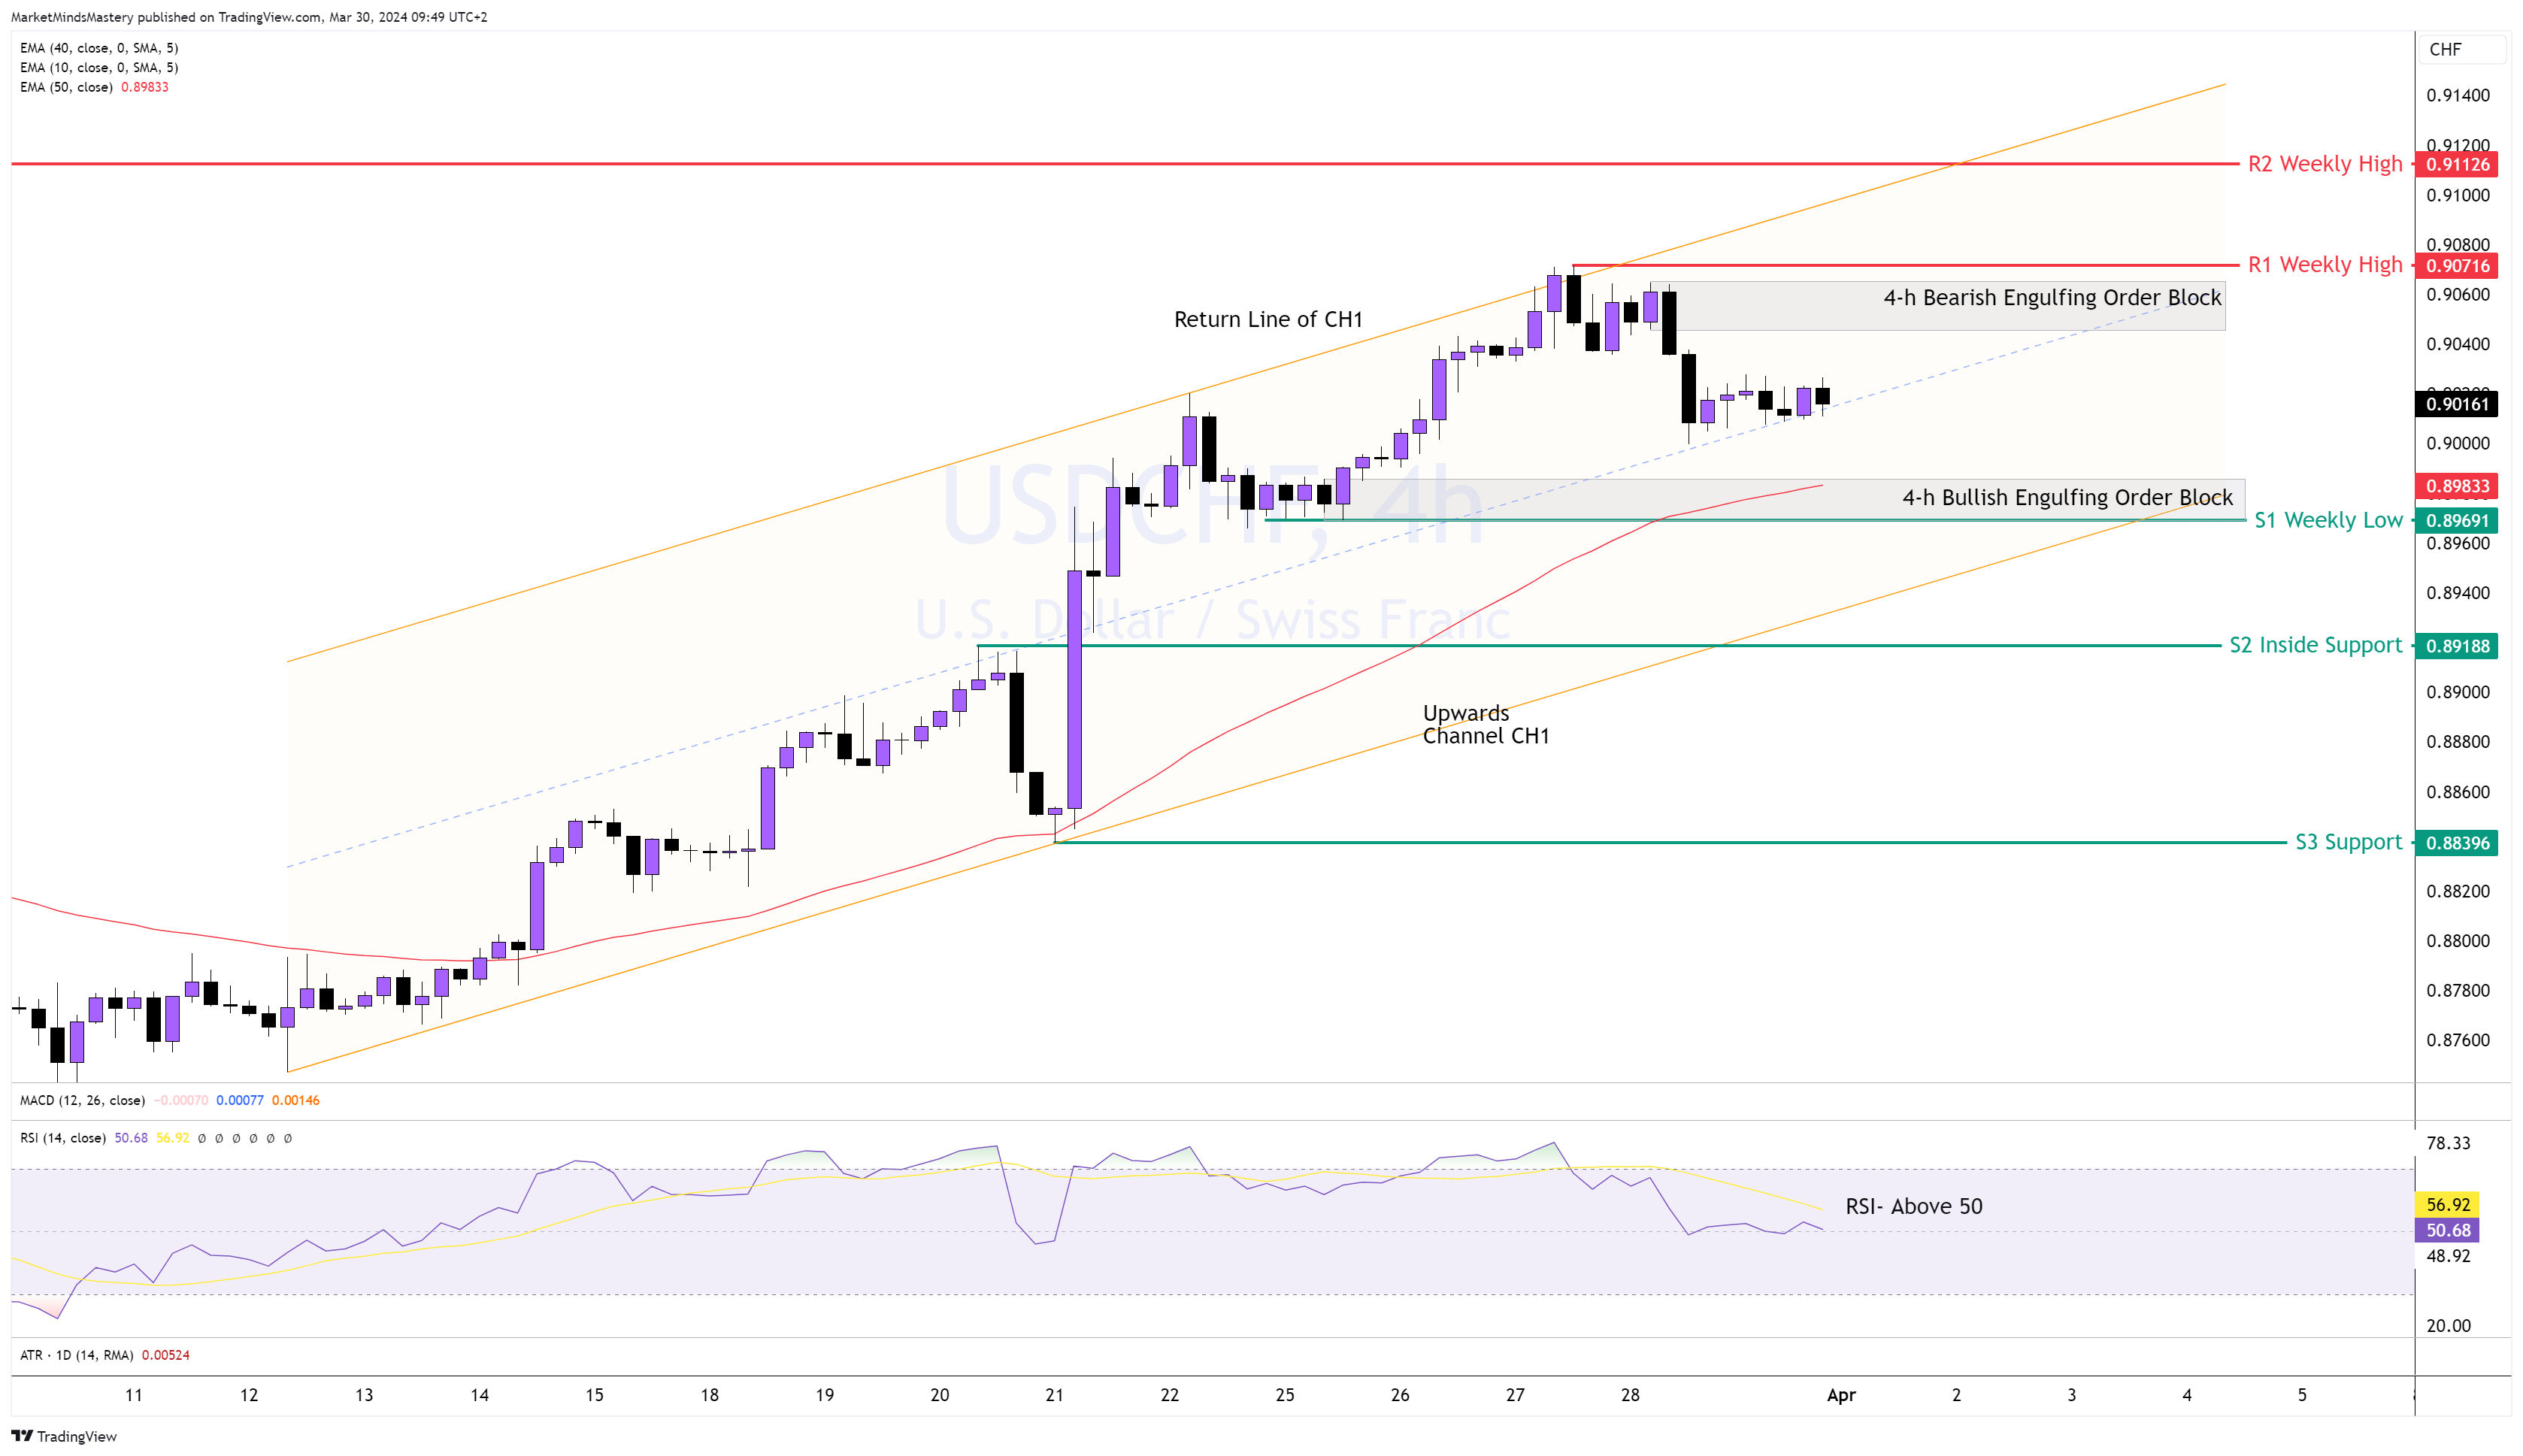
USD CHF 4H
The market rallied last week, as expected. However, before the upward move, the price didn't test any Fibonacci level. Currently, the price trades within an upward channel CH1, which is also above the 50-period moving average, indicating bullishness. The RSI is above the 50, another sign of a bullish market.
Last Friday, the price closed in the middle of the channel.
Starring Monday, if the buyers keep pushing the price upwards, the R1 weekly high will become the first resistance area, around 0.90716. The Order Block shown on the chart can also become an obstacle in the price effort to create a new high. If the price penetrates the R1, closer above it and moves upwards, the next resistance area, R2, is approximately 0.91126. On the other hand, if the price declines and moves downwards, the first support area, S1, is the previous week’s low, around 0.8969. The level consists of a Bullish Engulfing Order Block and the upward trendline of the channel CH1. If the price declines further, the next support, S2, is an inside support of around 0.89188.
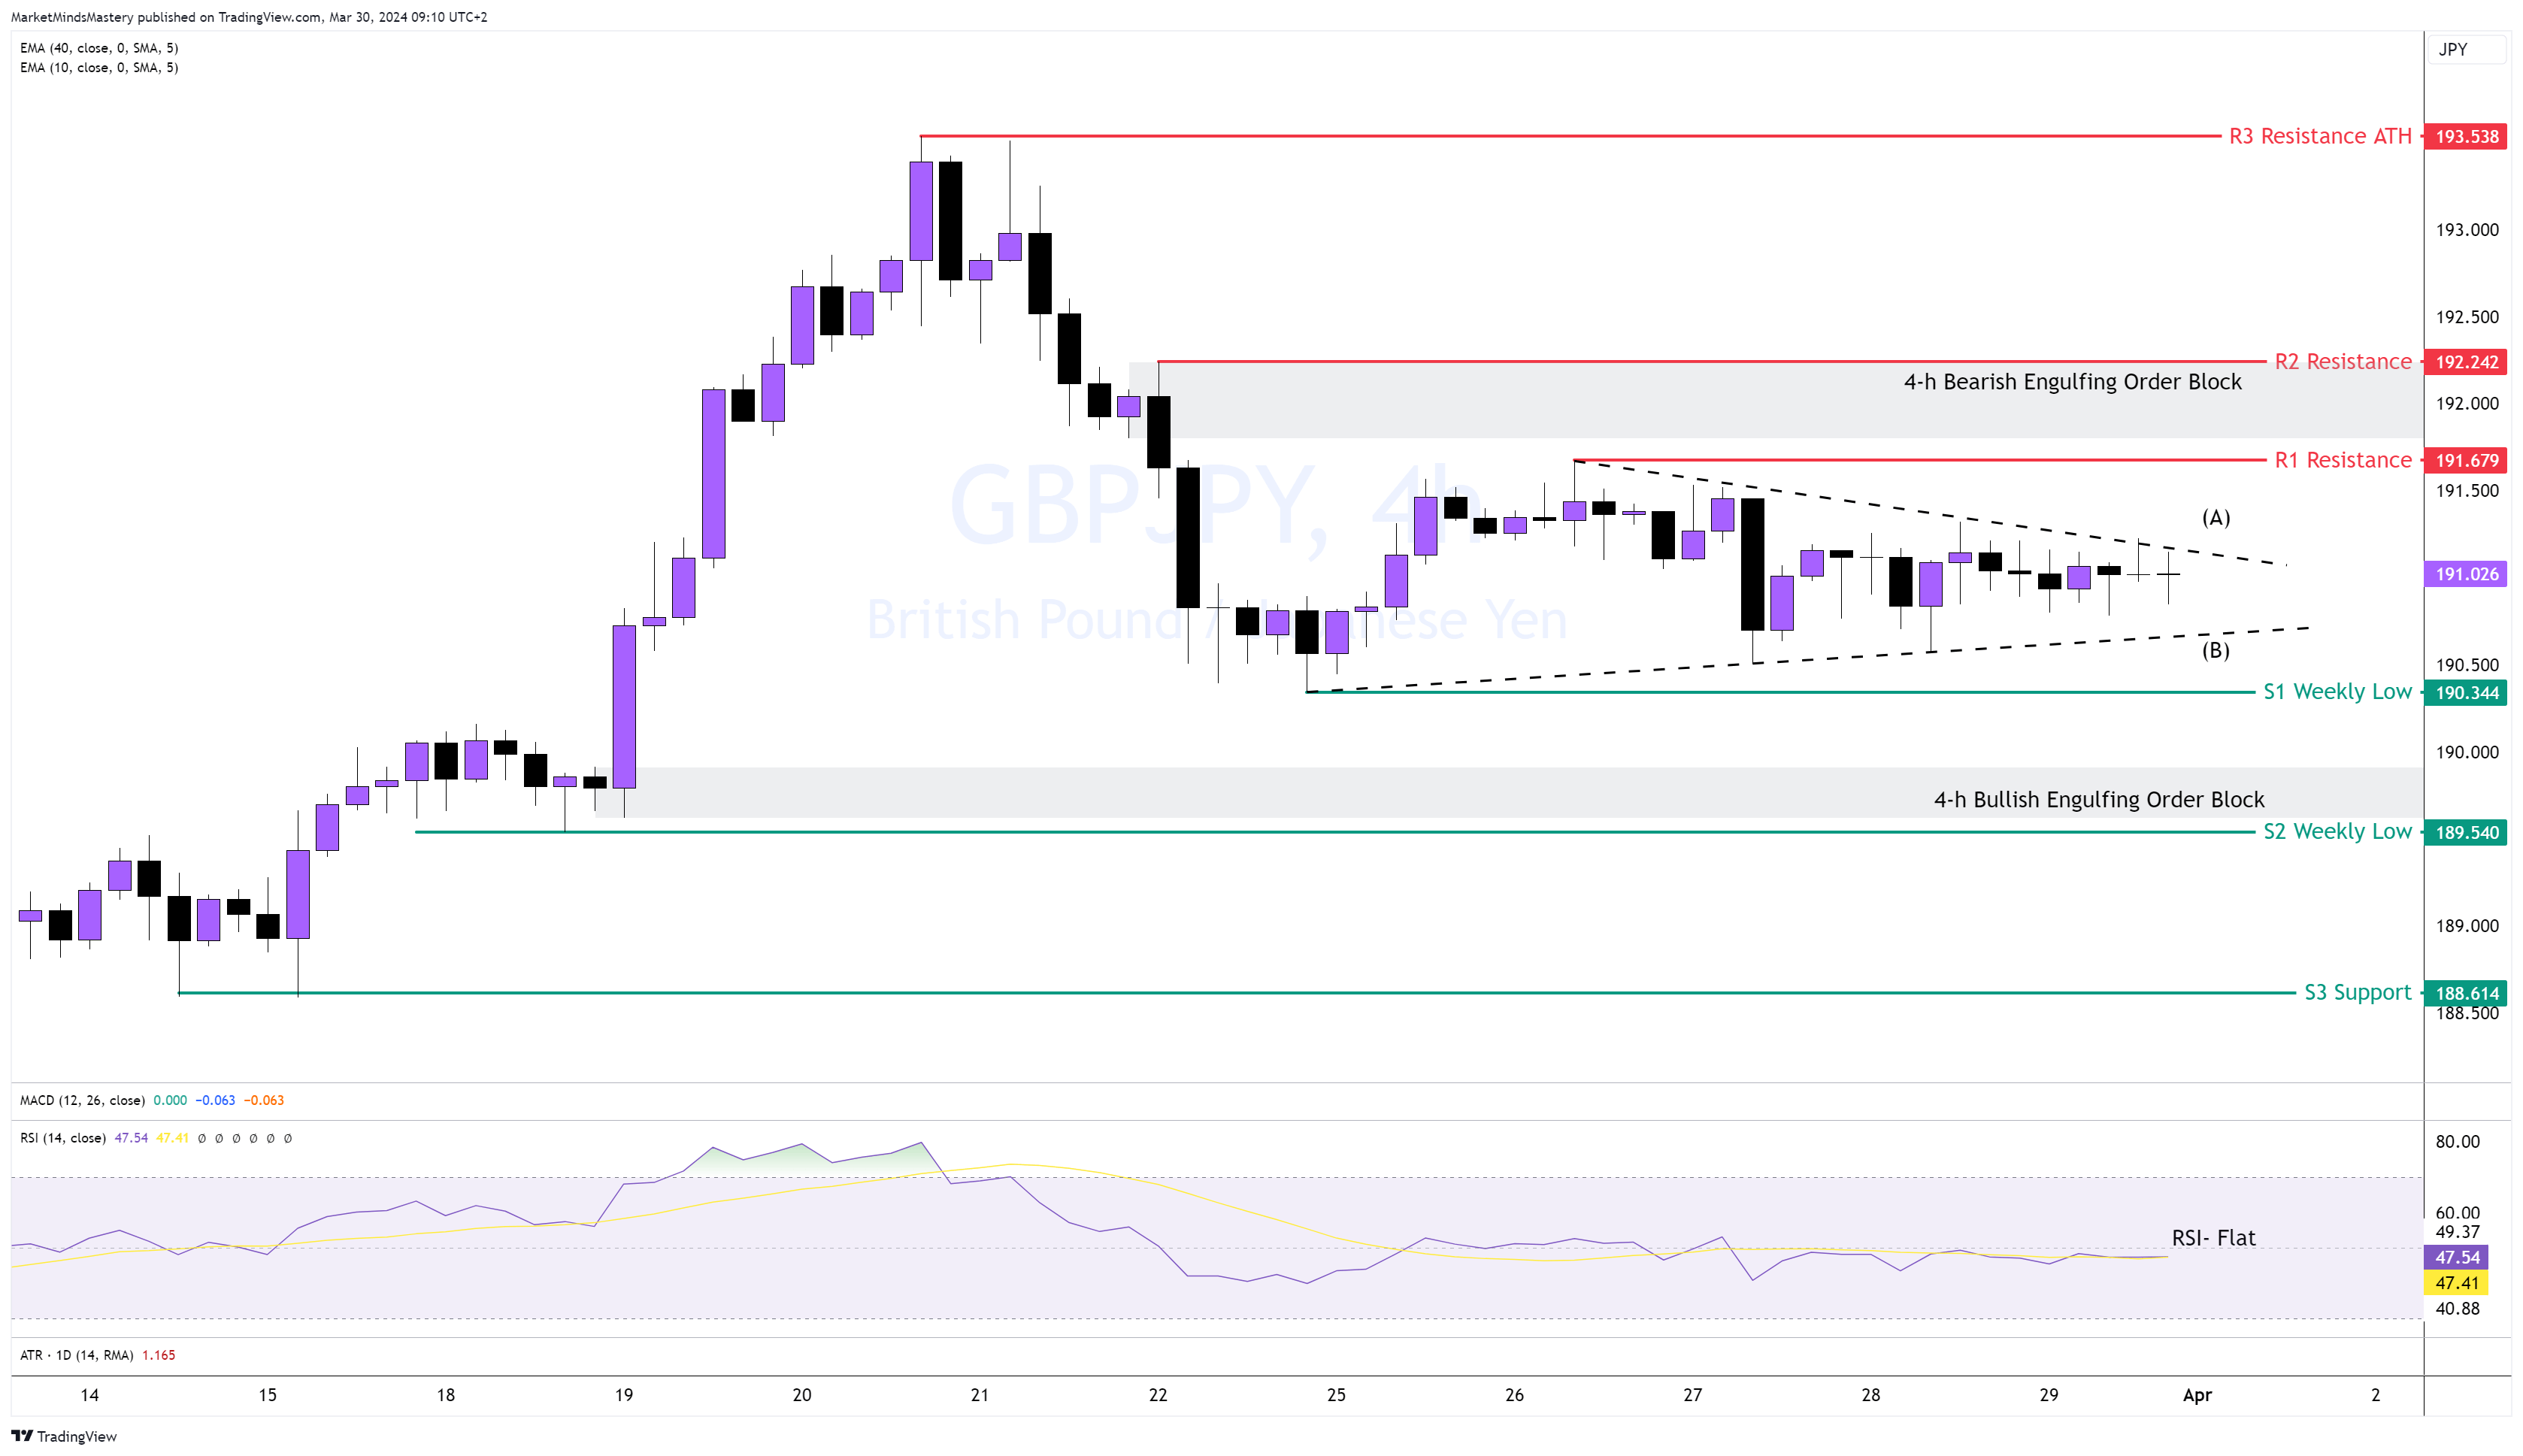
GBP JPY 4H
Per the shooting Star Weekly Price Action, we explained during the previous week's analysis the market was expected to decline and move downwards. However, the weekly candle ended as an inside(indecision) and doji candle. On the 4-hour chart, the price is compressed between two trendlines, one with a downward slope (A) and another with an upward slope (B). The RSI is Flat around the middle line 50. On this occasion, the moving averages are less valuable as they will follow the price trendless move.
Hence, if the price breaks above the trendline (A) and penetrates the R1 resistance around 191.679, it will enter into the Bearish Engulfing’s Order Block territory that developed around the R2 resistance, around 192.24. If the level doesn't hold and the price breaks above it and moves upward, the next resistance area, R3, is approximately 193.538.
Oppositely, if the price breaks below the trendline (B), we will find the previous week’s low acting as the S1 support, around 190.34. If the price penetrates the S1 and closes under it, the next area of support, S2, is around 189.54.
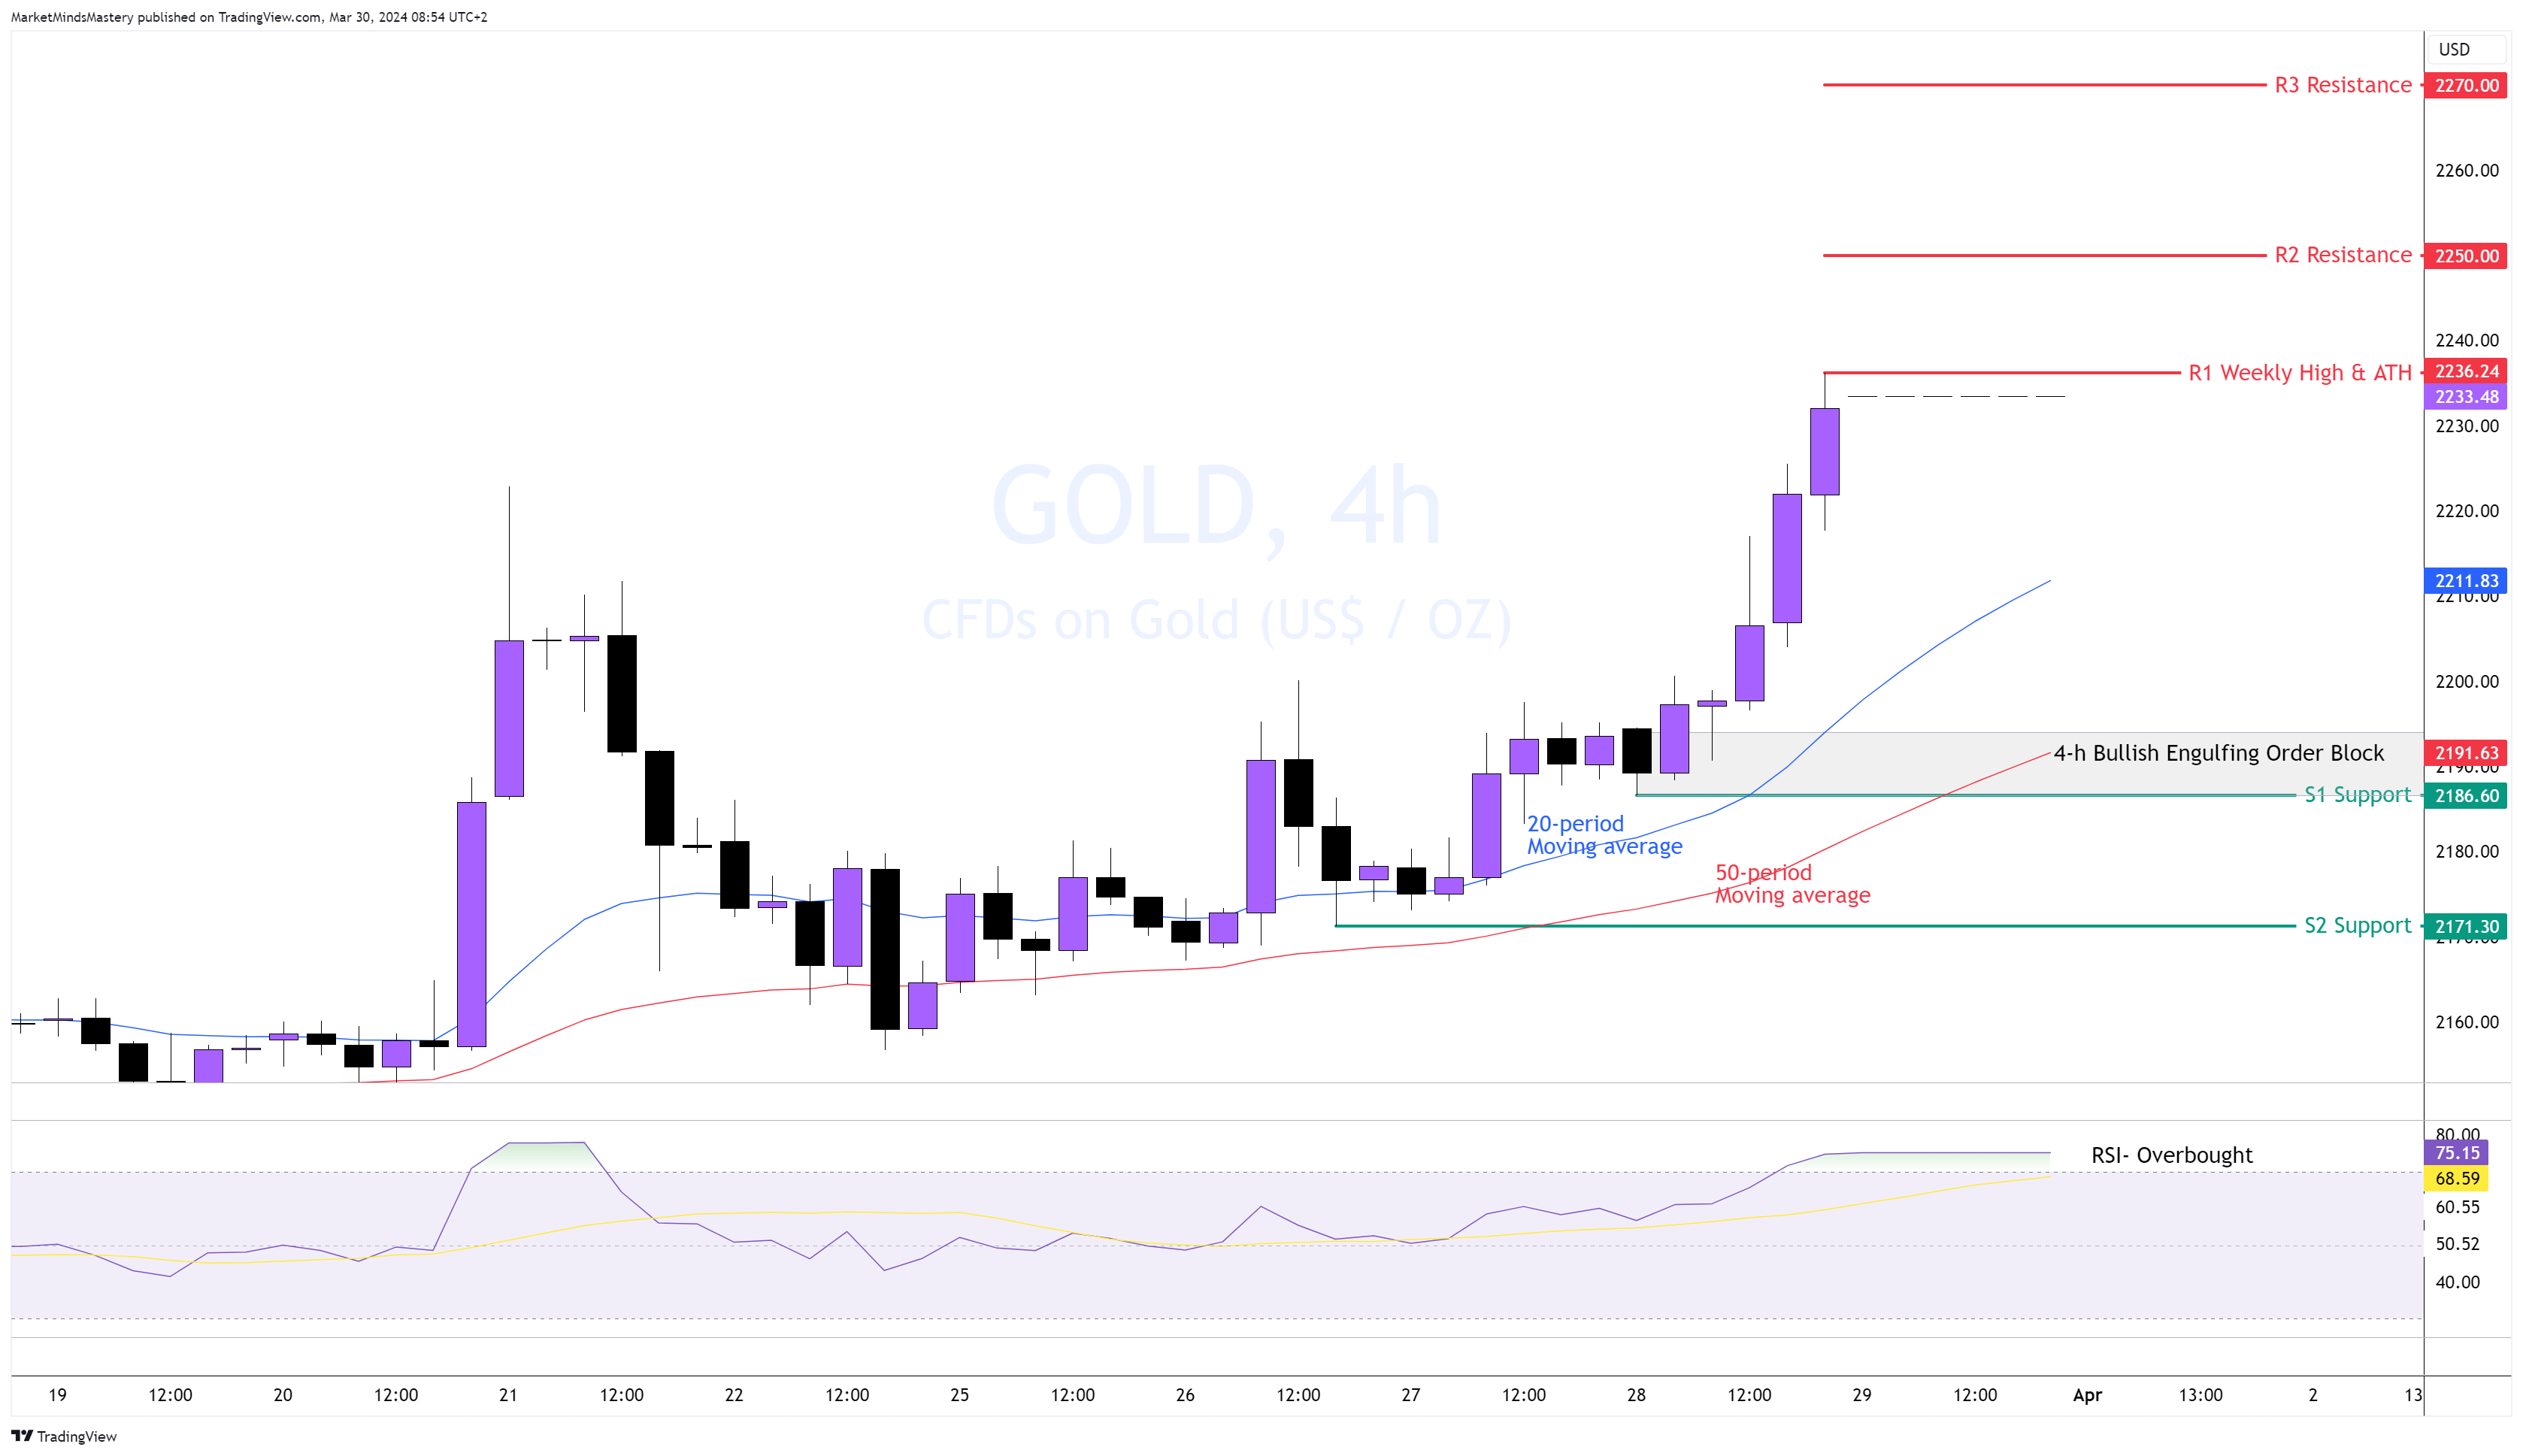
GOLD, 4H
On Friday, the Gold price increased approximately 1.8%, creating a new All-Time High. The 20-period moving average is above the 50-period moving average, and the distance between the two is widened, indicating strength by the buyers. The RSI oscillator is overbought, revealing the aggressiveness of the buyers. During that upward move, a 4-h Bullish Engulfing Order block developed, which can be valuable for any price setback.
Starting Monday, if the price keeps rising, the R1, around $2236, will be the first resistance area. If the price penetrates it, closes above it and moves upwards, the next resistance area, R2, becomes $2250. On the other hand, if the price starts a corrective phase, it will move downwards, and the first support area, S1, is approximately $2186. Also, both moving averages can act as dynamic support levels. If the price declines further, the next support area, S2, is around $2171.
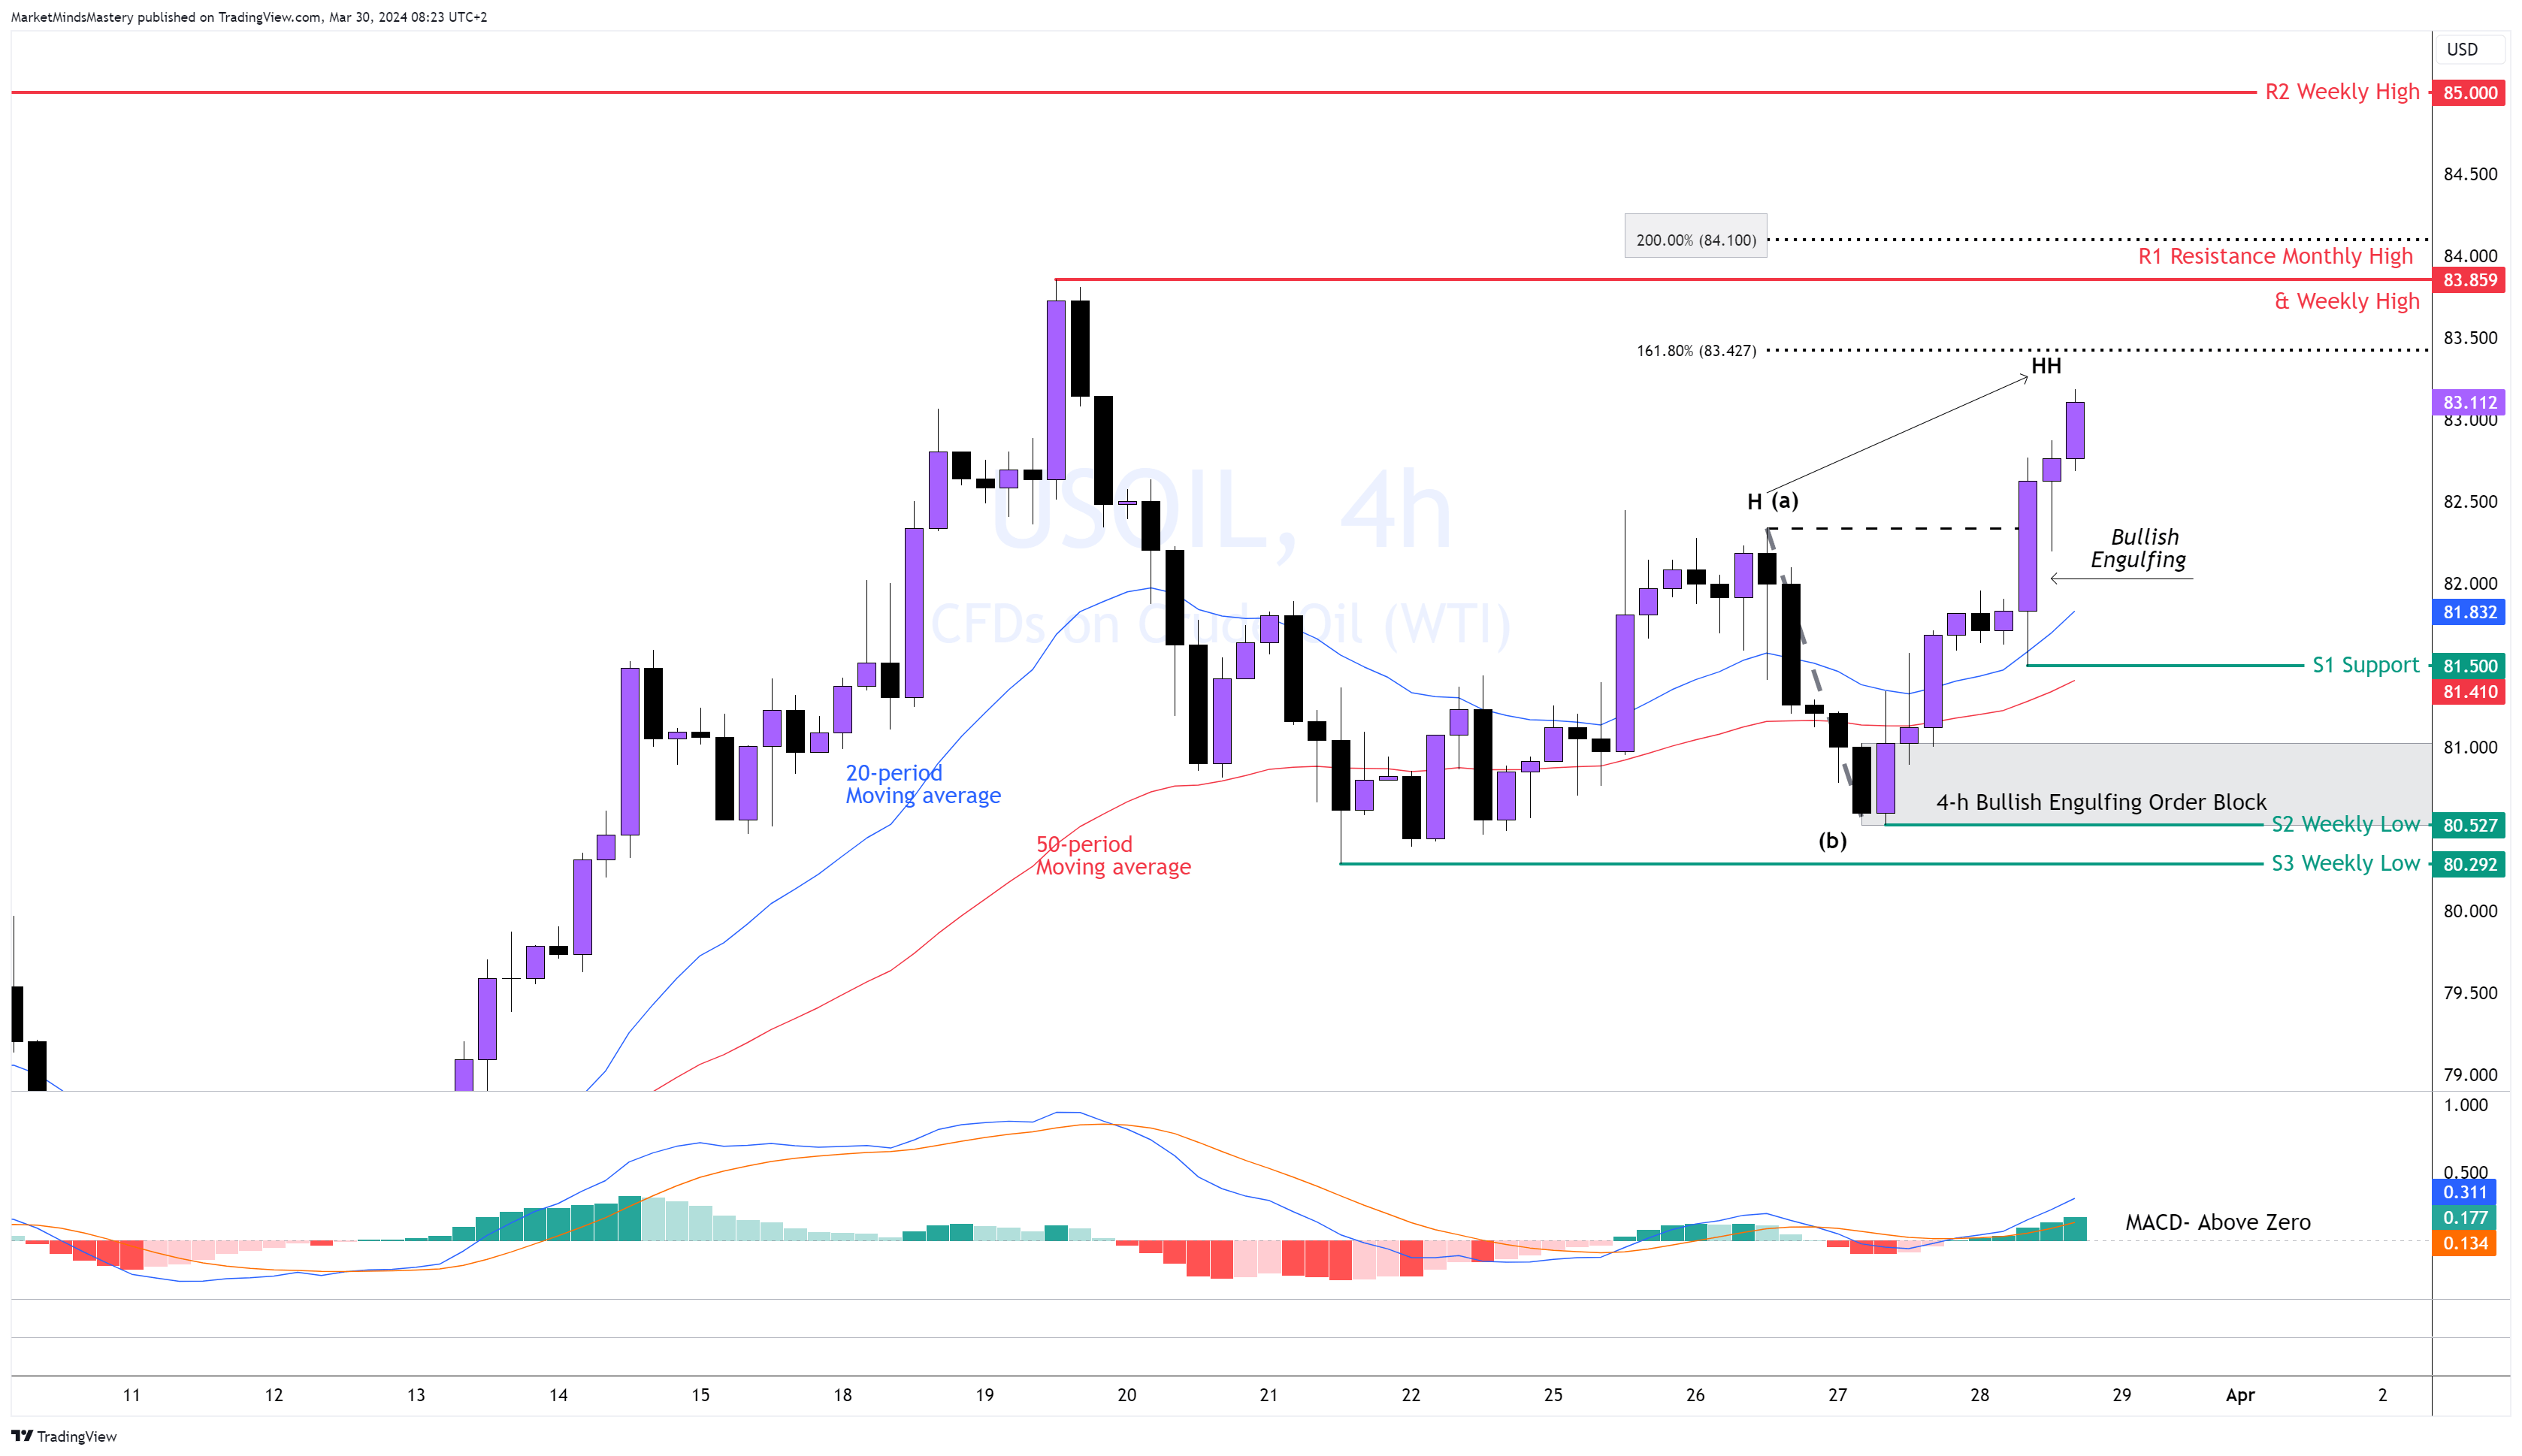
US OIL, 4H
The head and shoulder reversal pattern failed last week, and the price bounced from the area of $80.50 at point (b), moved upwards and created a higher high, which is a bullish indication. The 20-period is above the 50-period, indicating bullishness in the market. Regarding the MACD, the MACD line (blue) crossed above the Signal line (orange), and they are both above the zero line, indicating that the buyers are in control of the OIL market.
If the price continues progressing upward, the first resistance area, R1, is approximately $83.85. If the price breaks the R1 close above it and keeps increasing, the 200% Fibonacci Extension will become the target based on the swing created by the high at point (a) to the low at point (b). Conversely, if the price moves downwards, the first support area, S1, becomes the low of the Bullish Engulfing that created the impulsive upward move, around $81.50. If the level doesn’t hold and the price breaks below it, the next support area, S2, is approximately $80.52, the previous week’s low.
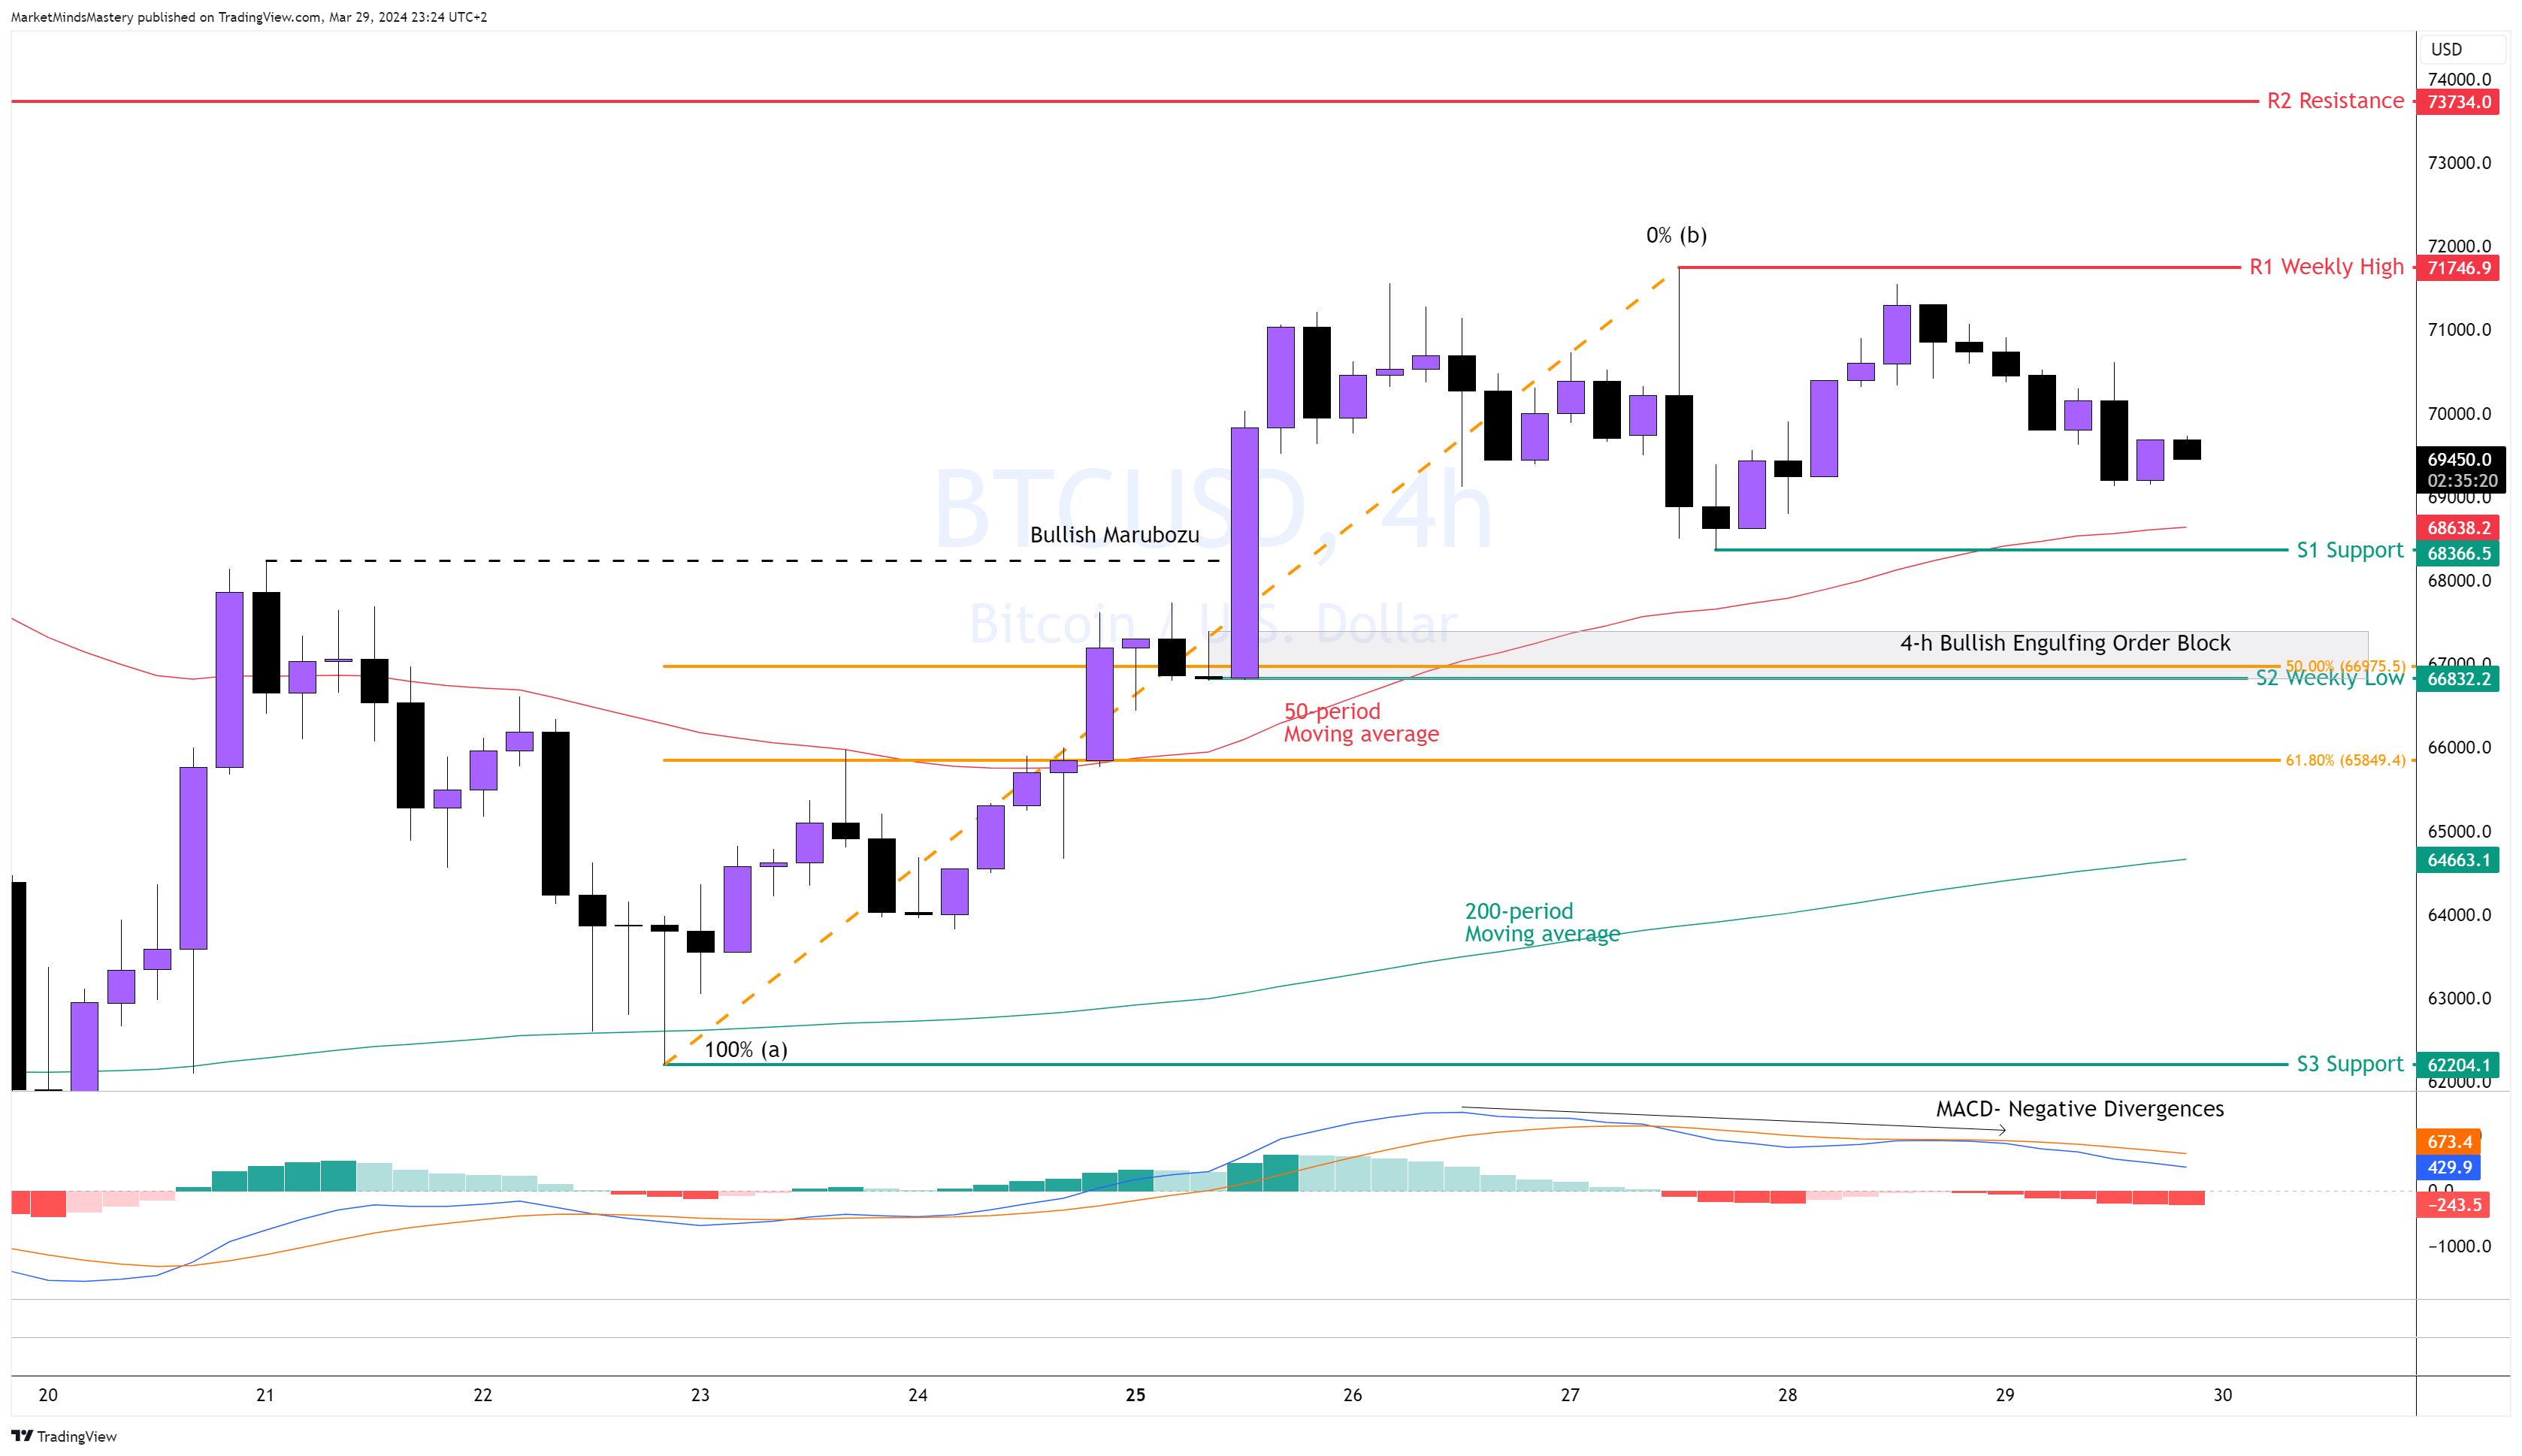
BTC USD, 4H
Following last week’s move, the price created a new market structure, with the Bullish Marubozu breaking above the valid swing high and the buyers maintaining the bullish move. The 50-period is above the 200-period moving average, indicating a bullish sentiment in the Bitcoin market. The MACD is above the zero line. However, Negative Divergence on the MACD indicates a potential price correction.
If the price continues to increase, the first resistance, R1, will be the previous week’s high, approximately $71746. If the price decisively penetrates the R1, closes above it and moves upwards, the next resistance, R2, is around $73734. Conversely, if the price moves downward, the first support area, S1, is around $68366. A break and a close below the S1 can lead the price to the next significant support level, S2, the previous week’s low, around $66832. This level comprises 50% Fibonacci retracement from point (a) to point (b) and a 4-hour Bullish Engulfing Order Block.
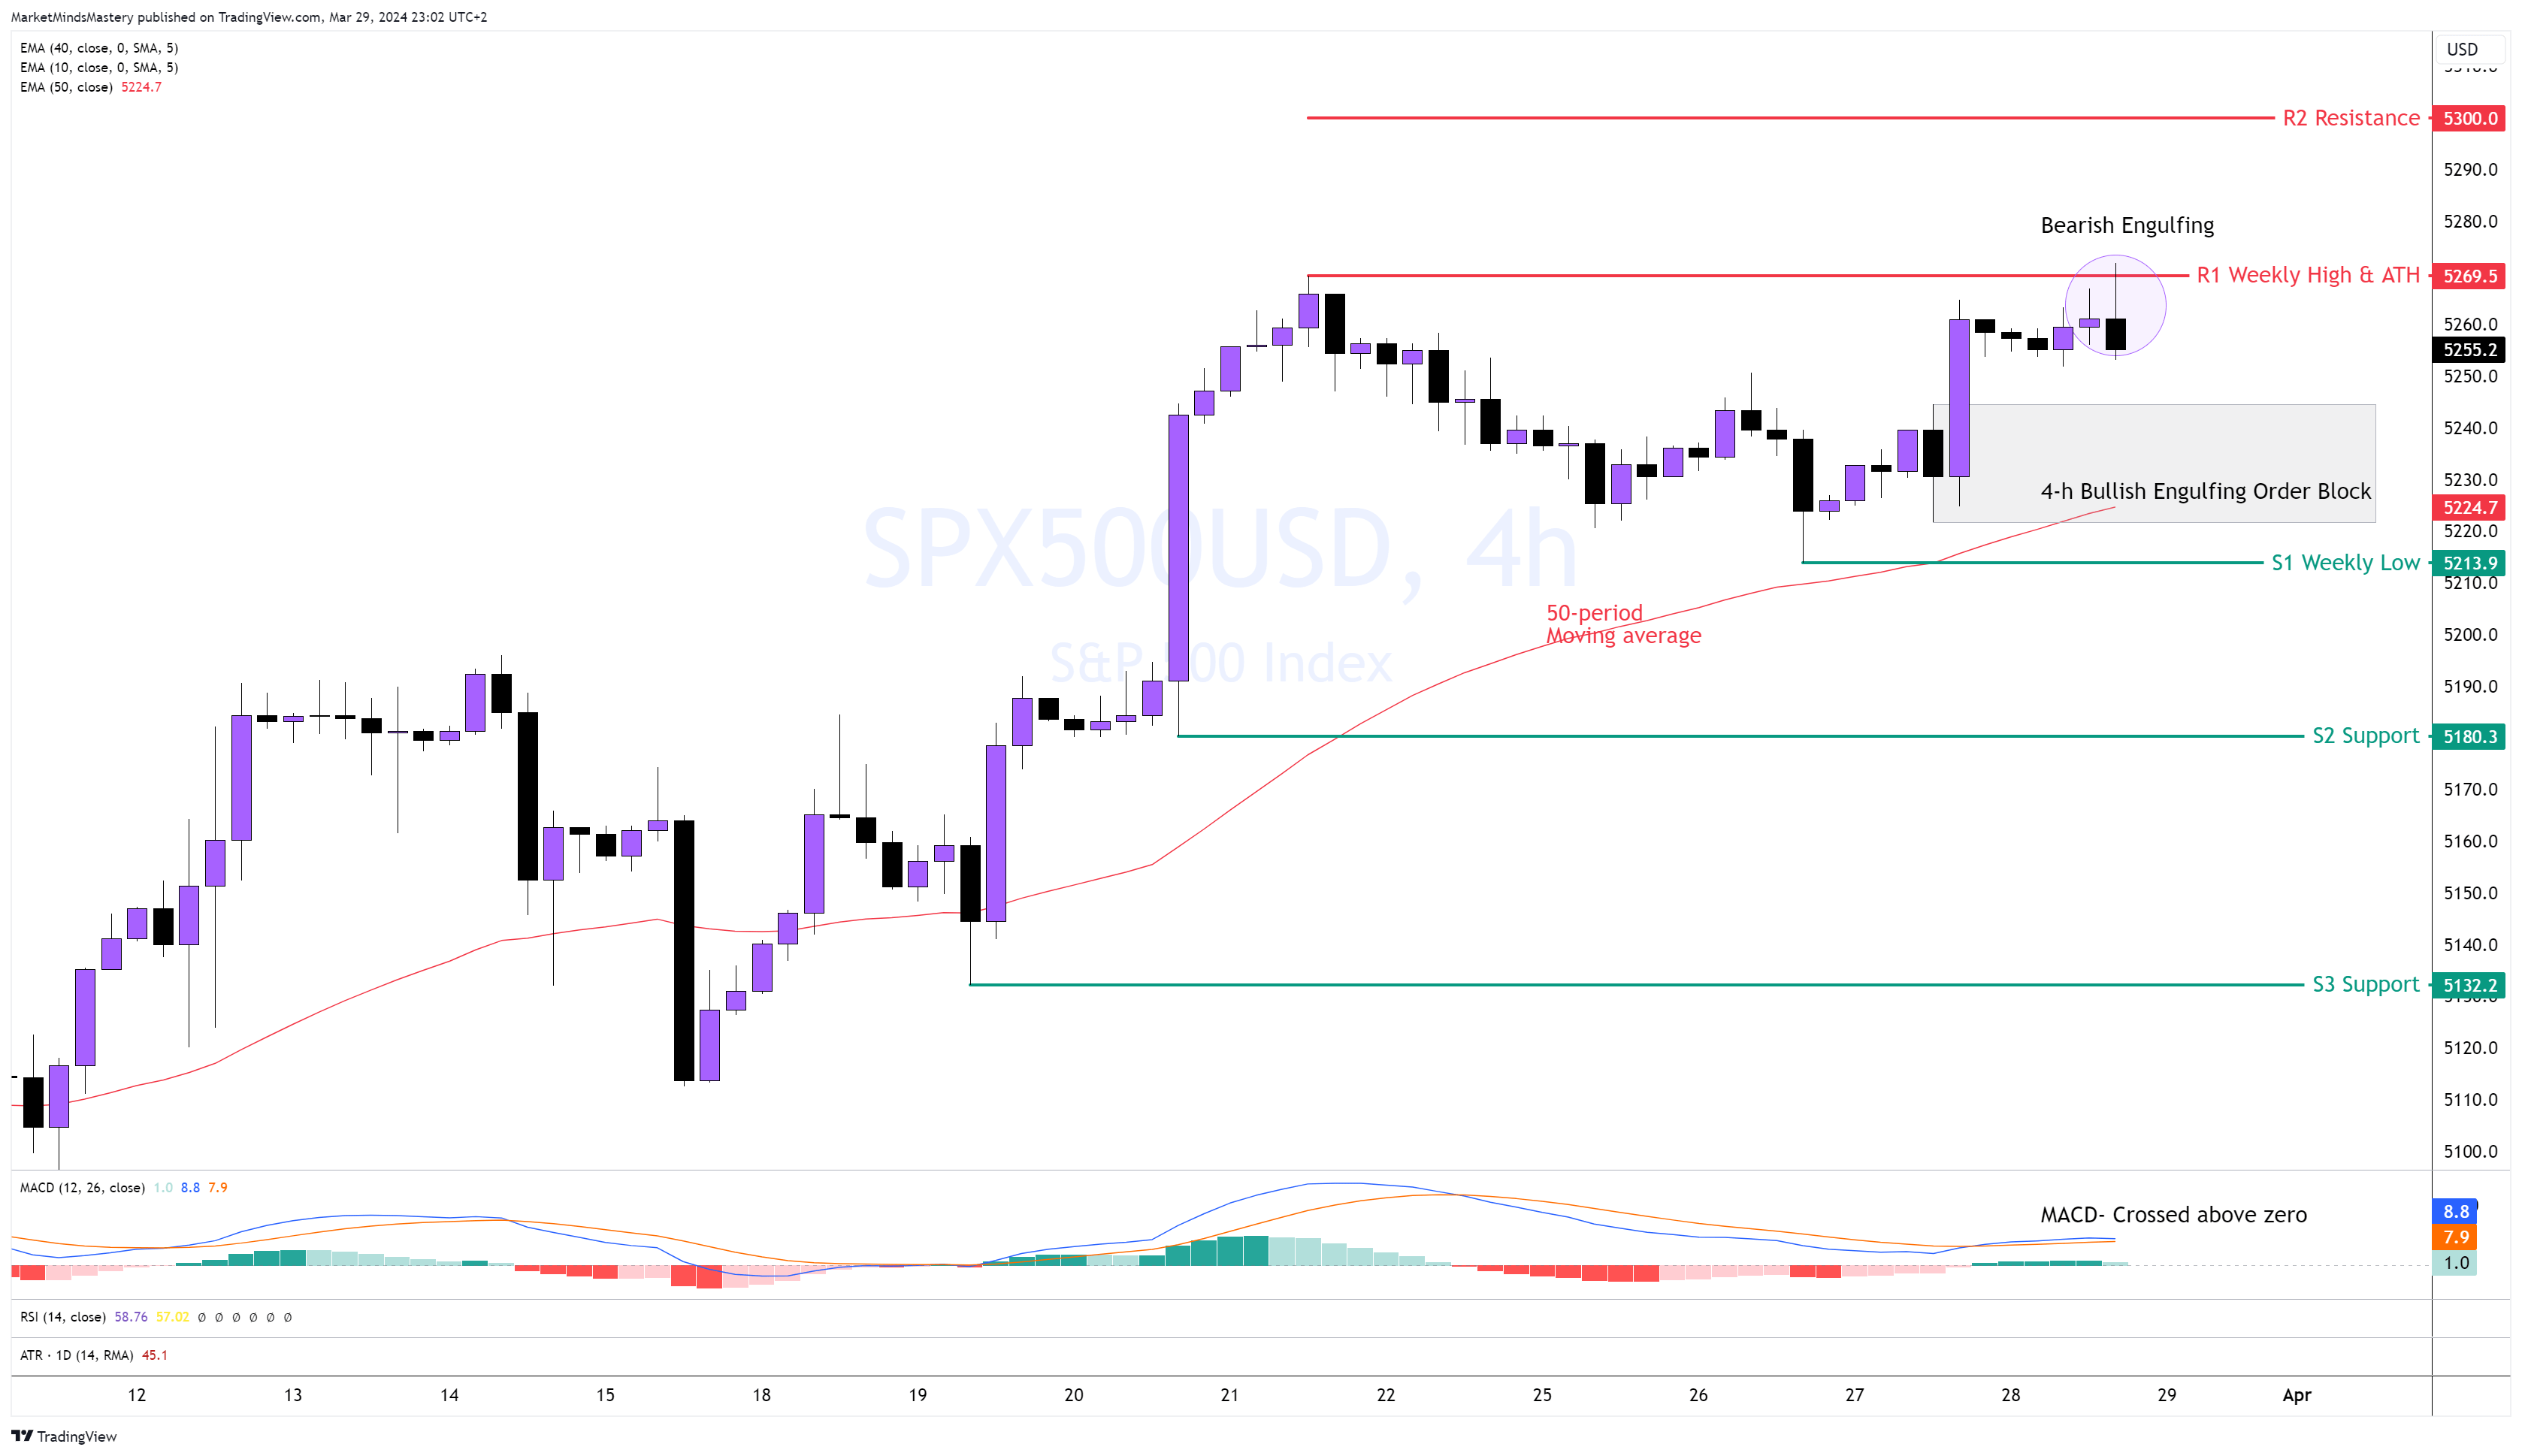
SP 500, 4H
At the end of last week’s trading session, the price False Break Out the All-Time High price around $5269 and ended up as a Bearish Engulfing candlestick. However, the price maintains its upward momentum, as the swing low, which causes the last upward move, hasn't penetrated. The price is also above the 50-period moving average, indicating bullishness. The blue line (MACD Line) crossed above the orange line (Signal Line) on the MACD indicates a bullish sentiment.
Starting Monday, if the Bearish Engulfing fuels a downward move, the first support level, S1, is approximately $5213, consisting of the previous week’s low and the 50-period dynamic moving average. If the price closes under the S1 and moves lower, the next support area, S2, is approximately $5180. Conversely, if the price rises and breaks above the high of Friday’s Bearish Engulfing’s candle, the next resistance, R2, will be around $5300.
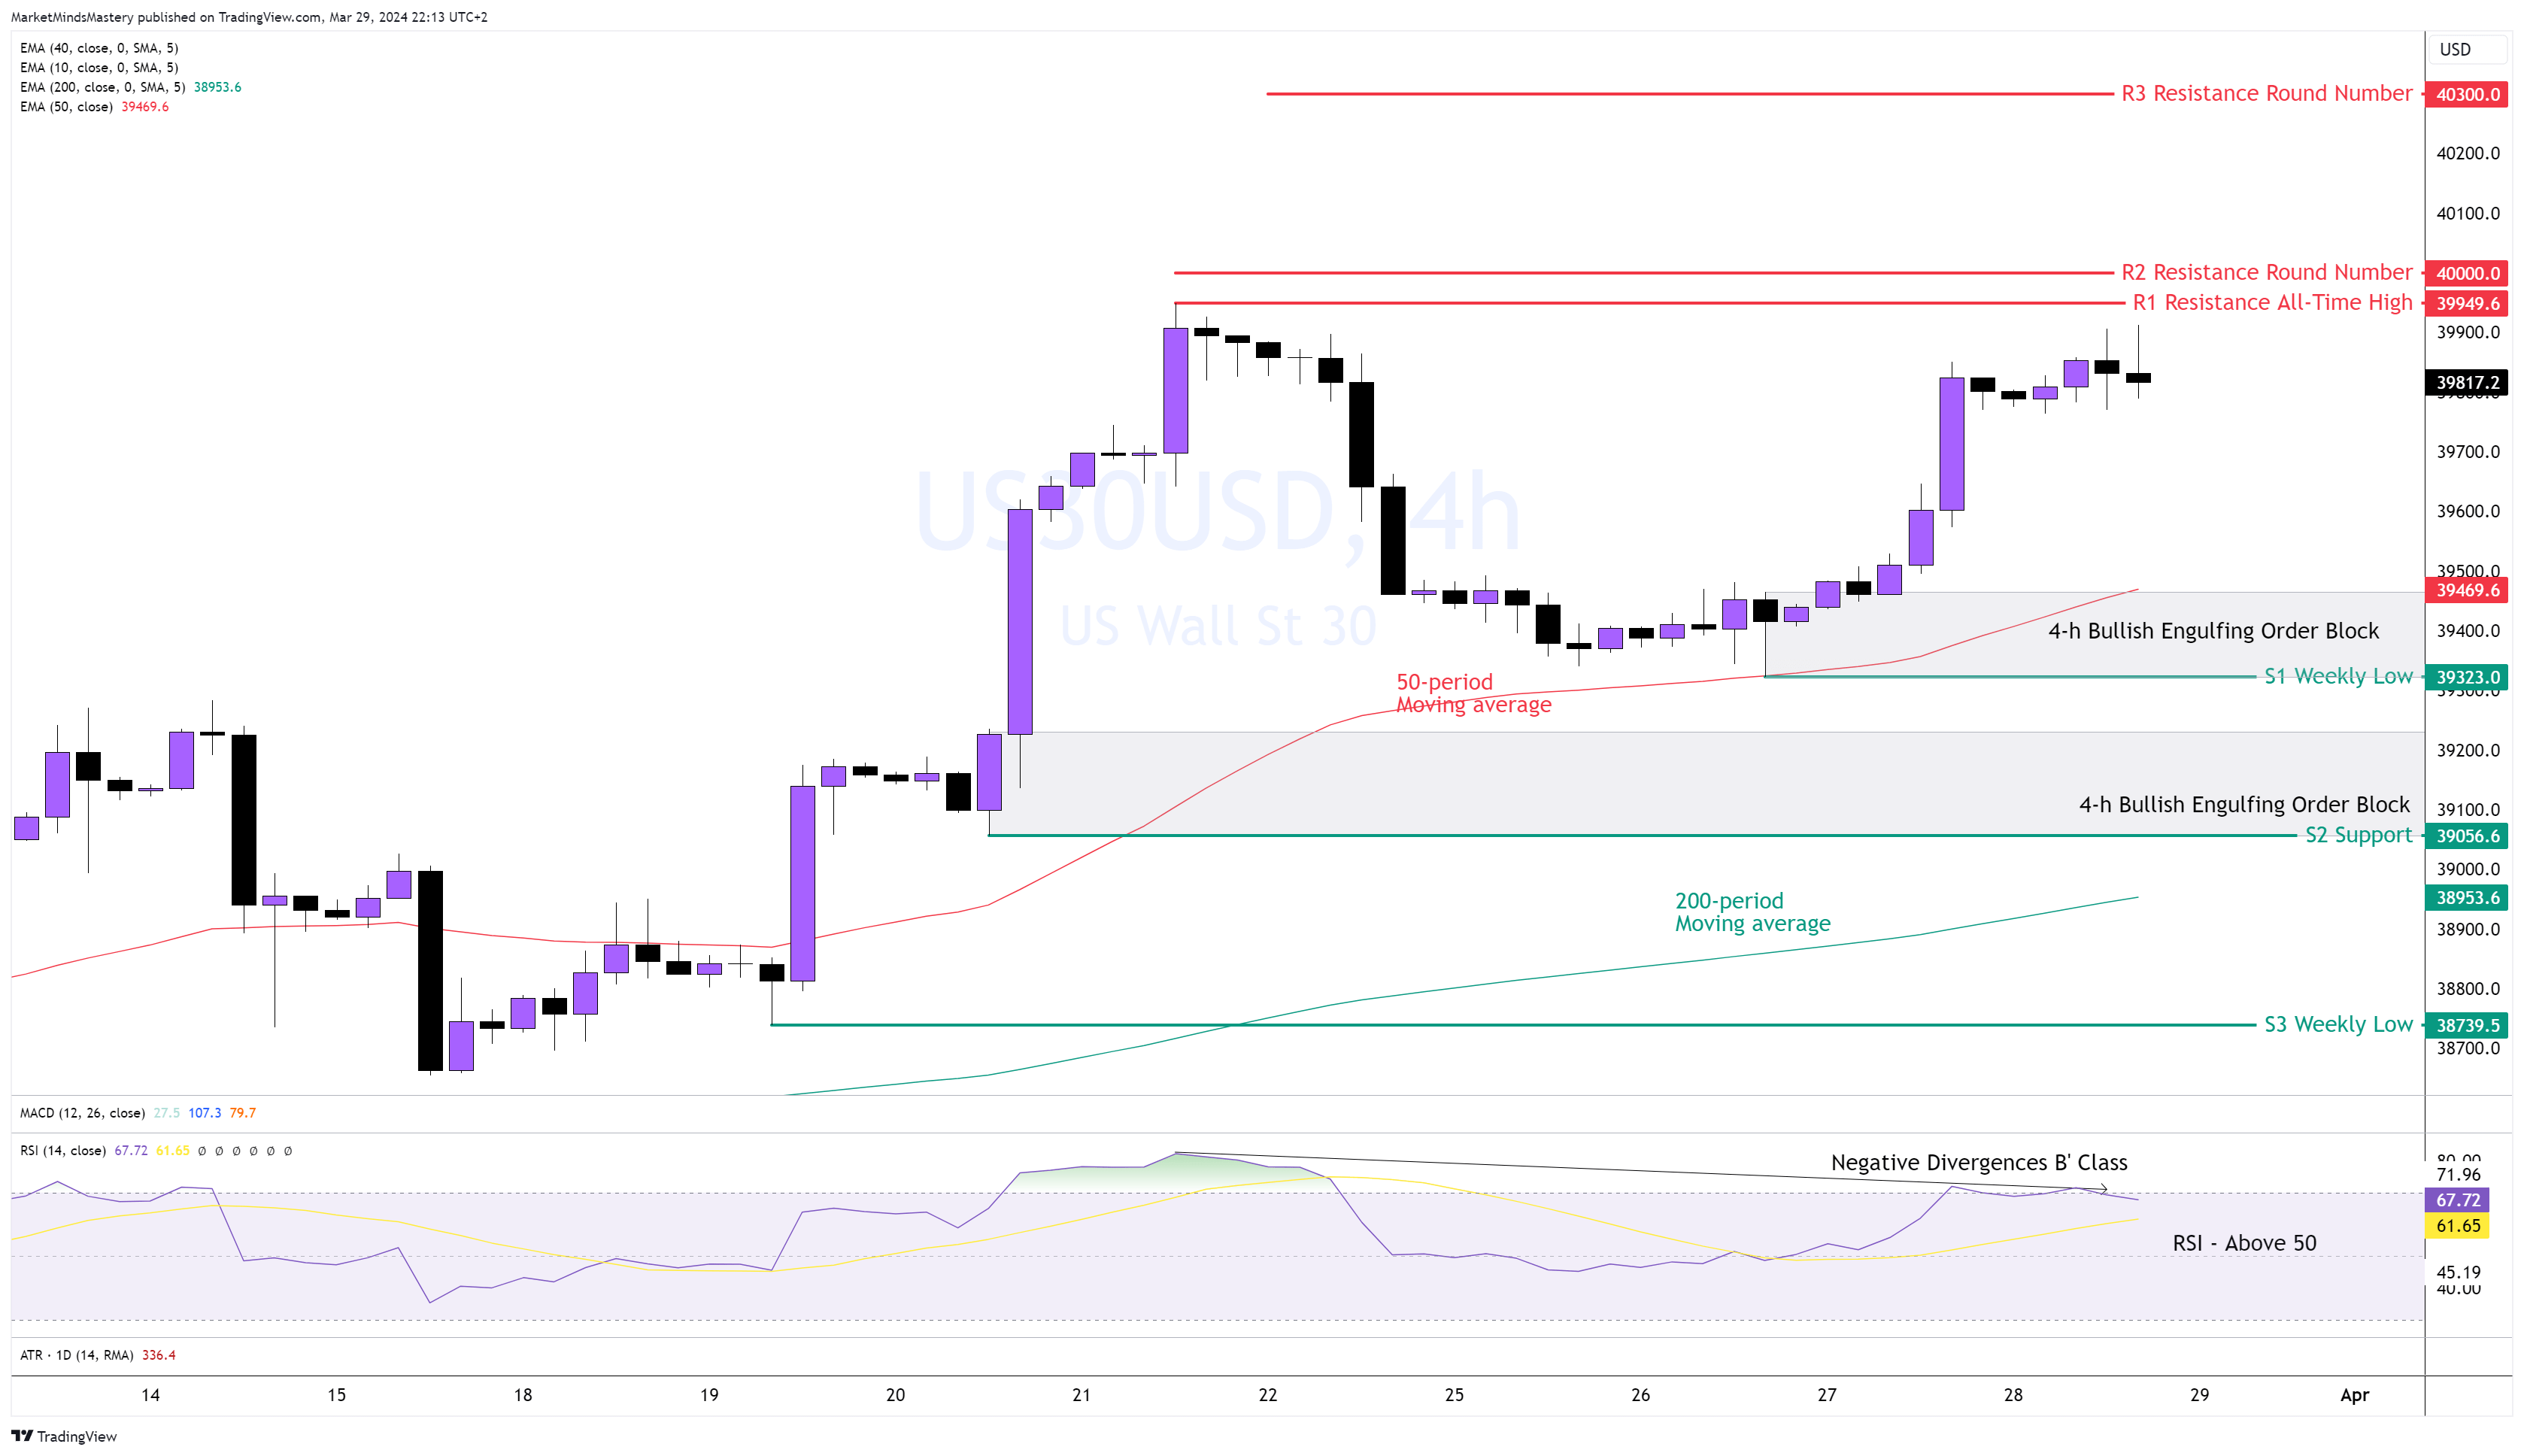
US 30, 4H
Last week, the price filled up almost the “gap” in the 4-hour time frame and found support on the 50-period moving average, from where it bounced off and moved upwards. Observing the candles, the buyers dominated the market but couldn’t register an all-time High at the end of the week. Therefore, the price remains under the $40000.
As per the chart, an equal top is formed, but a double top still needs to be formed. In a previous analysis, we explained what a double-top reversal pattern is.
This chart formation will be developed as an Ascending Triangle if the price increases and breaks above $40000 or as a Double Top only if the price closes under the S1 weekly low, as pointed out on the chart.
The 50 is above the 200 period moving average, indicating a bullish market. The RSI is above the middle line, indicating a bullish market. However, the RSI also printed Negative Divergences B’ Class, suggesting a weakness of the last upward move from $39323 to $39900.
Starting Monday, if the price declines and moves backwards, the area around the $39400 solidly above the S1 support, which also hosts a Bullish Engulfing Order Block, can act as a solid support. A further decline will lead to the S2 support around $39000, with another solid 4-h Bullish Engulfing Order Block. On the other hand, if the price moves upwards, the All-time High of around $39949 will be tested and if the price breaks above it, the $40000 becomes a robust resistance area. A move above the R2 will lead to the next potential residence of $40300.
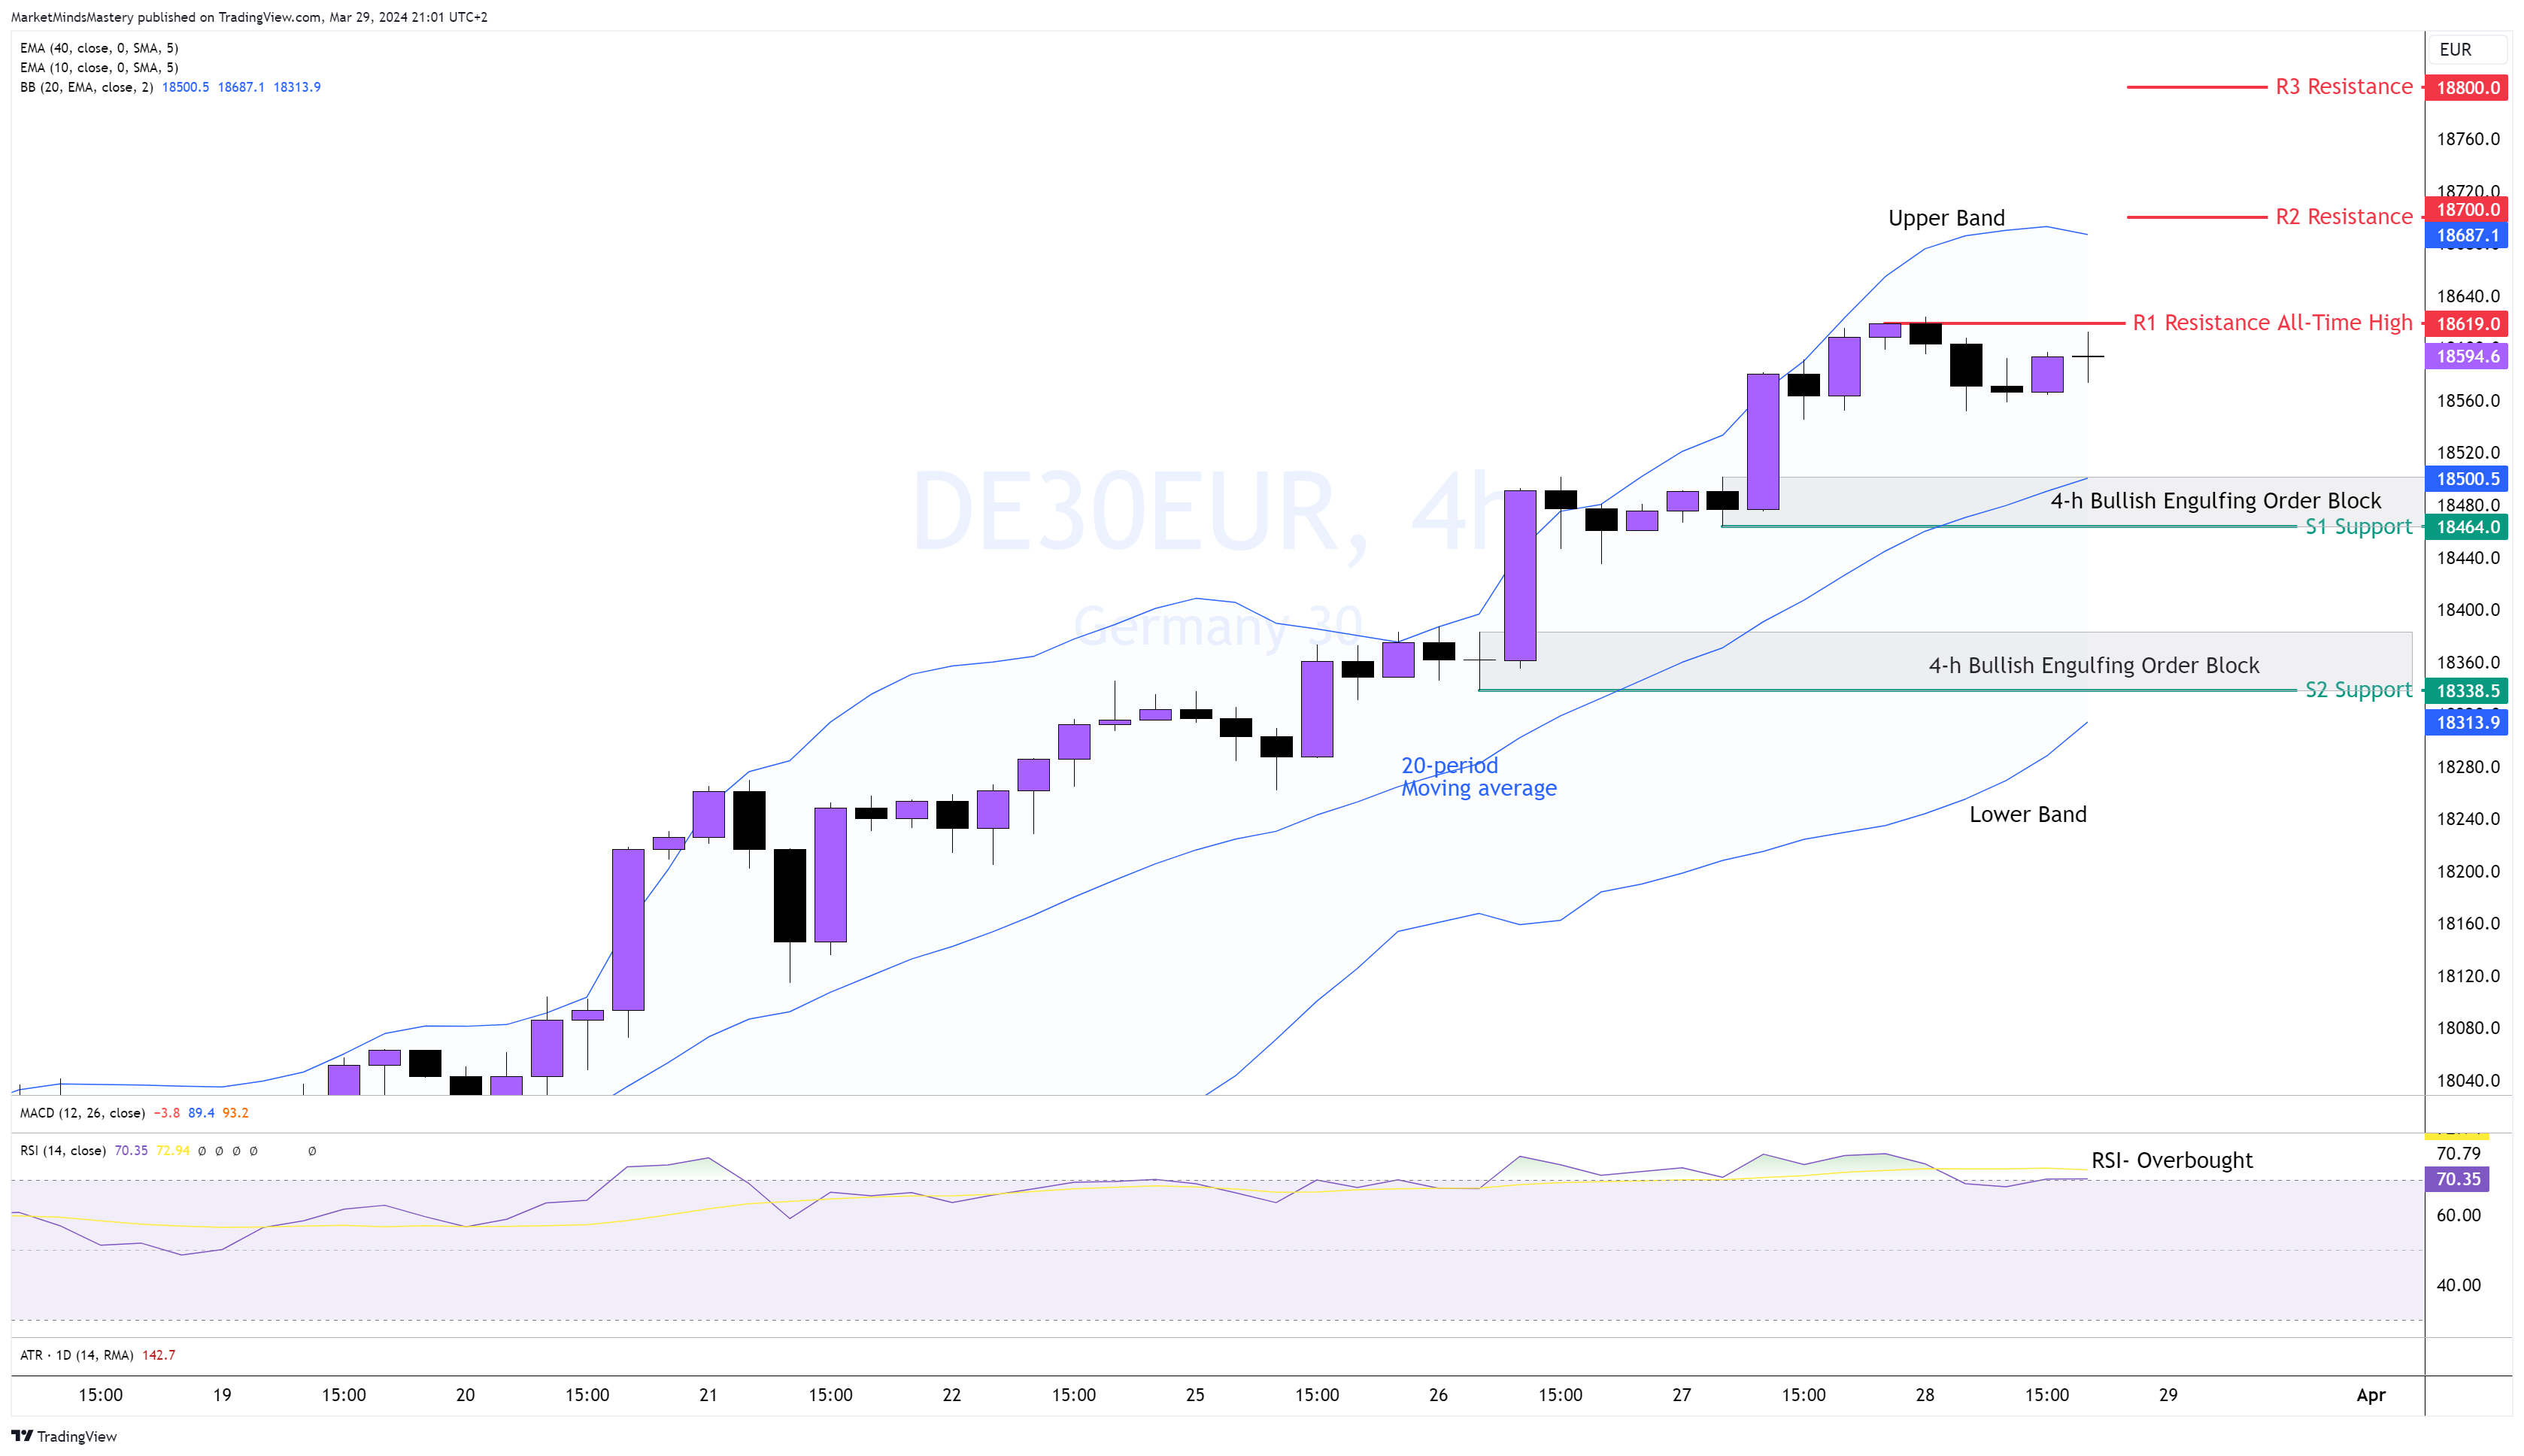
GER 40 4H
Ger 40 breaks every recent swing high and creates another new All-Time High, precisely at the resistance level we forecasted last week on our analysis around the 18600. The price of the German Indicy trades creates consecutive higher highs and higher lows in the 4-hour chart, indicating a bullish market. Also, the RSI is consistently overbought, confirming the bullish strength. Price trades well above the middle of the Bollinger Band, the 20-period moving average, indicating another form of bullish strength. Price corrections occur around 35%-55% of the Fibonacci numbers, which explains the buyers' willingness to keep buying in the market in shallow price retracements. Therefore, if the price continues increasing, the R1 resistance, the new All-Time high price around 18619, becomes the first area of interest. If the price penetrates the R1, closes above it, and rallies, the following resistance areas will be the R2 and R3 around 18700 and 18800, respectively. If the price corrects and retests the 20-period moving average, we will find the first support, S1, is around 18464, which hosts a 4-h Bullish Engulfing Order Block. If the price declines further, the next support area, S2, is approximately 18338.
👉 Click here to check our Challenges
👉 Don’t miss our Free Live Webinars
👉Join us on Discord
Risk Disclosure:
The Trading Pit offers only demo accounts to all users within the Challenges and Signal Provider Agreements (Scaling Plan). All assets and trading activities are purely virtual. Please note that we do not offer CFD (Contract for Difference) challenges to residents of Canada and the United States. All content and information on this website is for informational purposes only and should not be interpreted as financial advice. Also, remember that results achieved in the past are no guarantee of future results. It is essential to understand the risks associated with trading. If you are unsure, always consult an independent financial advisor.