The Trading Pit Week Ahead Market Outlook (April 08 – April 14)
Last week, the markets primarily traded sideways until the NFP announcement. Despite a favourable report for the USD, the market failed to sustain momentum, and weakness in the US Dollar was evident by the end of Friday’s New York trading session. Looking ahead to this week, it could be dubbed as “Interest Rates Week.”
Switzerland’s National Bank Chairman Jordan’s speech will be the main event on Monday.
The European Central Bank Lending survey will be the only event scheduled for Tuesday. This irregular survey aims to enhance the Eurosystem’s understanding of financing conditions in the euro area.
Moving to Wednesday, during the Sydney Trading Session, New Zealand will release its Interest Rate report, expecting an unchanged rate of 5.5%. It's worth noting that when a Central Bank maintains unchanged Interest Rates, it often leads to currency weakness. Later, during the New York trading session, the US will release its Consumer Price Index, with forecasts of a surprising increase.
The previous report indicated a 3.2% CPI in the US, expected to rise to 3.4% this time. Additionally, the FOMC minutes will be published. Bullish Engulfing patterns have been observed on the weekly charts of EURUSD, AUDUSD, and NZDUSD. If events turn unfavourable for the USD and the market follows suit, these major currency pairs could lead to uptrends.
The final significant event of the day will be interest Rates in Canada, as reported by the Bank of Canada during the New York Trading session. Consensus estimates suggest an unchanged rate of 5%. Given the relatively weak performance of the Canadian dollar last week and an unchanged interest rate, further weakness in the Loonie may be expected.
On Thursday, China will report its CPI (Consumer Price Index), with the previous number currently at 0.7%. Despite the significant CPI outcome, all market participants will keenly anticipate the Interest Rates report by the European Central Bank during the New York trading session.
The ECB is expected to maintain its interest rate unchanged at 4.5%. Thirty minutes after the report, a press conference will follow. Additionally, in the US, the Producer Price Index, including Food and Energy, will be reported with expectations of a 0.3% increase from 2% to 2.3%.
Lastly, on Friday the 12th, the Harmonized Index of Consumer Prices is expected to remain at 2.3% in Germany. The last event of the week will be the Michigan Consumer Sentiment Index, forecasted to decline to 79 from 79.4.
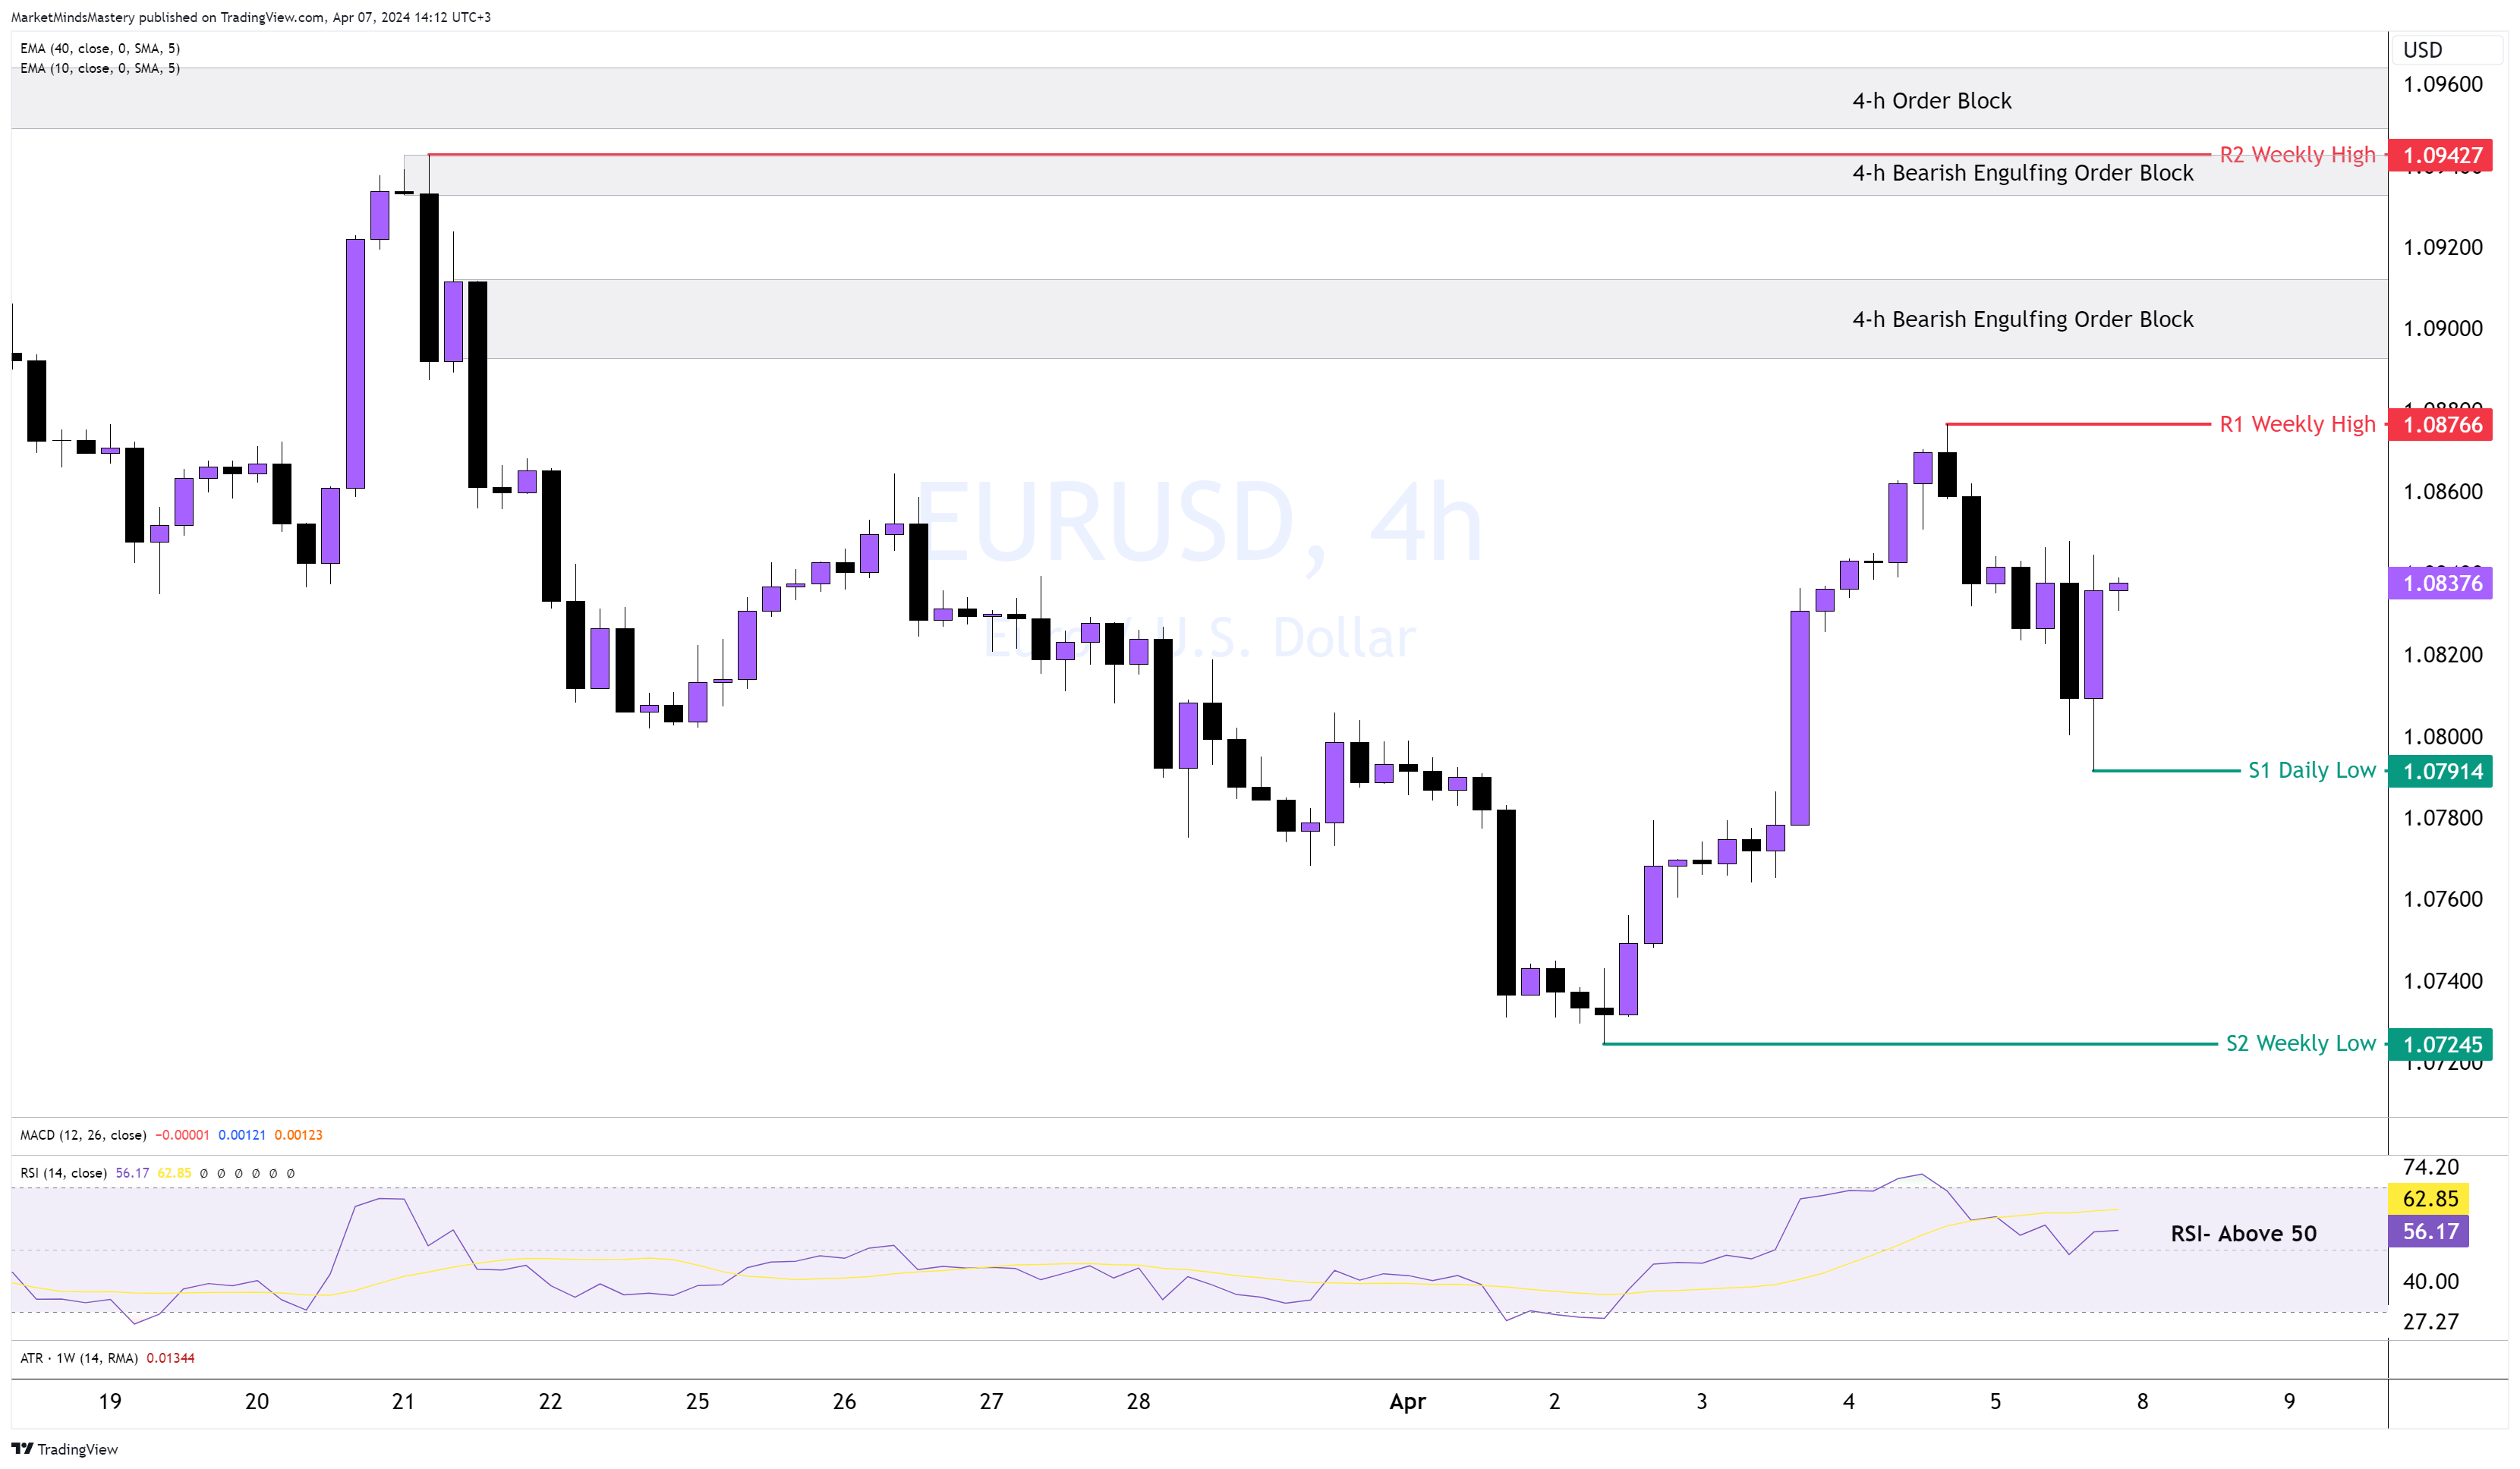
EUR USD,4H

Following the NFP announcement last Friday, the currency pair's price dropped and, within the next few hours, retraced the move 100%. Drops in the price and recovery like this reveal weakness by sellers to maintain selling pressure, and possibly buyers will control the market.
The price on the 4-hour chart created a market structure with a higher high, which can be taken as the first sign of the development of an uptrend. Additionally, the RSI is above 50, indicating bullishness.
If the price increases, the previous week’s high becomes the first Resistance R1 around 1.08766. If the price closes above the R1 and moves upwards, it will enter into the Bearish Engulfing Order Block, as seen on the chart. However, above the Order Block, another Bearish Engulfing Order Block formed at a close distance, which seems more prominent as it formed at the swing high around R2 resistance at 1.09427. If the price drops, Friday’s low is the first S1 support around 1.07914. If the price close under the S1 and moves downwards, the next support, S2, is a weekly low of around 1.07245.
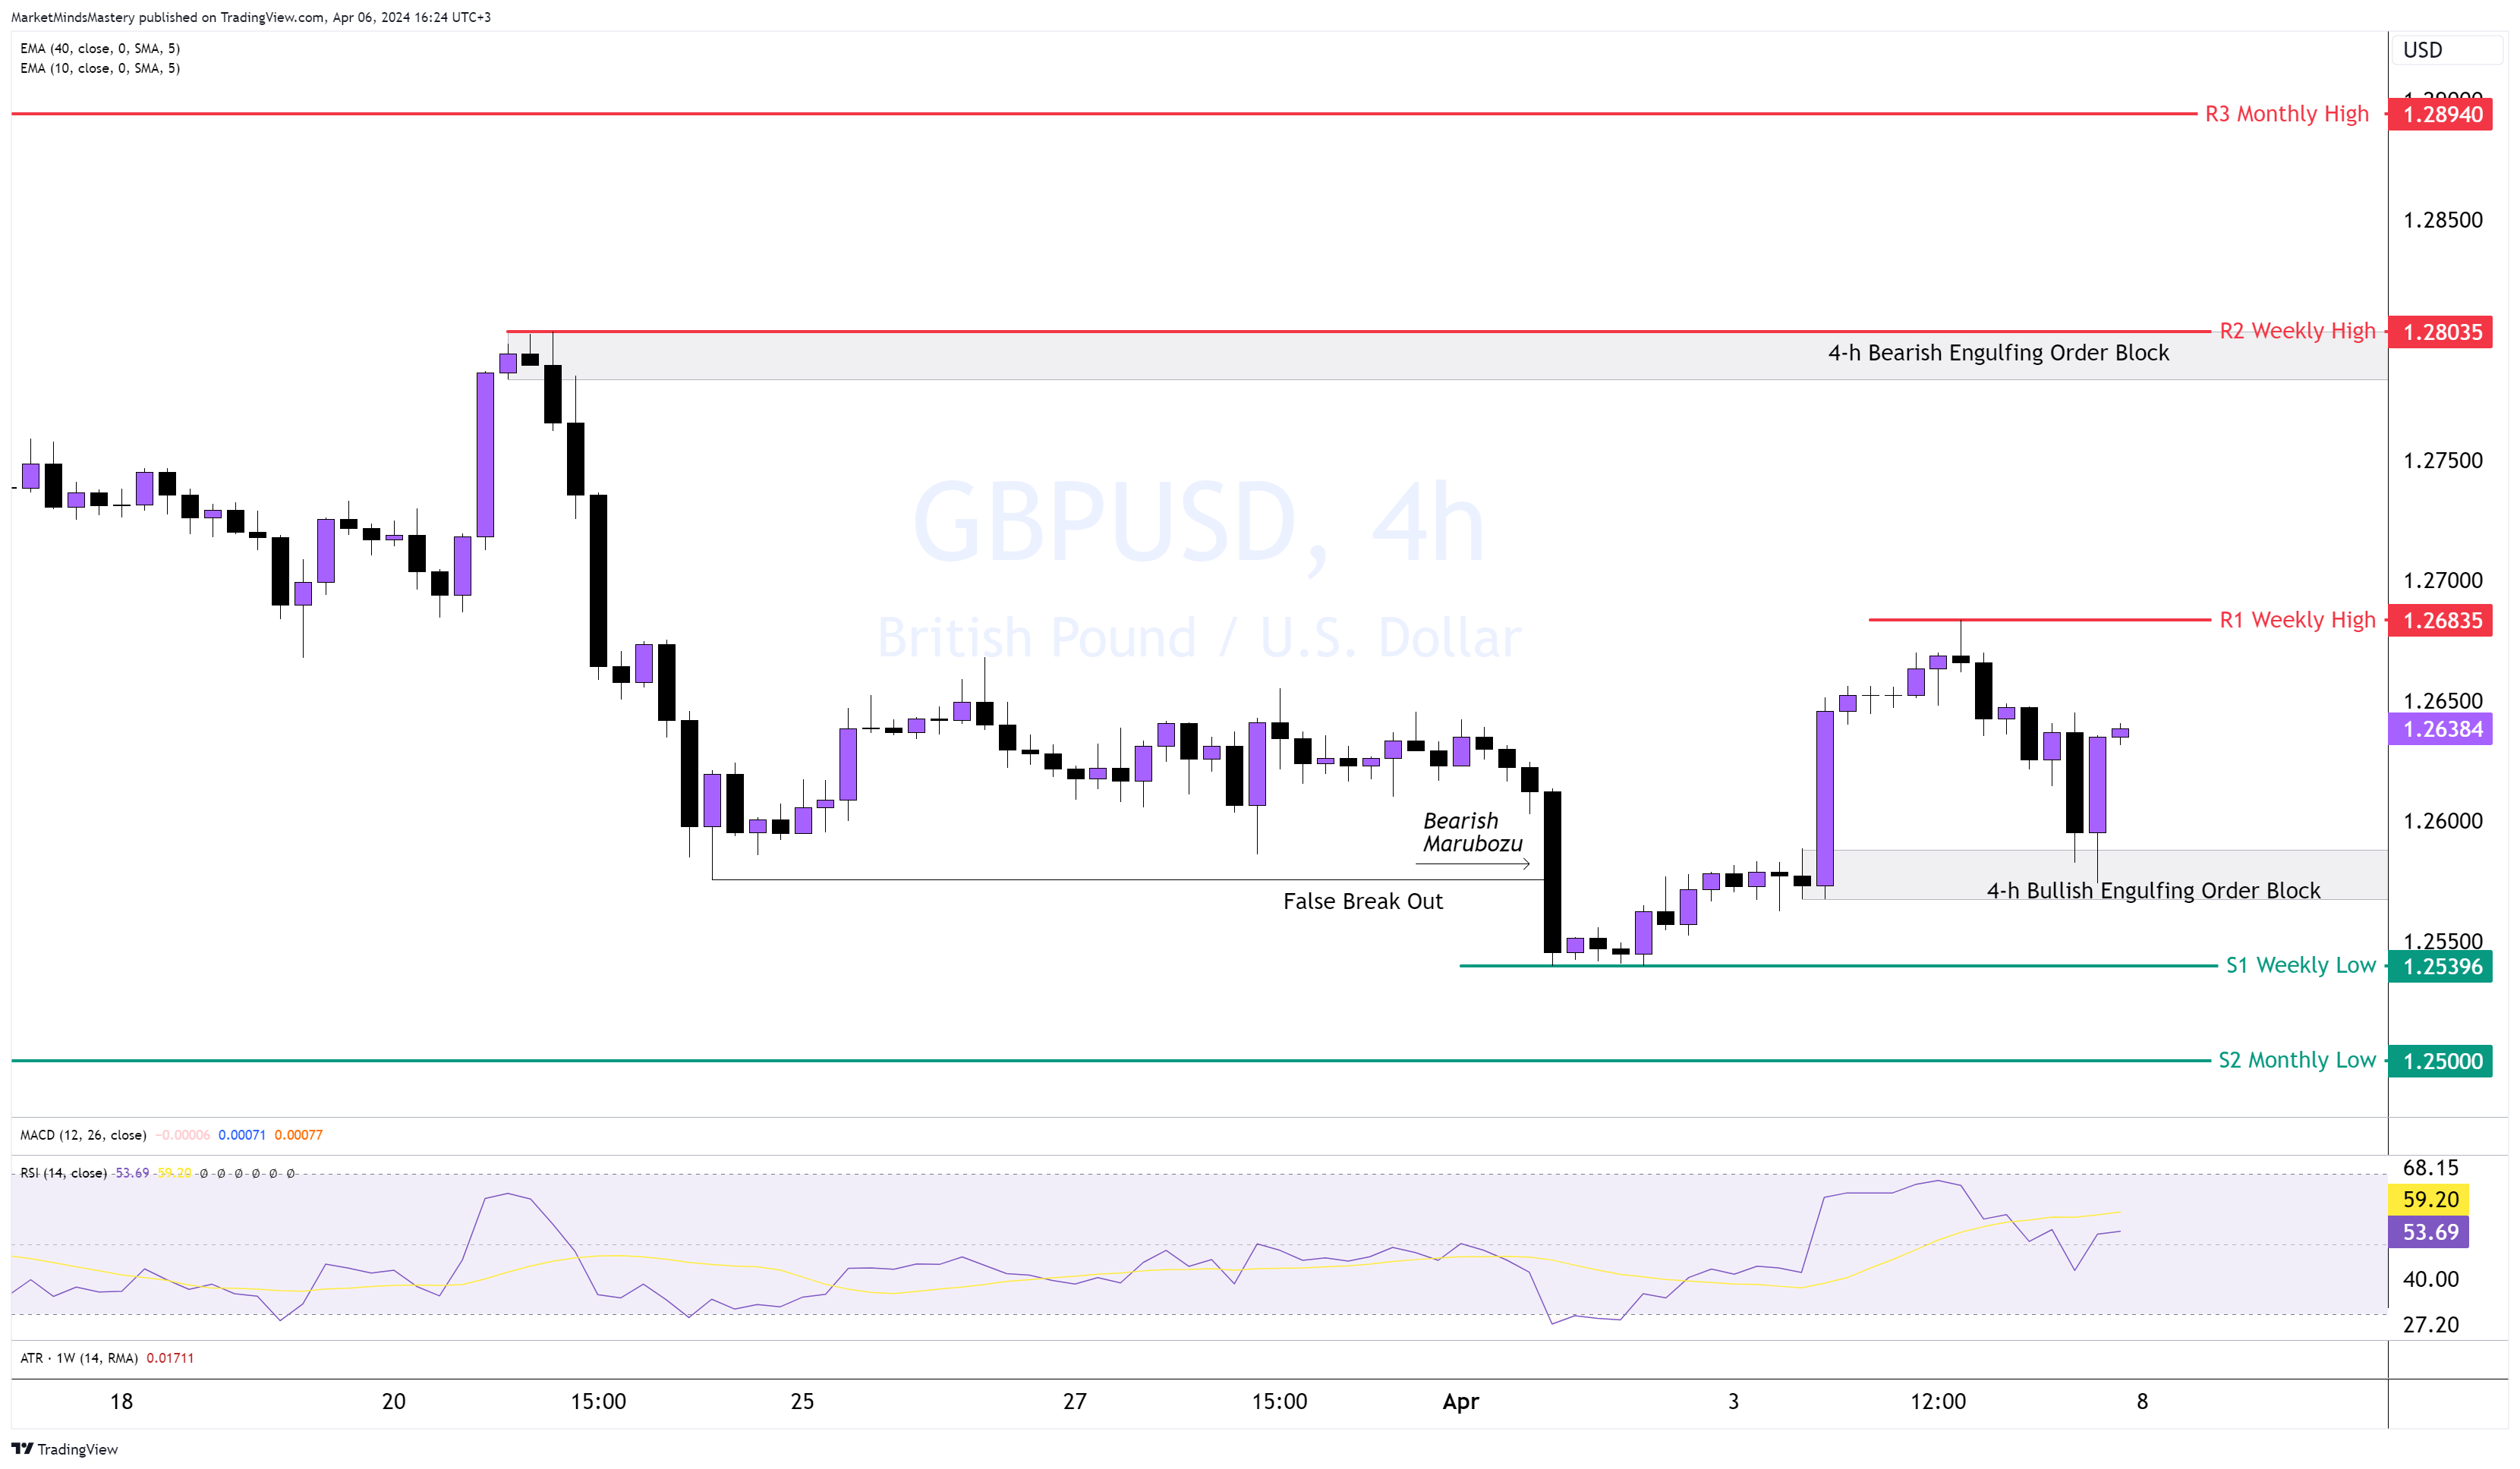
GBP USD, 4H
In an attempt to resume the downward move on the 4-hour chart, last week's price created a Bearish Marubozu candle, without the sellers being able to follow through, ended falsely breaking the 1.25500 level—the price since bounced off and registered higher prices. Last Friday, after the NFP announcement, the price bounced off a Bullish Engulfing Order Block created last Wednesday.
Starting Monday, if the price continues to increase, the previous week’s high will be the first R1 resistance, approximately at 1.26835. A break and rally above the R1 allows the price to move upwards until the R2 resistance, around 1.28035. A Bearish Engulfing Order Block initially started the downward move in this area. The distance between R1 and R2 can be considered significant because the price left an unmitigated “Gap” 3 weeks ago.
If the price meets selling pressure and moves downwards, the first support area, S1, is the previous week’s low, approximately 1.25396. A move further down can be potent because the price will create a new market structure, and the S2 support will be a monthly low, around 1.25.
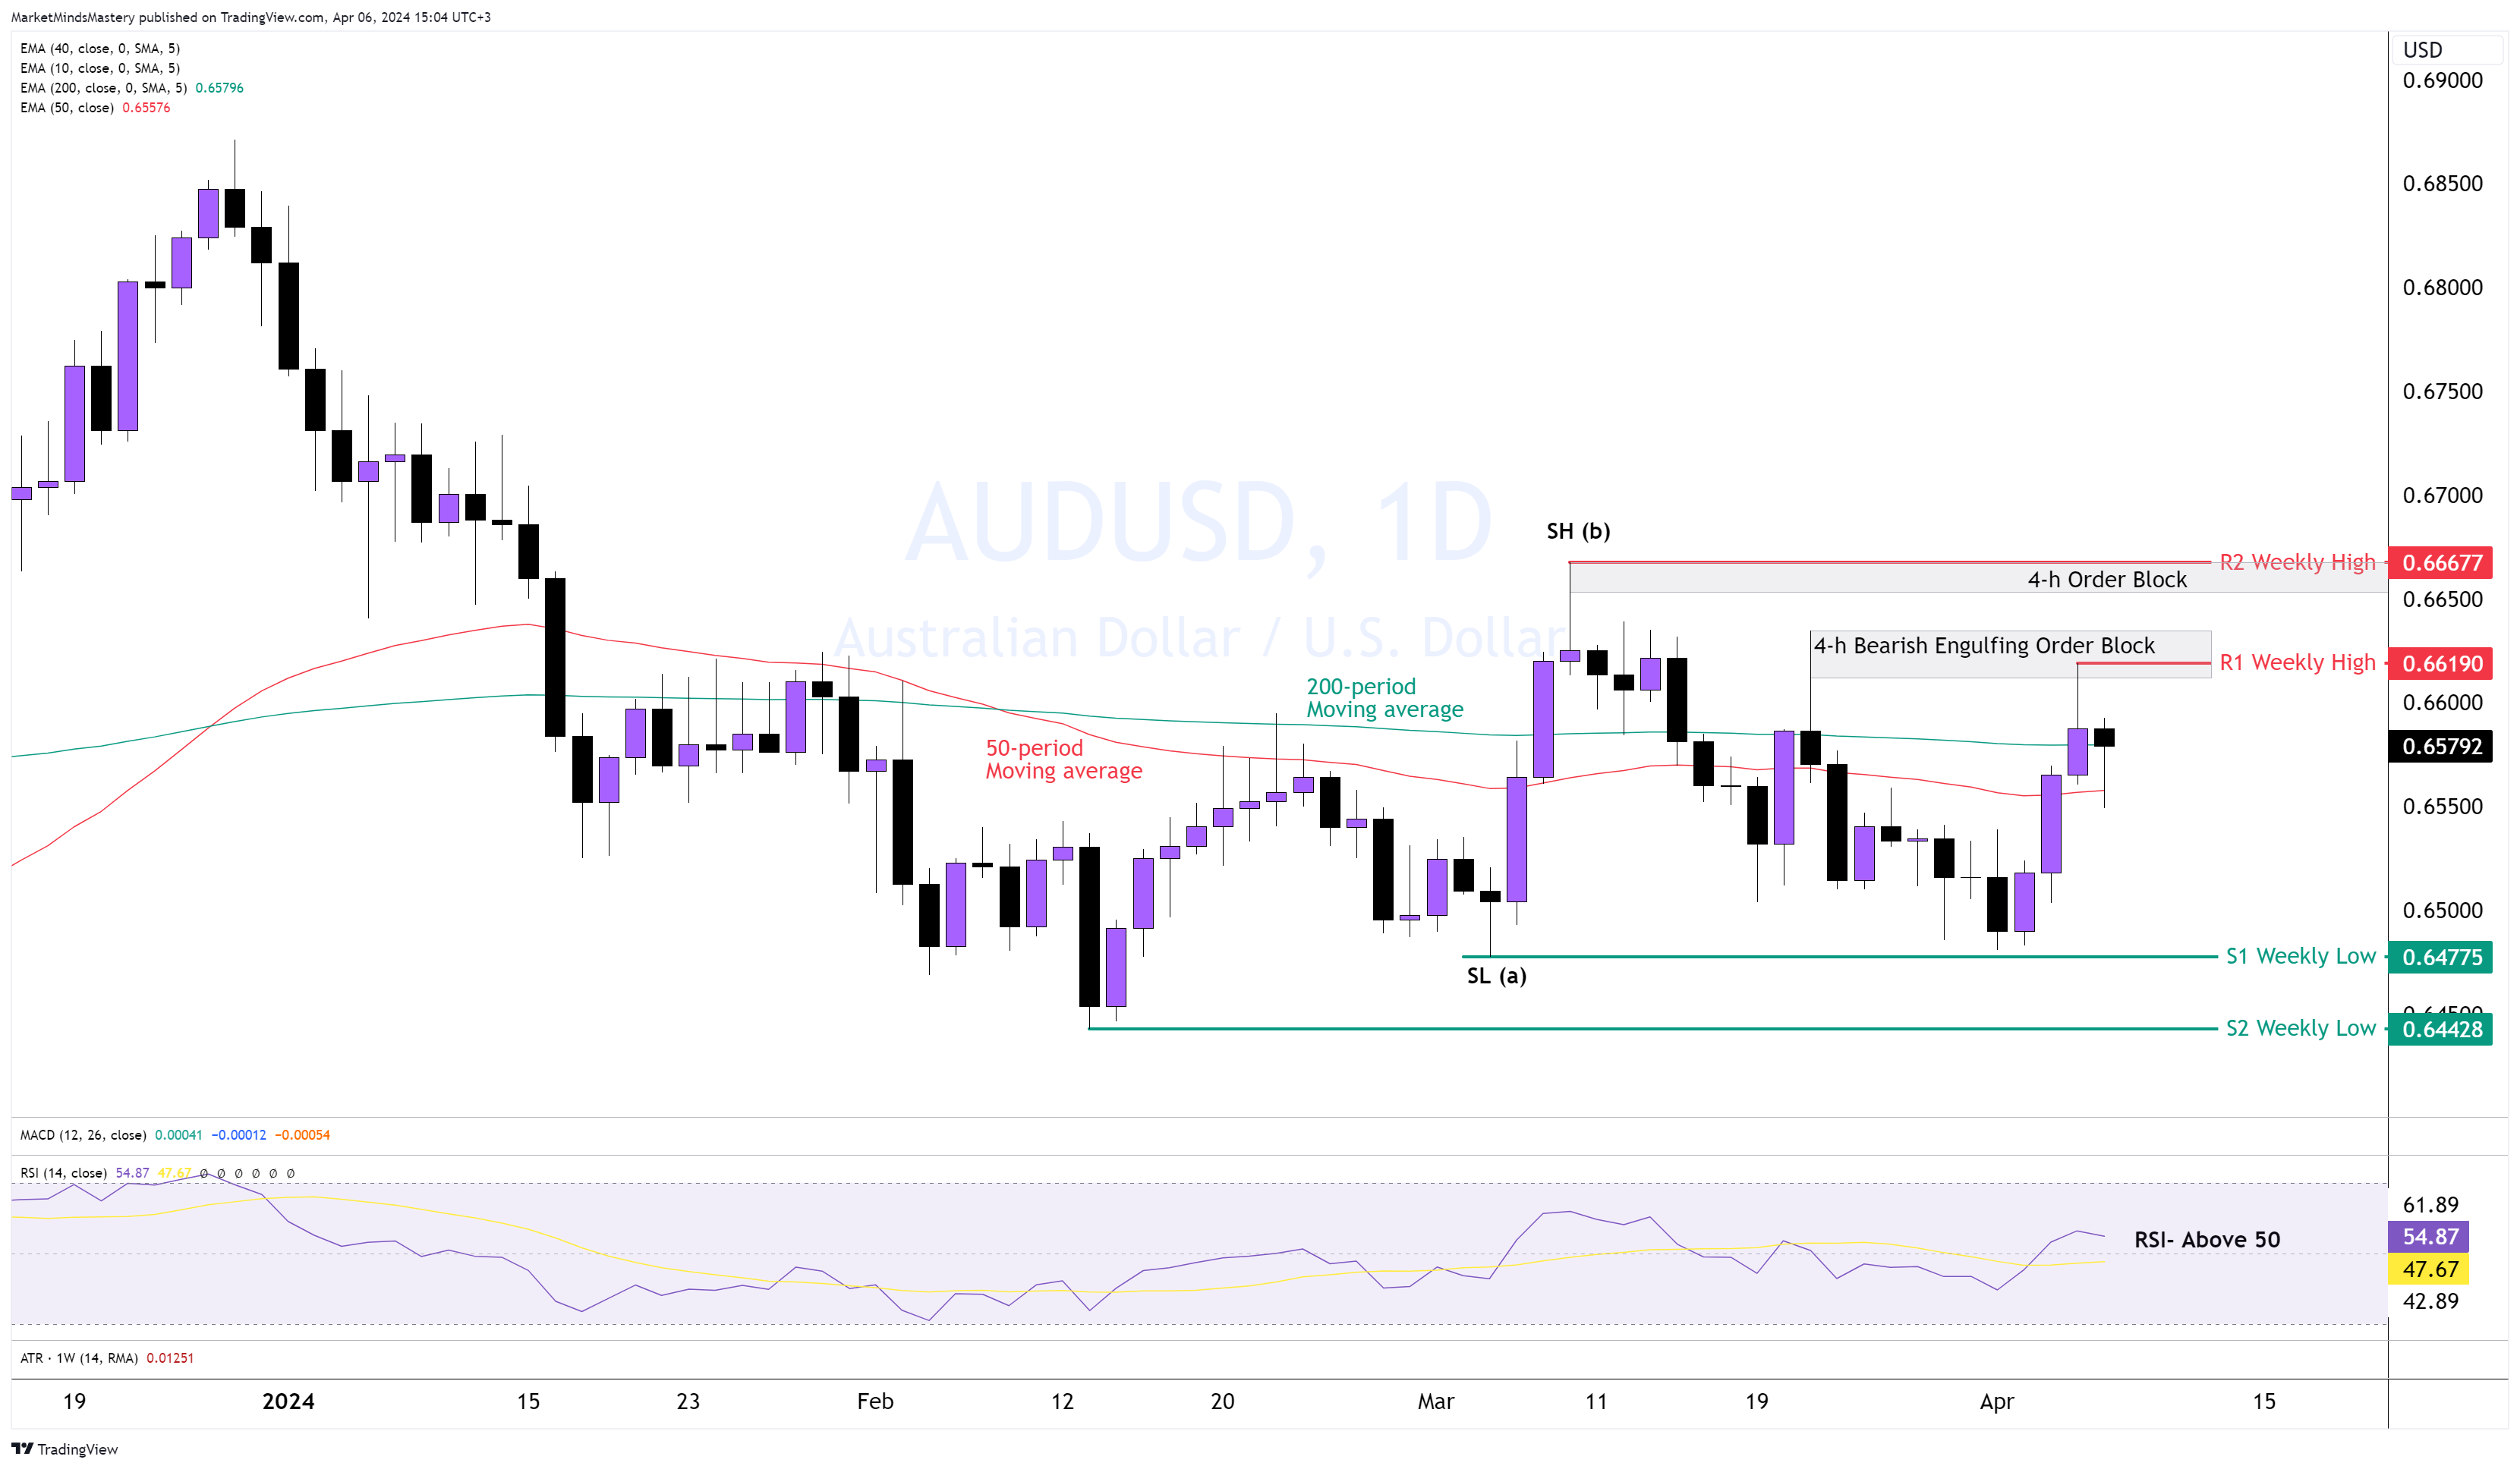
AUD USD Daily
Following the test of the 0.65000 area, last week's price was traded until 0.64775, but it found support and bounced off, moving upwards. On the Daily chart, the price turned from a downtrend to an uptrend, with the swing low SL(a) and the swing high SH(b) being the relevant and still in tack swings low and high, respectively. The flat 50- and 200-period moving averages indicate a trendless market. The RSI is above 50, suggesting that during the average of the last 14 trading sessions, the buyers were more potent than the sellers.
Any intermediate trends- which means trends developed within the range of SL(a) and SH(b)- need to be traded cautiously during the intraday market momentum.
Starting Monday, if the price moves upwards, the previous week’s high will be the first R1 resistance, approximately 0.66190. A Bearish Engulfing Order Block of the 4-hour chart was found in that area. If the price penetrates R1 and moves above it, the next resistance, R2, will be around 0.66677. On the other hand, if the price moves downwards, the first area of support, S1, the previous week's low, is around 0.64775. A further decline will force the price to the S2 support, which is approximately 0.64428.
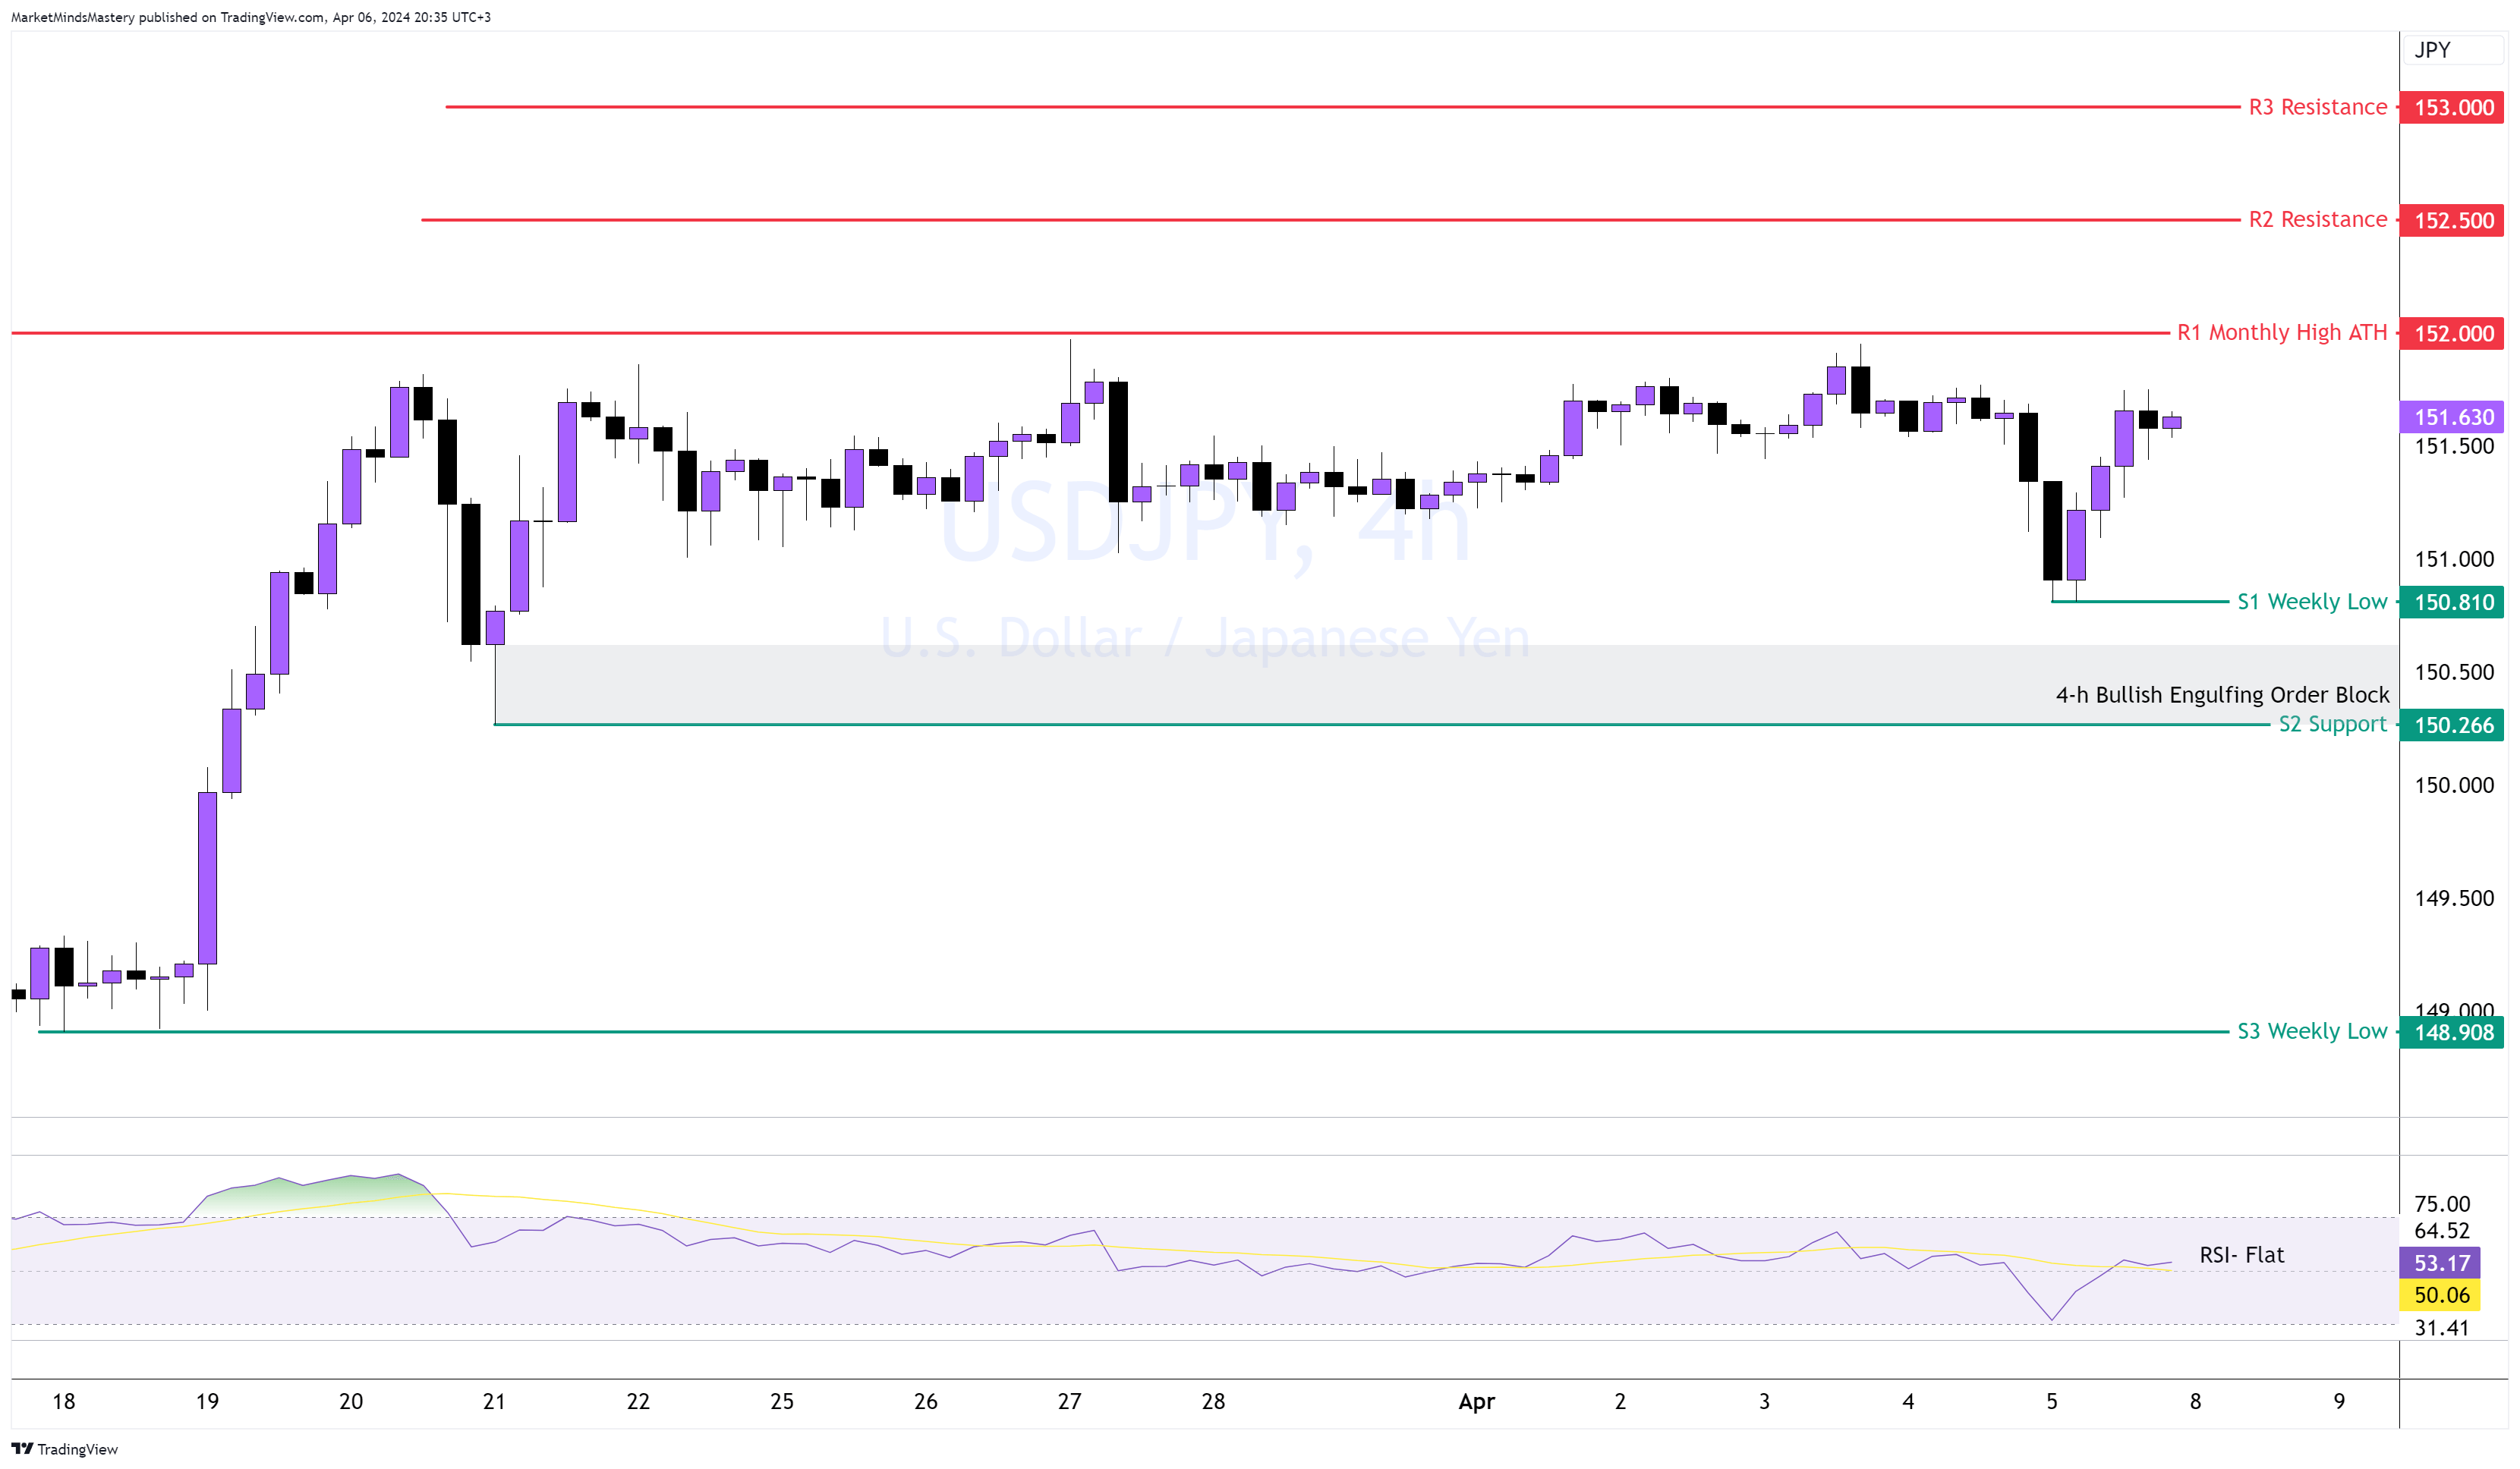
USD JPY 4H
Last week, the market remained under the All-Time High price of around 152. The price tried to break under 151, but the buyers stepped in and pushed the price back into the consolidation area. Considering the flat RSI and the price behaviour, the market needs a breakout to the upside or the downside to create a market structure and show the dominant force.
Last week’s price levels are still valid. Therefore, if the price moves upwards, the R1 All-Time High around 152 is the relevant resistance. A close and move above it finds the next resistance area, R2, around 152.500.
On the other hand, if the price moves downwards, the first support area, S1, is approximately 150.81, which is the previous week’s low. If the price moves under the S1 and declines further, it will enter into a 4-hour Bullish Engulfing Order Block. The beginning of Order BLokc was the lowest, around 150.266, which is the S2 support.
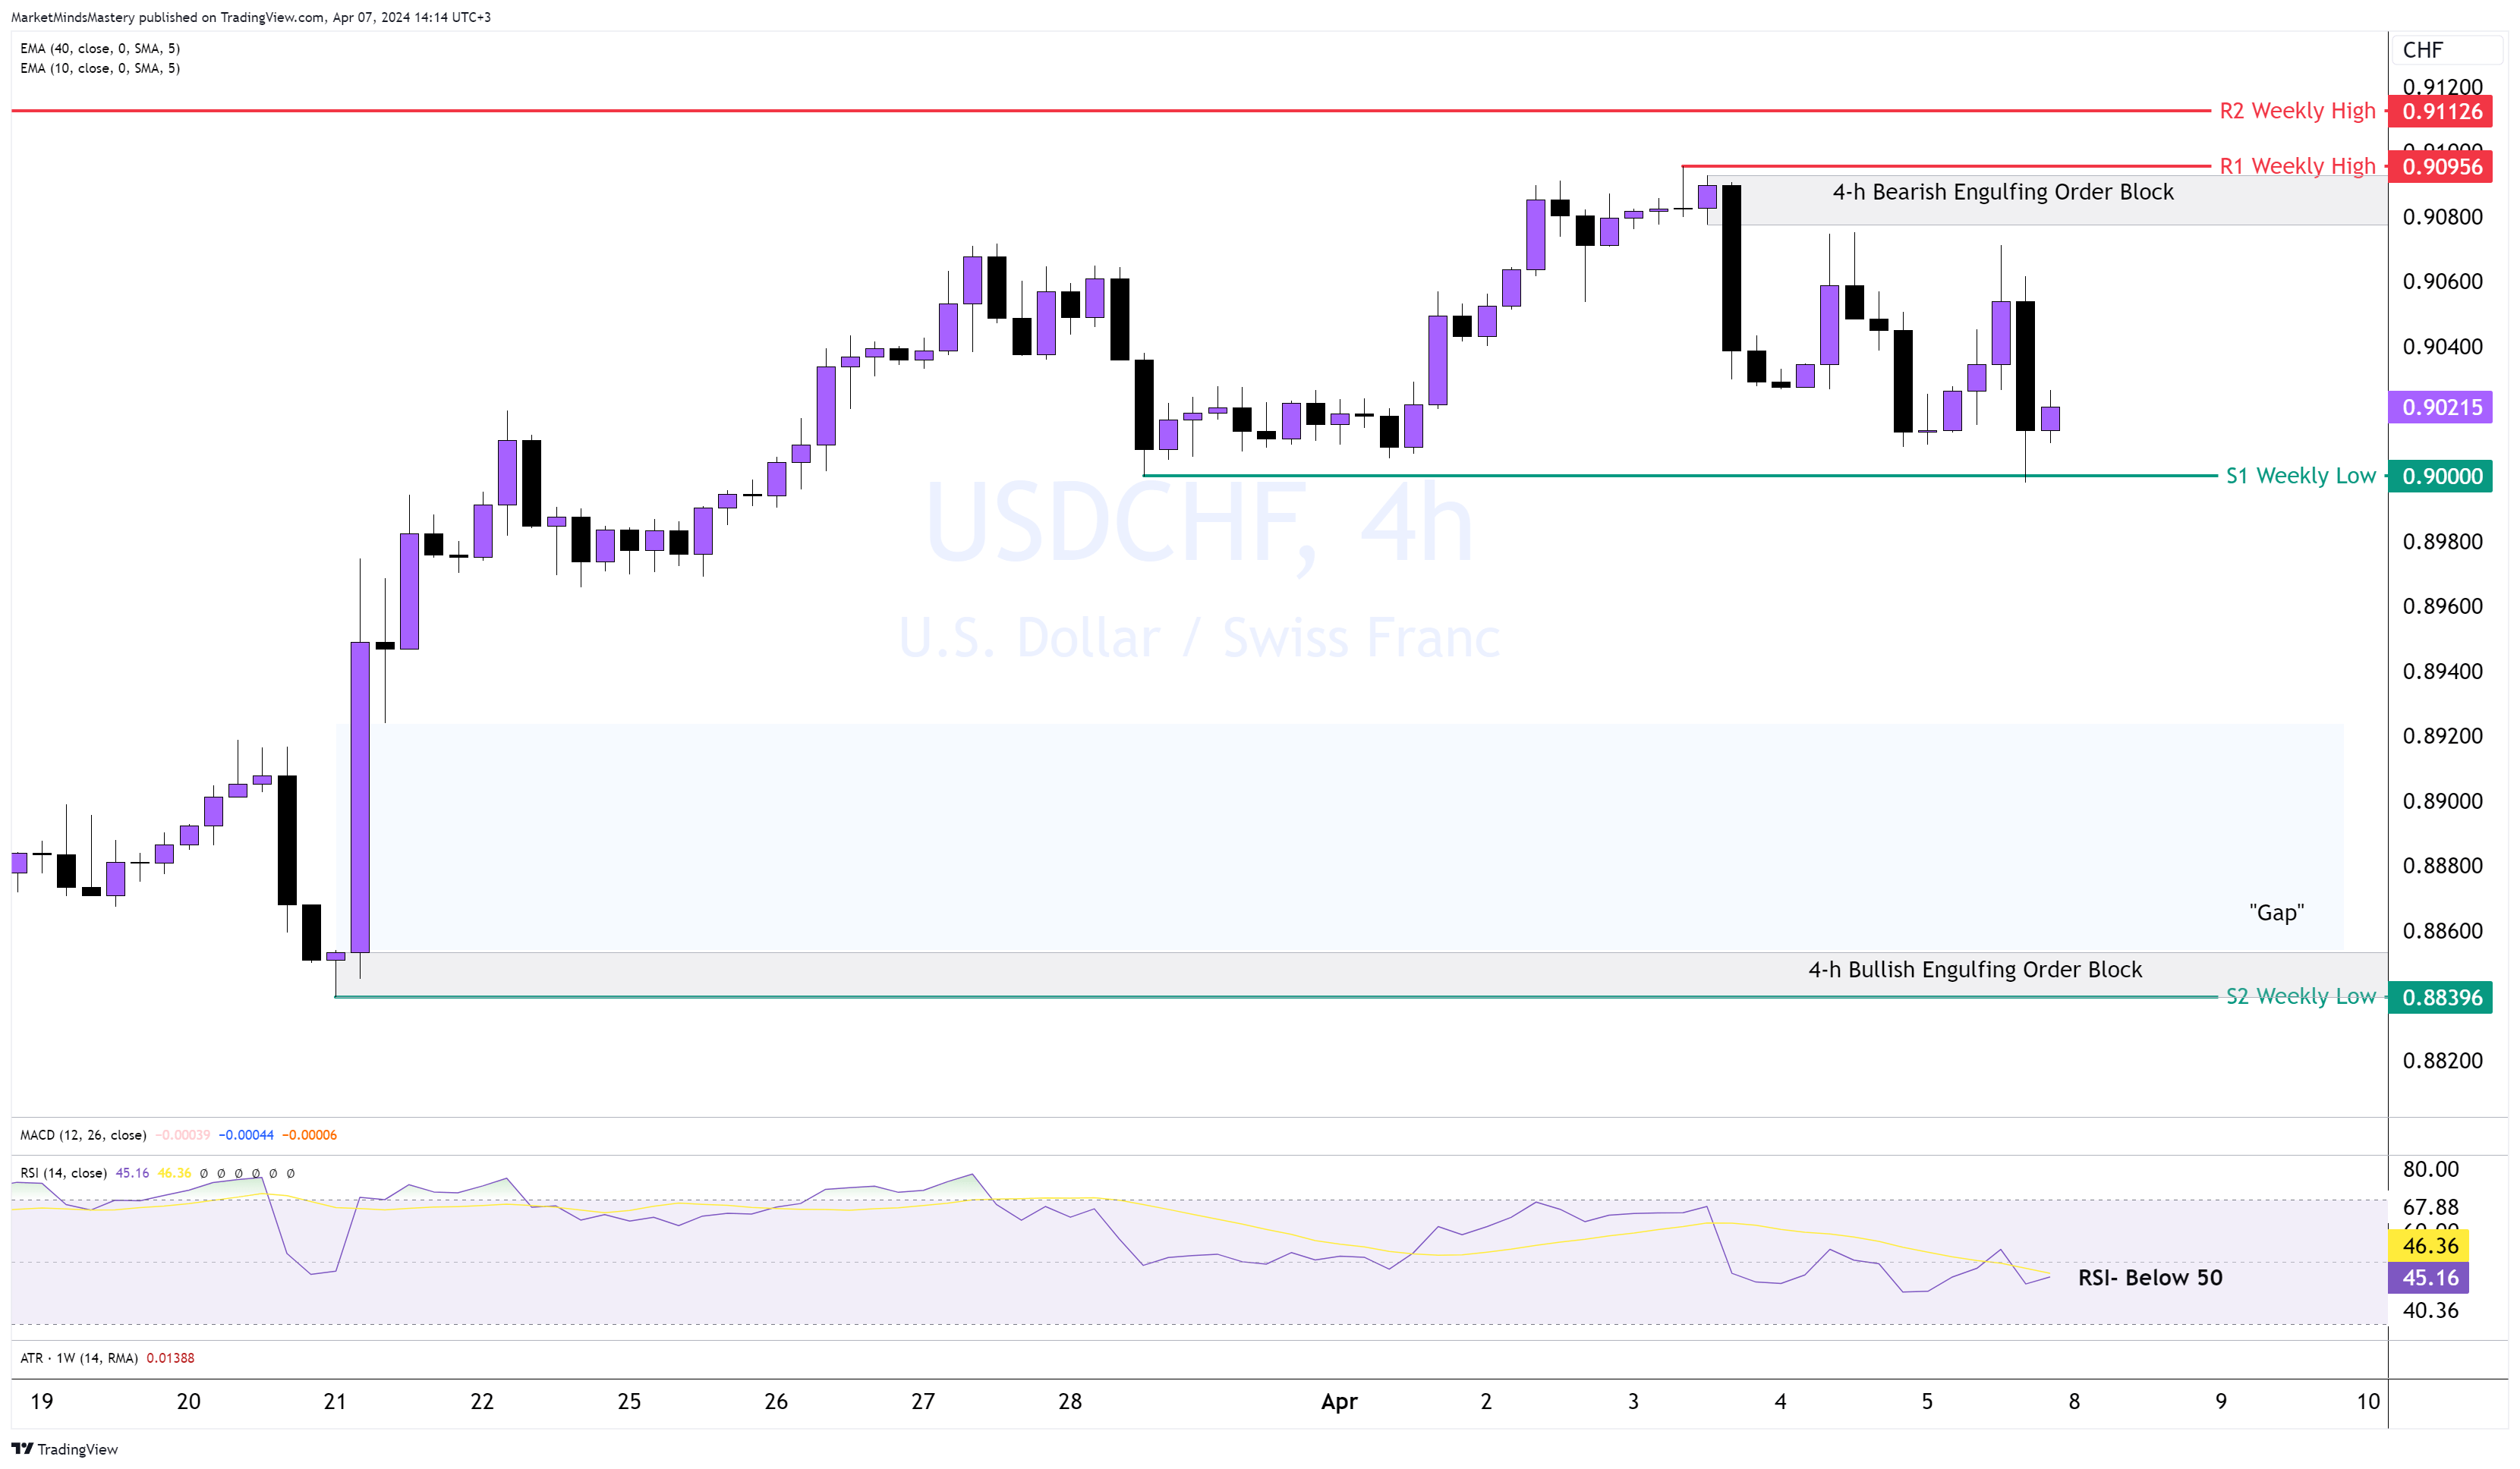
USD CHF 4H
Usually, during the NFP week, the majors move primarily sideways due to anticipating this significant event. The market experienced a consolidation phase preceding the upward move. Therefore, this might be the distribution phase because of the prolonged bearish candles seen on the chart. As the market on the 4-hour chart is trendless, using any trend indicators is useless. The RSI oscillator is under 50, indicating bearishness.
Starting Monday, if the price moves downwards, the previous week’s low will be the first support, S1, approximately 0.9000. If the price surpasses the S1, closes under it and declines, the next significant support, S2, is an old weekly low of around 0.88396. The significance of this level is the “Gap” created previously, and the
Bullish Engulfing Order Block appeared there. If the price bounces off a support level and moves upwards, the first resistance area, R1, is around 0.90956, and the next resistance level, R2, is around 0.91126.
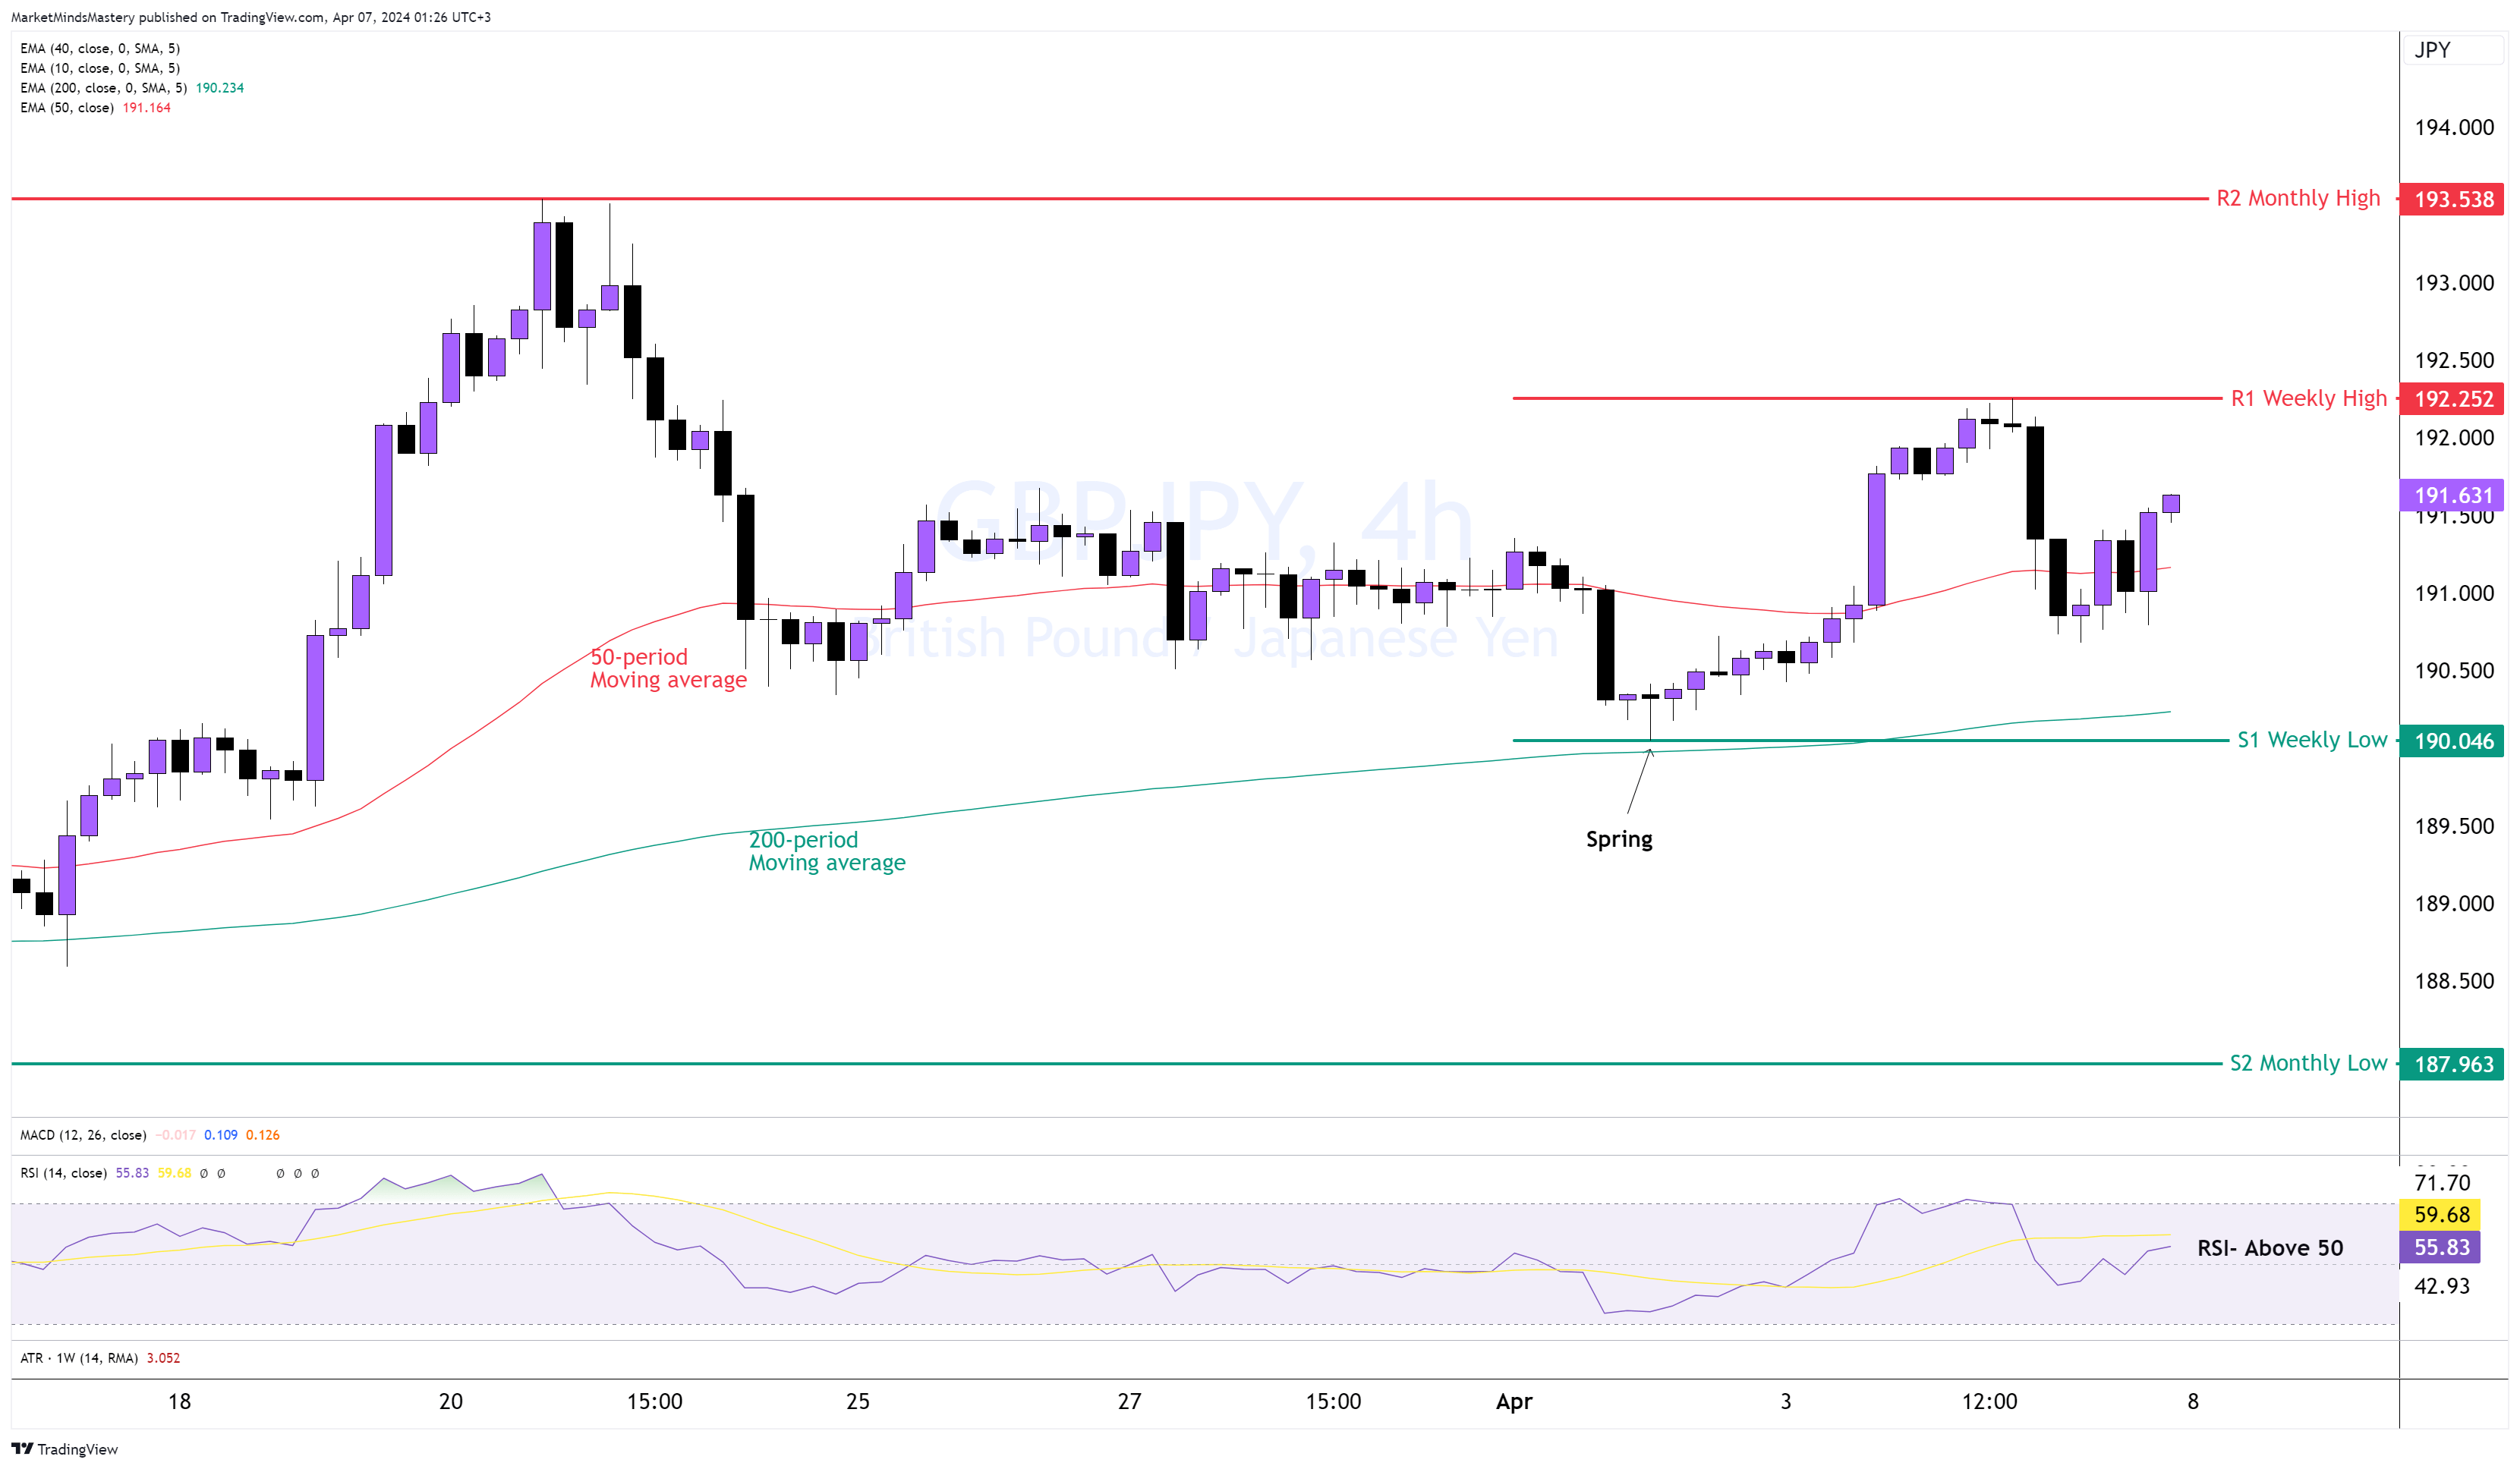
GBP JPY 4H
The price traded within the levels we pointed out in the previous week’s analysis with a classic Wyckoff accumulation phase started with the spring candle. Since then, the price has increased, and it tested the Bearish Engulfing Order Block at around 192.25, as we pointed out last week. The RSI is above 50, indicating bullishness. The 50-period is above the 200-period moving average, which is also bullish. Price trades above the 50-period indicate buying pressure in the market. Therefore, if the price keeps increasing, the first resistance area, R1, is approximately 192.25, a weekly high. If the price penetrates the R1 and closes above it, it can continue upward until the R2 resistance, a monthly high of around 193.538. Oppositely, if the price moves downwards, the first support area, S1, is the previous week’s low, around 190.046. If the price penetrates the S1, closes below it and keeps moving downwards, the next support area, S2, is a monthly low of approximately 187.96.
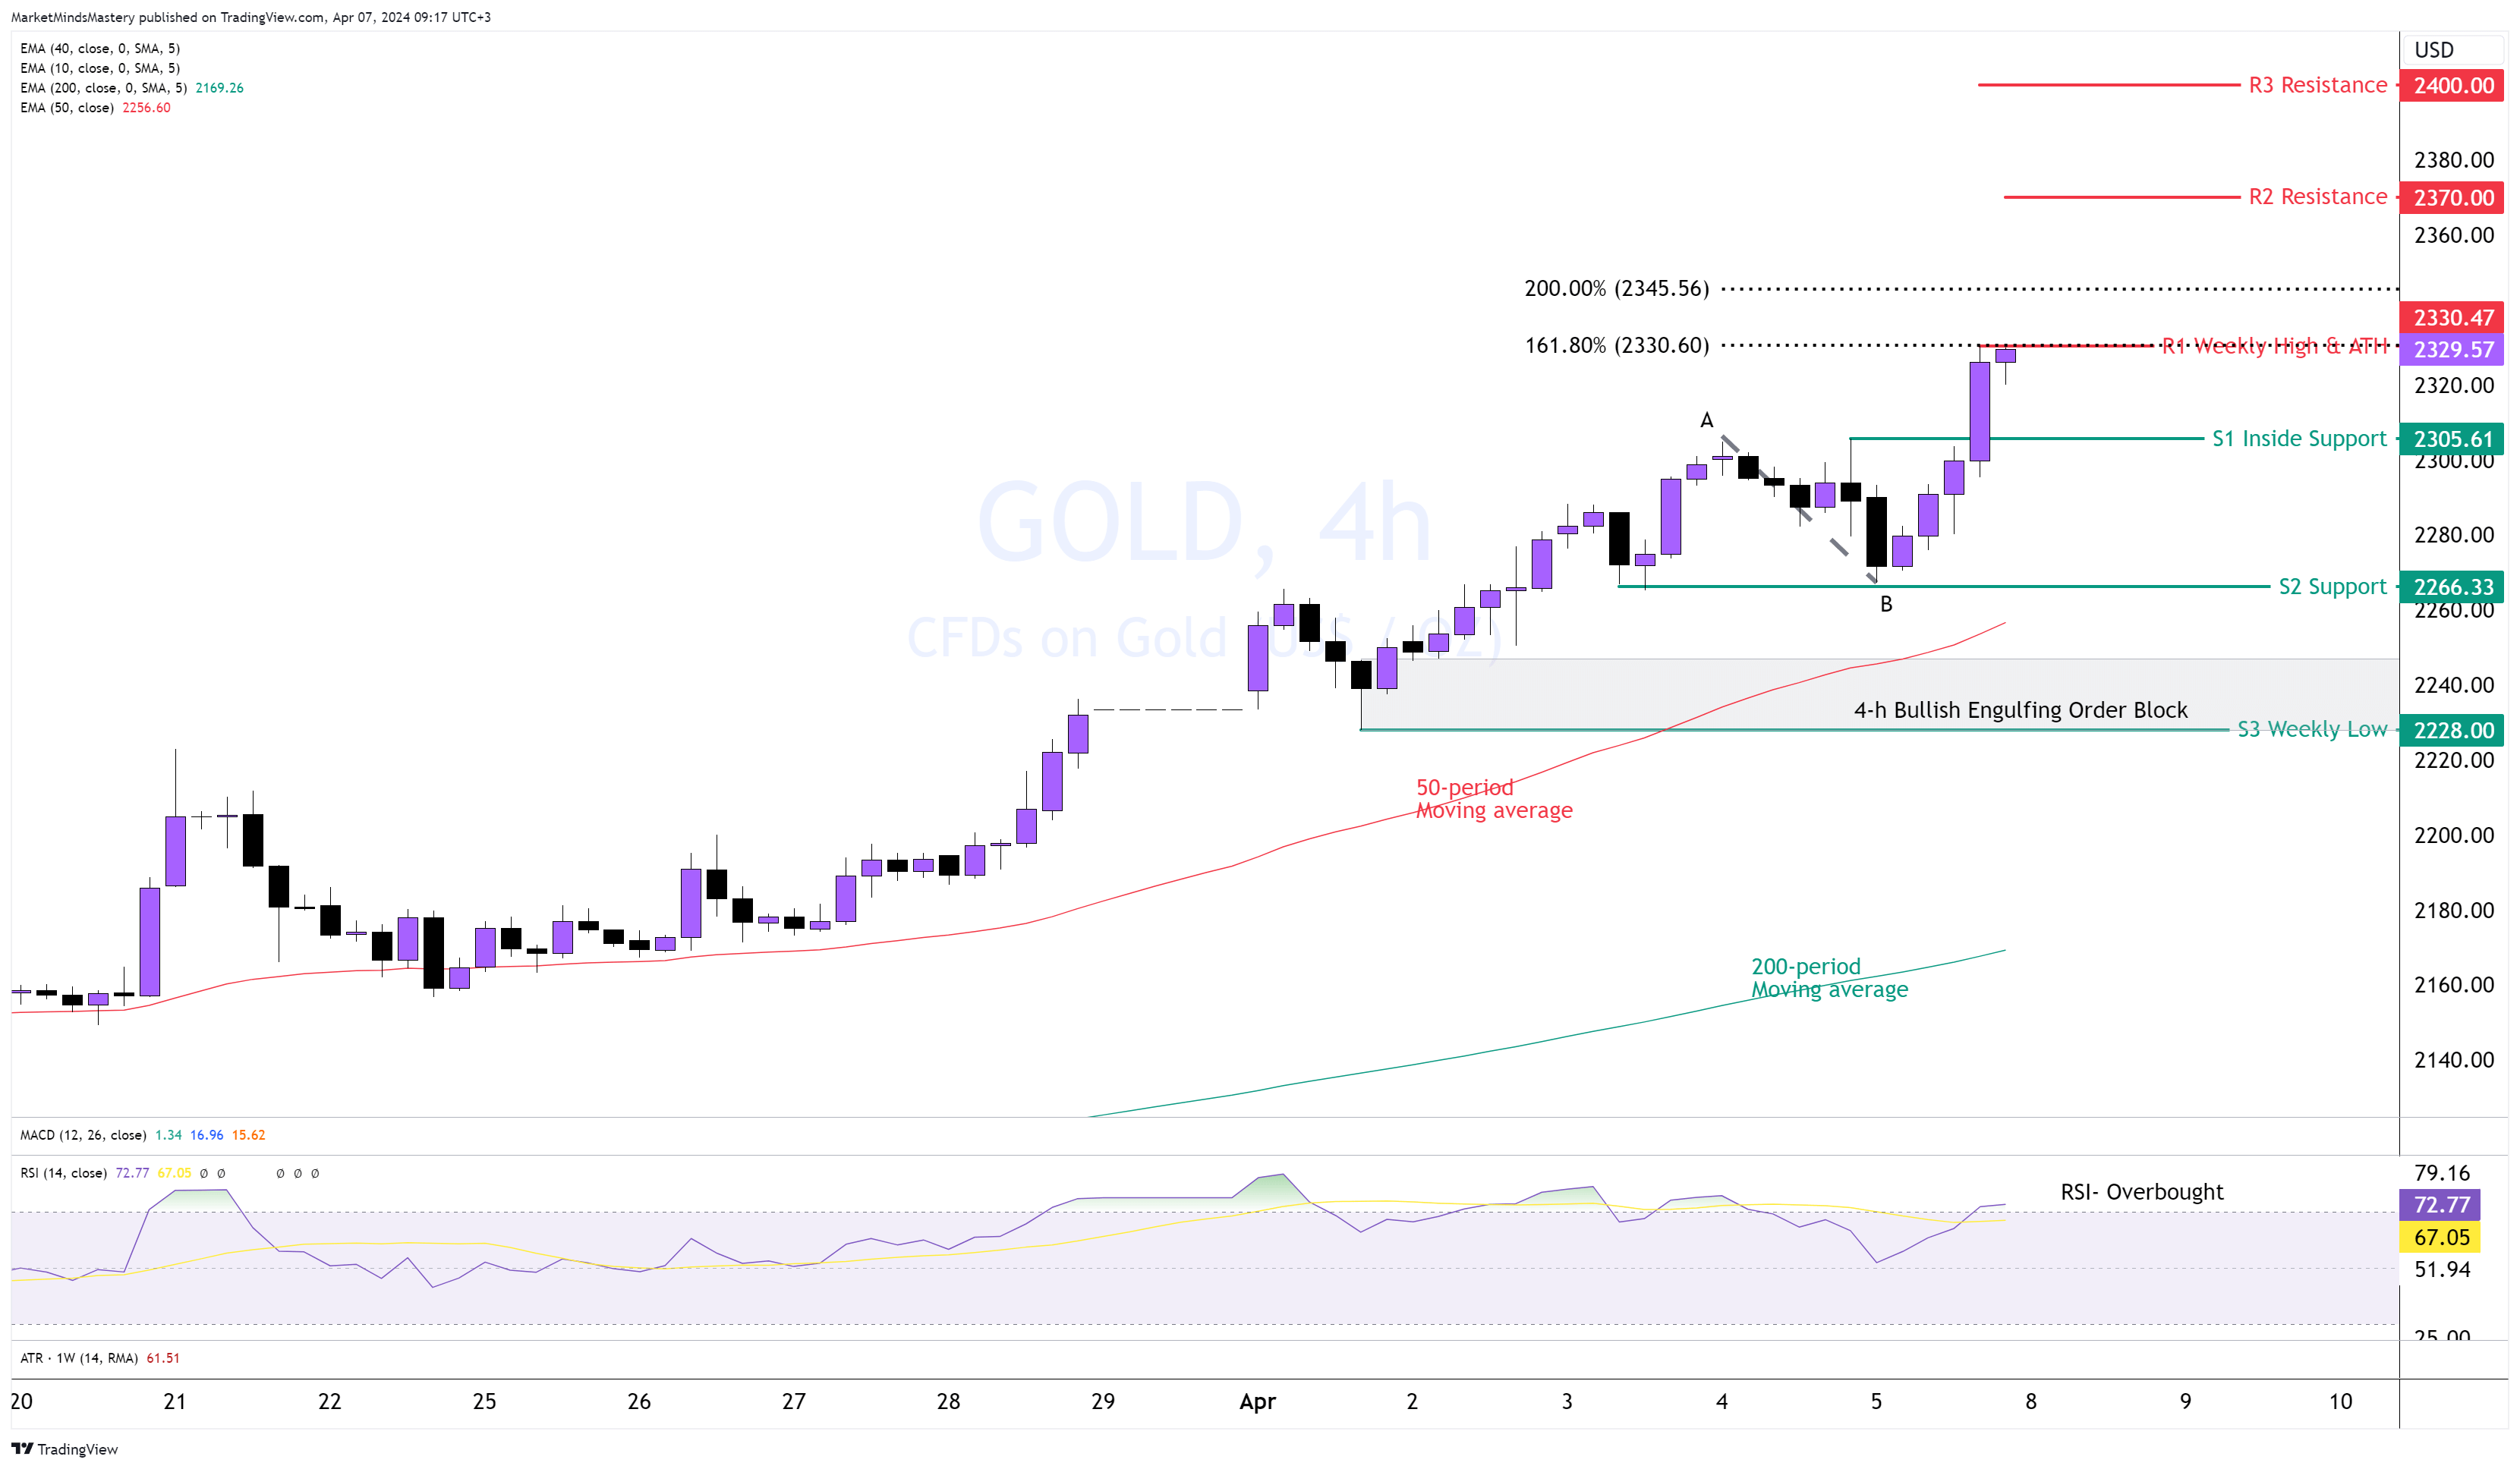
GOLD, 4H
Last Friday, the NFP exceeded the forecast’s expectations. However, the USD didn’t follow through until the end of New York’s trading session. Therefore, the price of Gold registered a new all-time high, around $2330. The price created higher highs and higher lows, indicating bullishness. The 50-period is above the 200-period moving average, indicating a buyer's market, and the RSI is overbought, reinforcing the bullishness in the Gold market.
Using the Fibonacci extension from the high at point A to the low at point B to estimate the minimum price’s travel distance, R1, 161.8% has been reached but not the 200%.
If the price increases, the next resistance R2 is around $2370. A further upward move will lead to the $2400.
On the contrary, if the price moves downwards, the first support area, S1, is an inside support of around $2305. A further downward move leads to the origin of the current impulse leg, around $2266. If the price declines further, we will find the previous week’s low, $2228, as the S3 support.
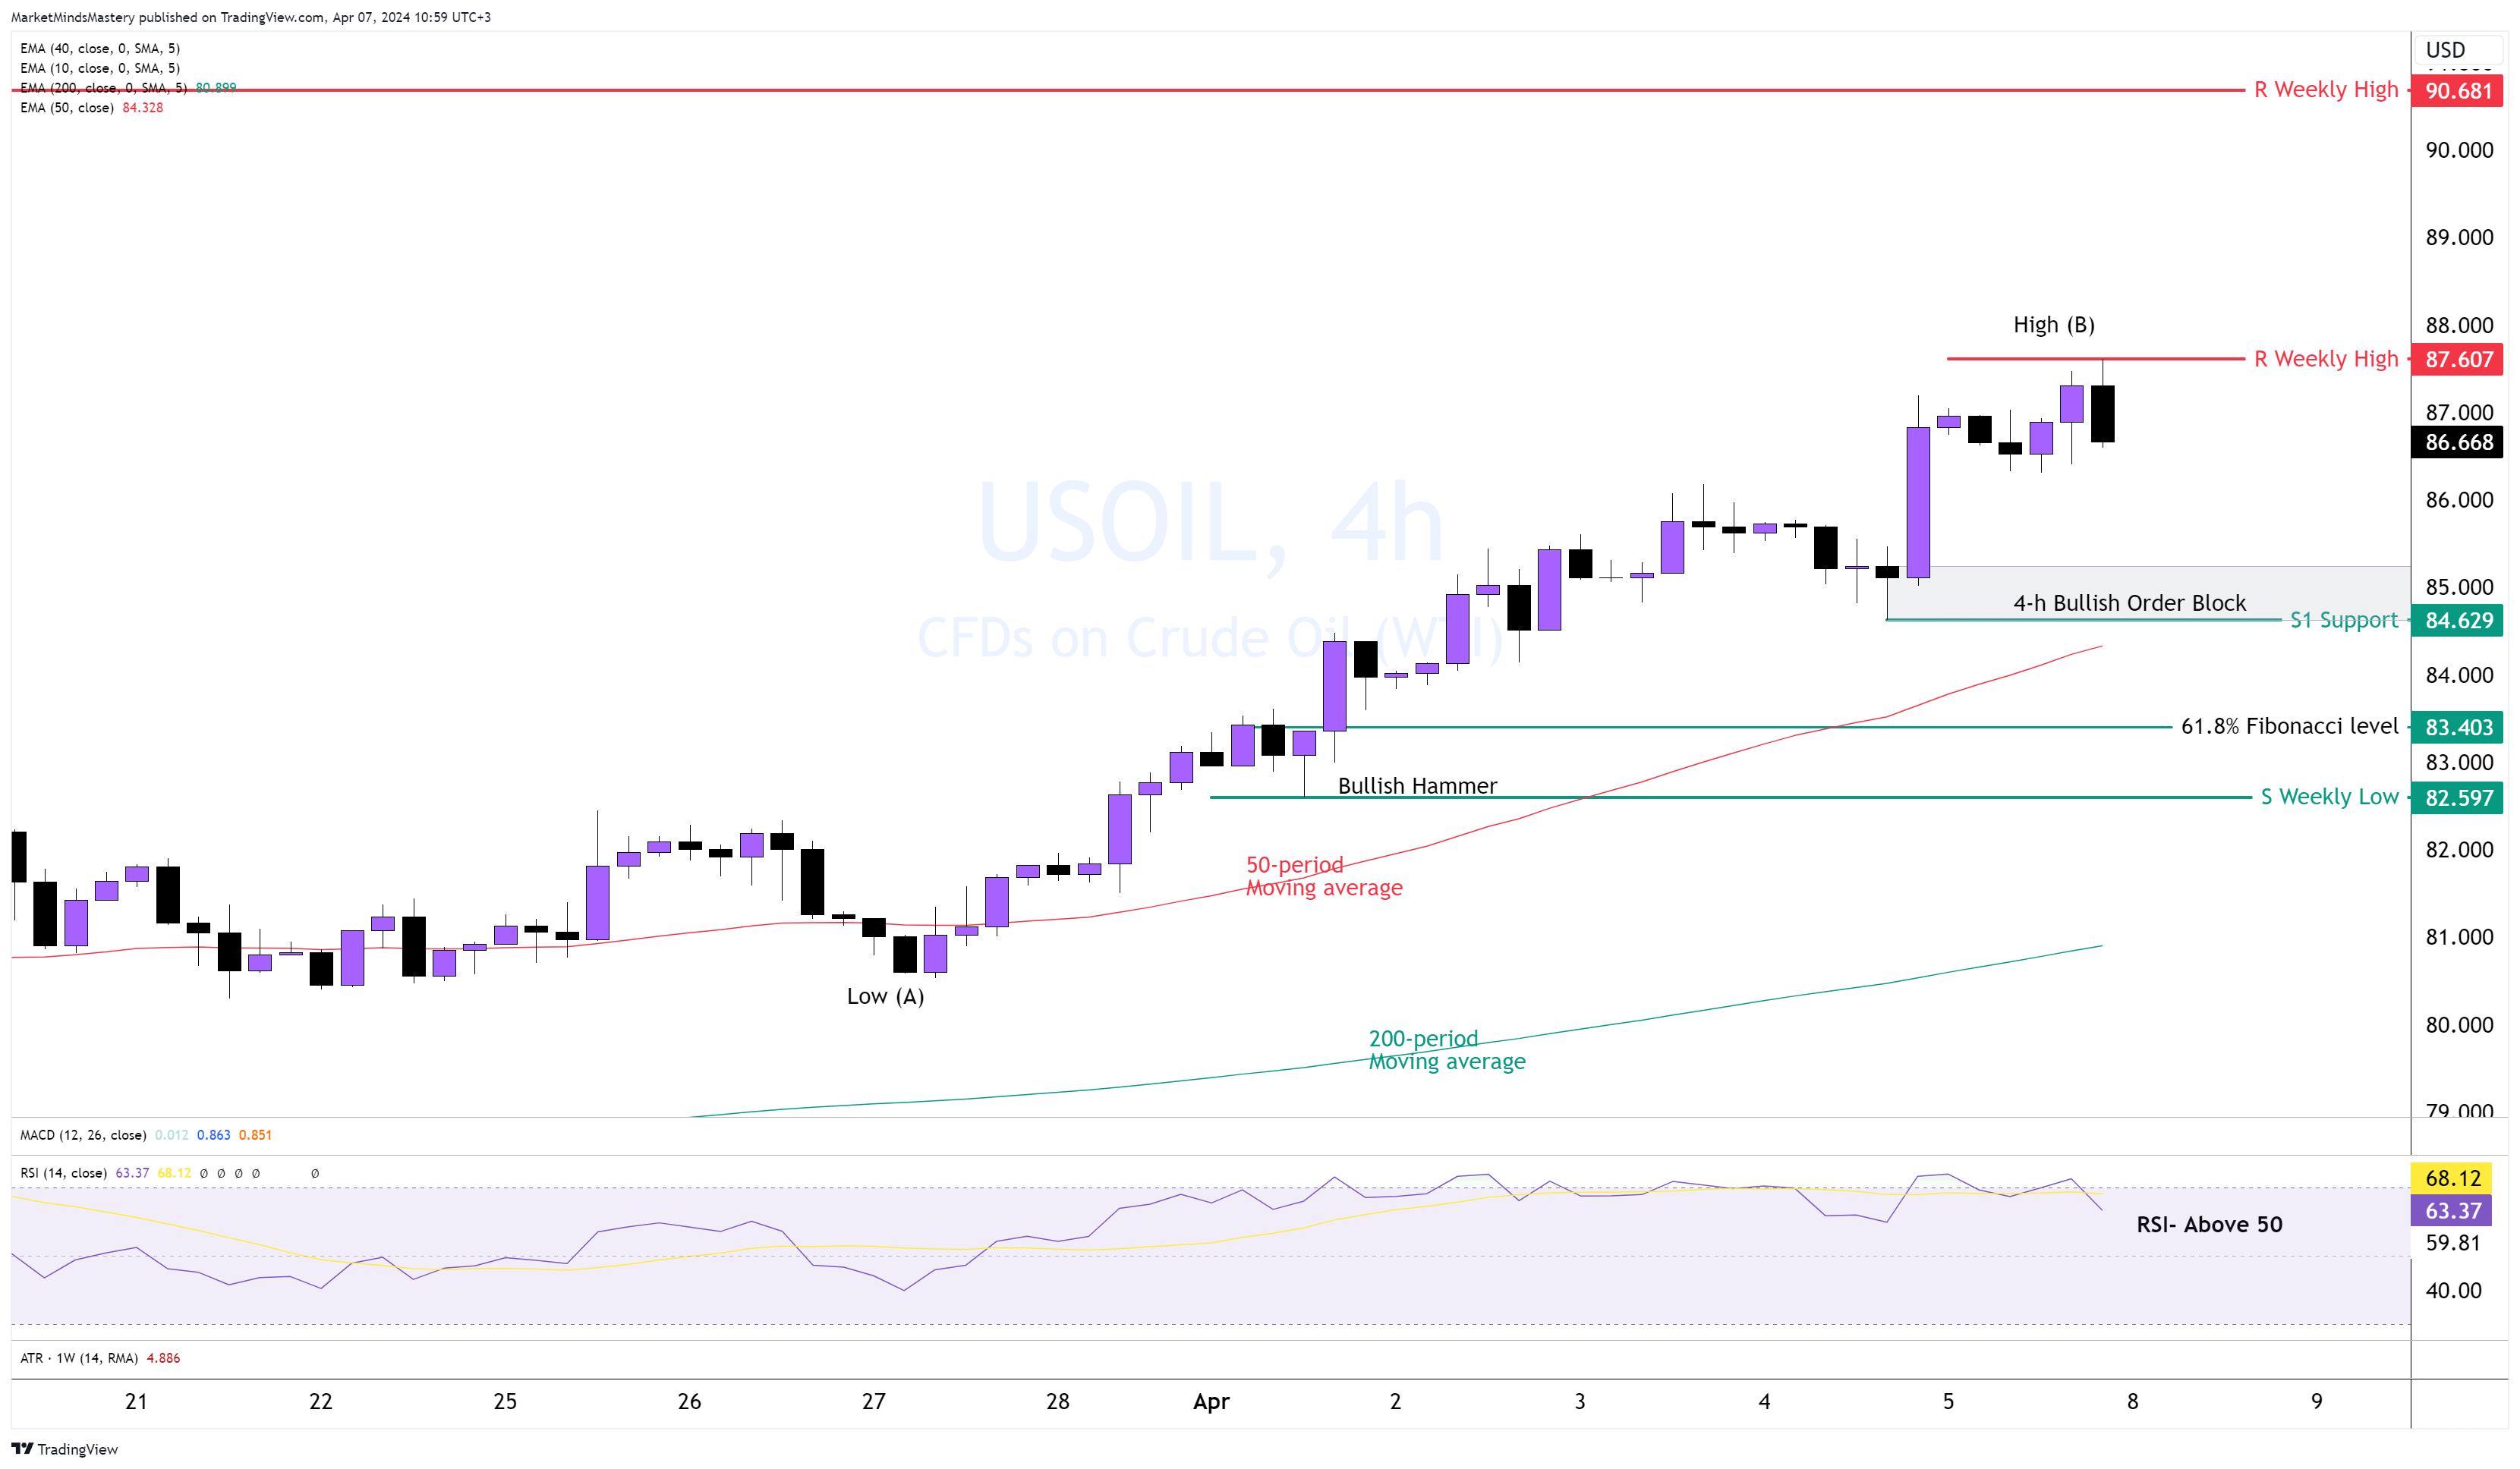
US OIL, 4H
A rise in the US OIL price during last week’s trading activity created a series of higher highs and higher lows, establishing an uptrend. As the chart shows, the price corrections are shallow, indicating a bullish strength. The 50-period moving average is well above the 200-period, revealing a solid uptrend. The RSI is above 50 and close to the overbought area, showing the buyer's strength. If the price enters a corrective phase and moves downwards, the first support is the S1, around $84.62, with a Bullish Order Block sitting there.
Measuring the retracement from the swing low (A) to the swing high (B), the 61.8% Fibonacci level lays in the $83.40 area, only a few pips above the Bullish Hammer. The low of the bullish hammer is the previous week’s low, and it is considered the S2 support. Last week’s high is regarded as the R1 resistance at around $87.60 if the price keeps rising. If the price breaks above R1 and moves higher, the next resistance area, R2, will be approximately $90.68.
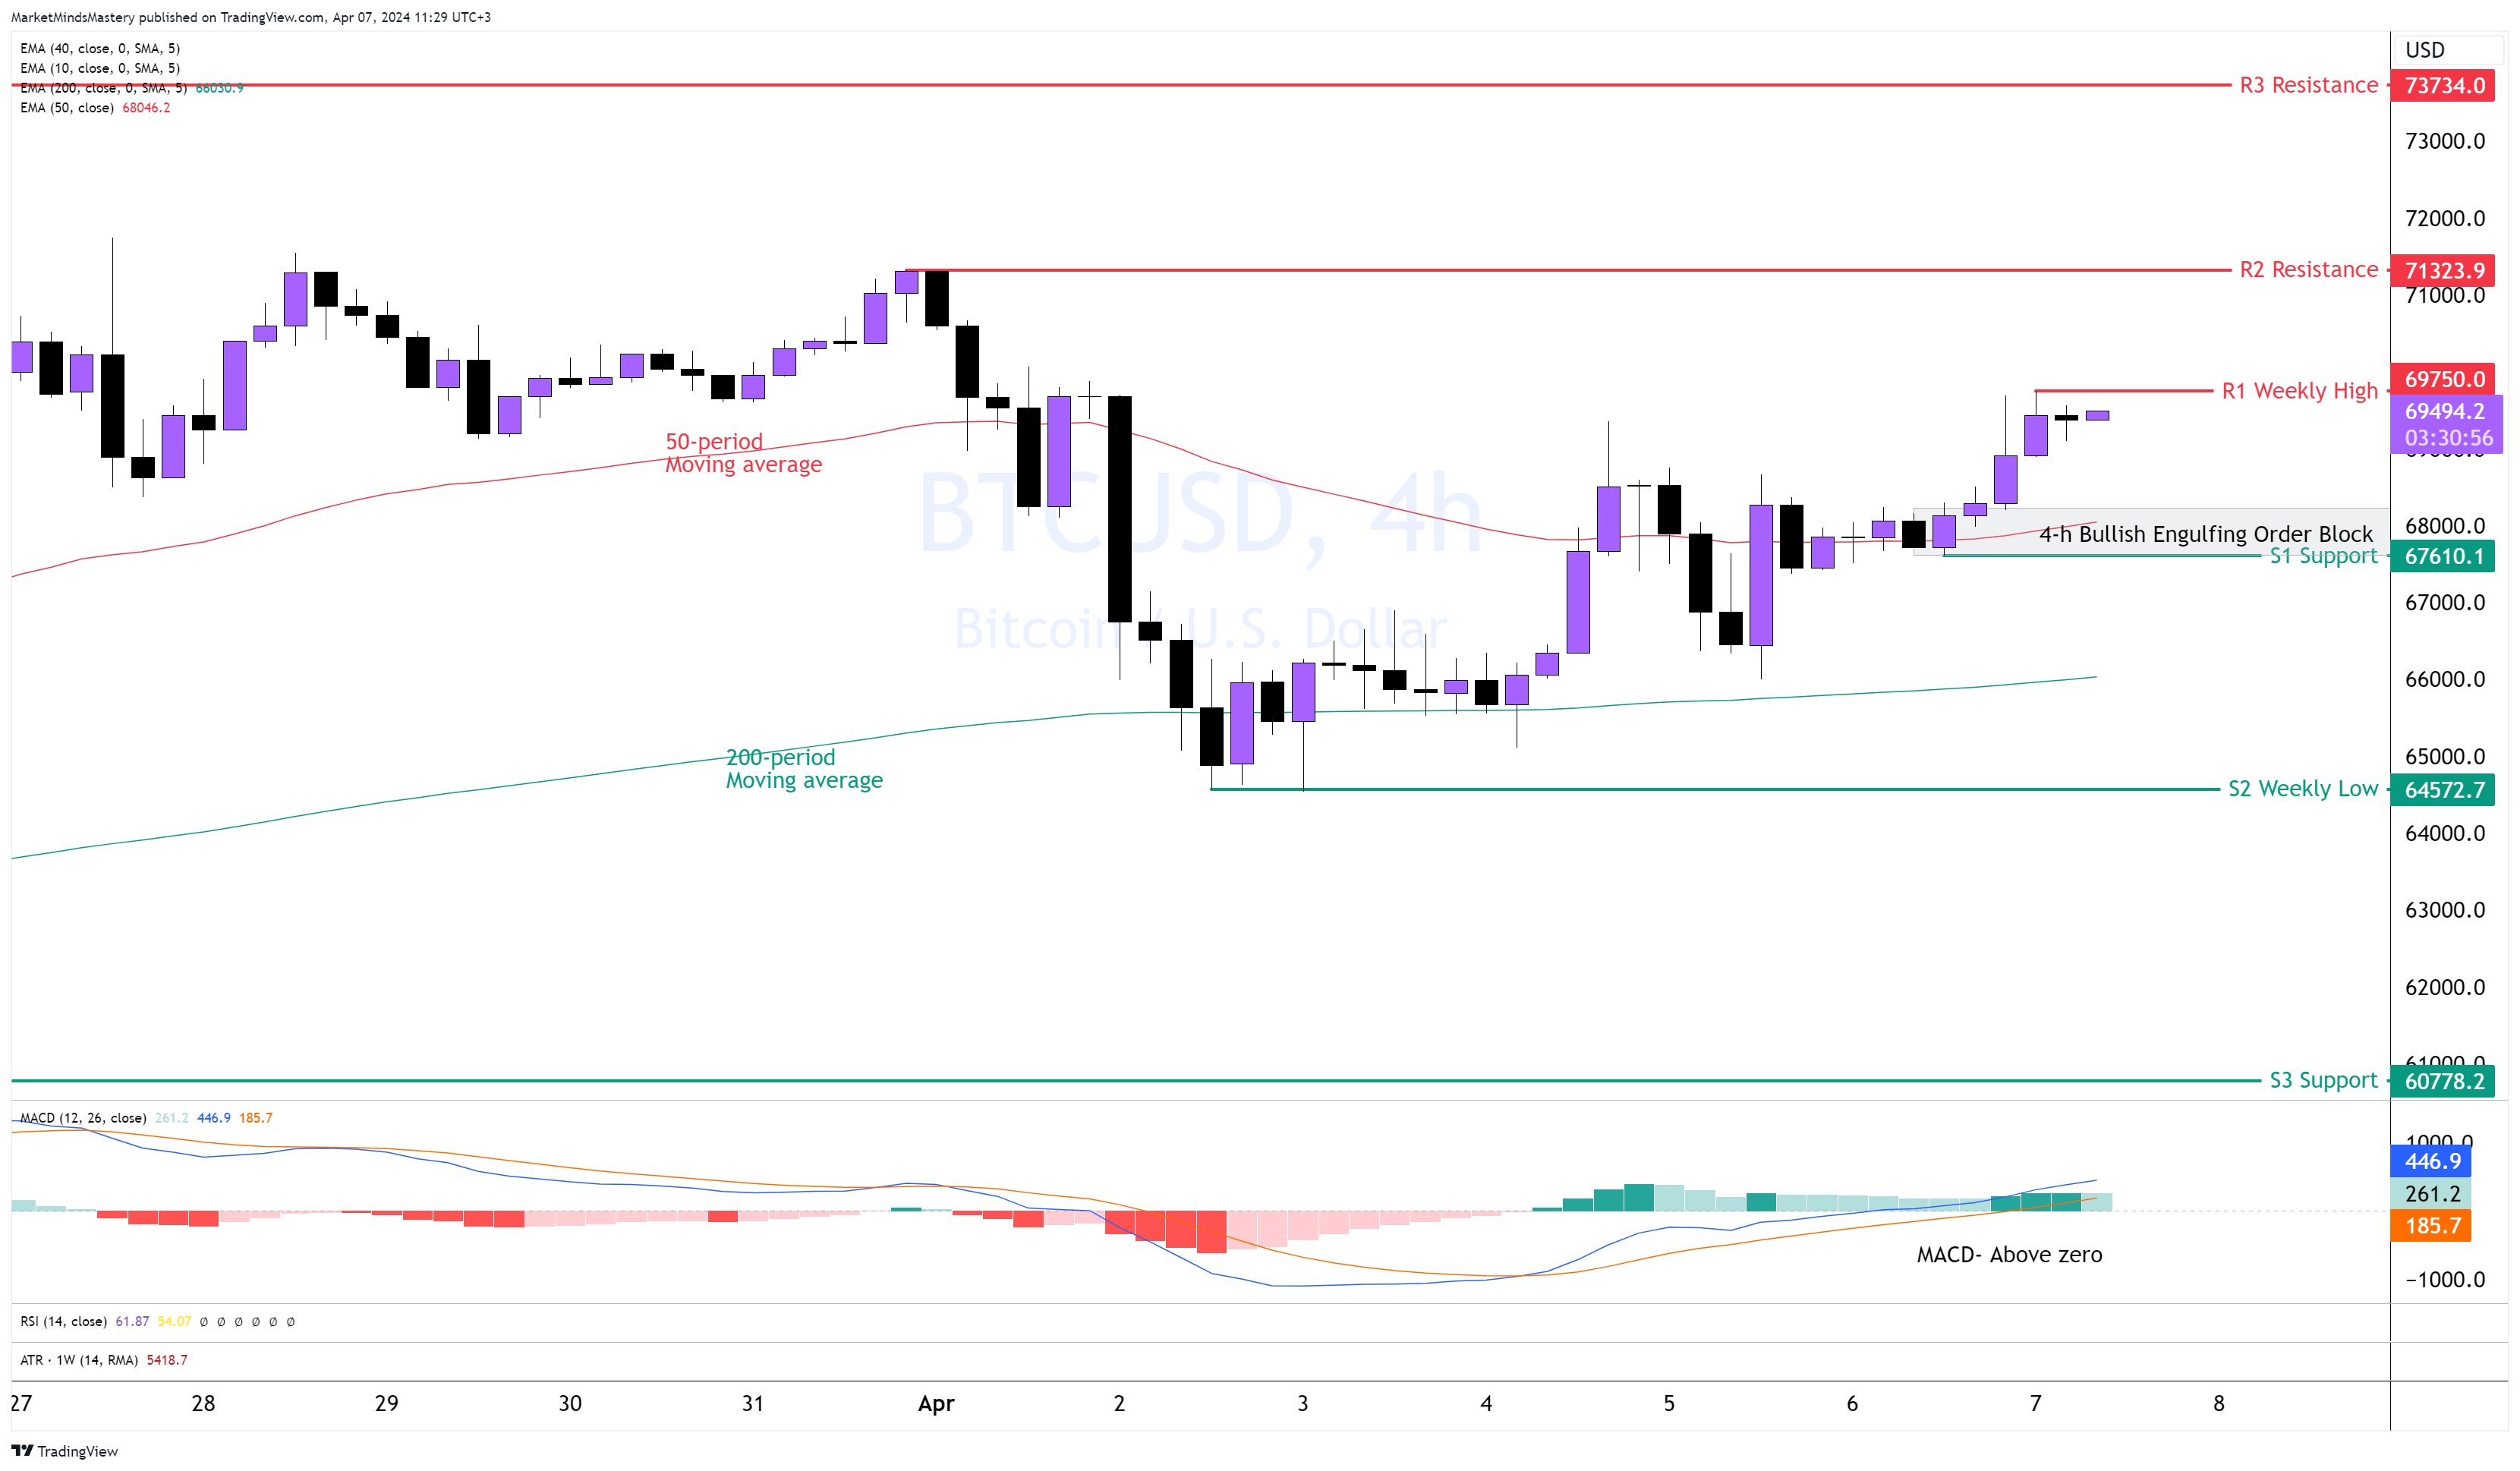
BTC USD, 4H
Following last week’s move, the price successfully bounced off the 61.8% Fibonacci and the 200-period moving average. Since then, the price has increased, forming a higher high and a higher low, creating an uptrend. Around $68000, the price formed a Bullish Order Block. The 50-period moving average is above the 200-period moving average, which is bullish. The MACD crossed above the zero line, indicating bullishness.
Therefore, if the price increases, the first resistance R1 is around $69750. If the price surpasses the R1 and rally, the next resistance area, R2, is approximately $71323. A break above the R2 can lead to the price of R3 resistance being around $73734. If the price declines and moves downwards, the S1 around $67610 is considered the first support. If the price drops below the S1 and moves downwards, the next support, S2, is around $64572.
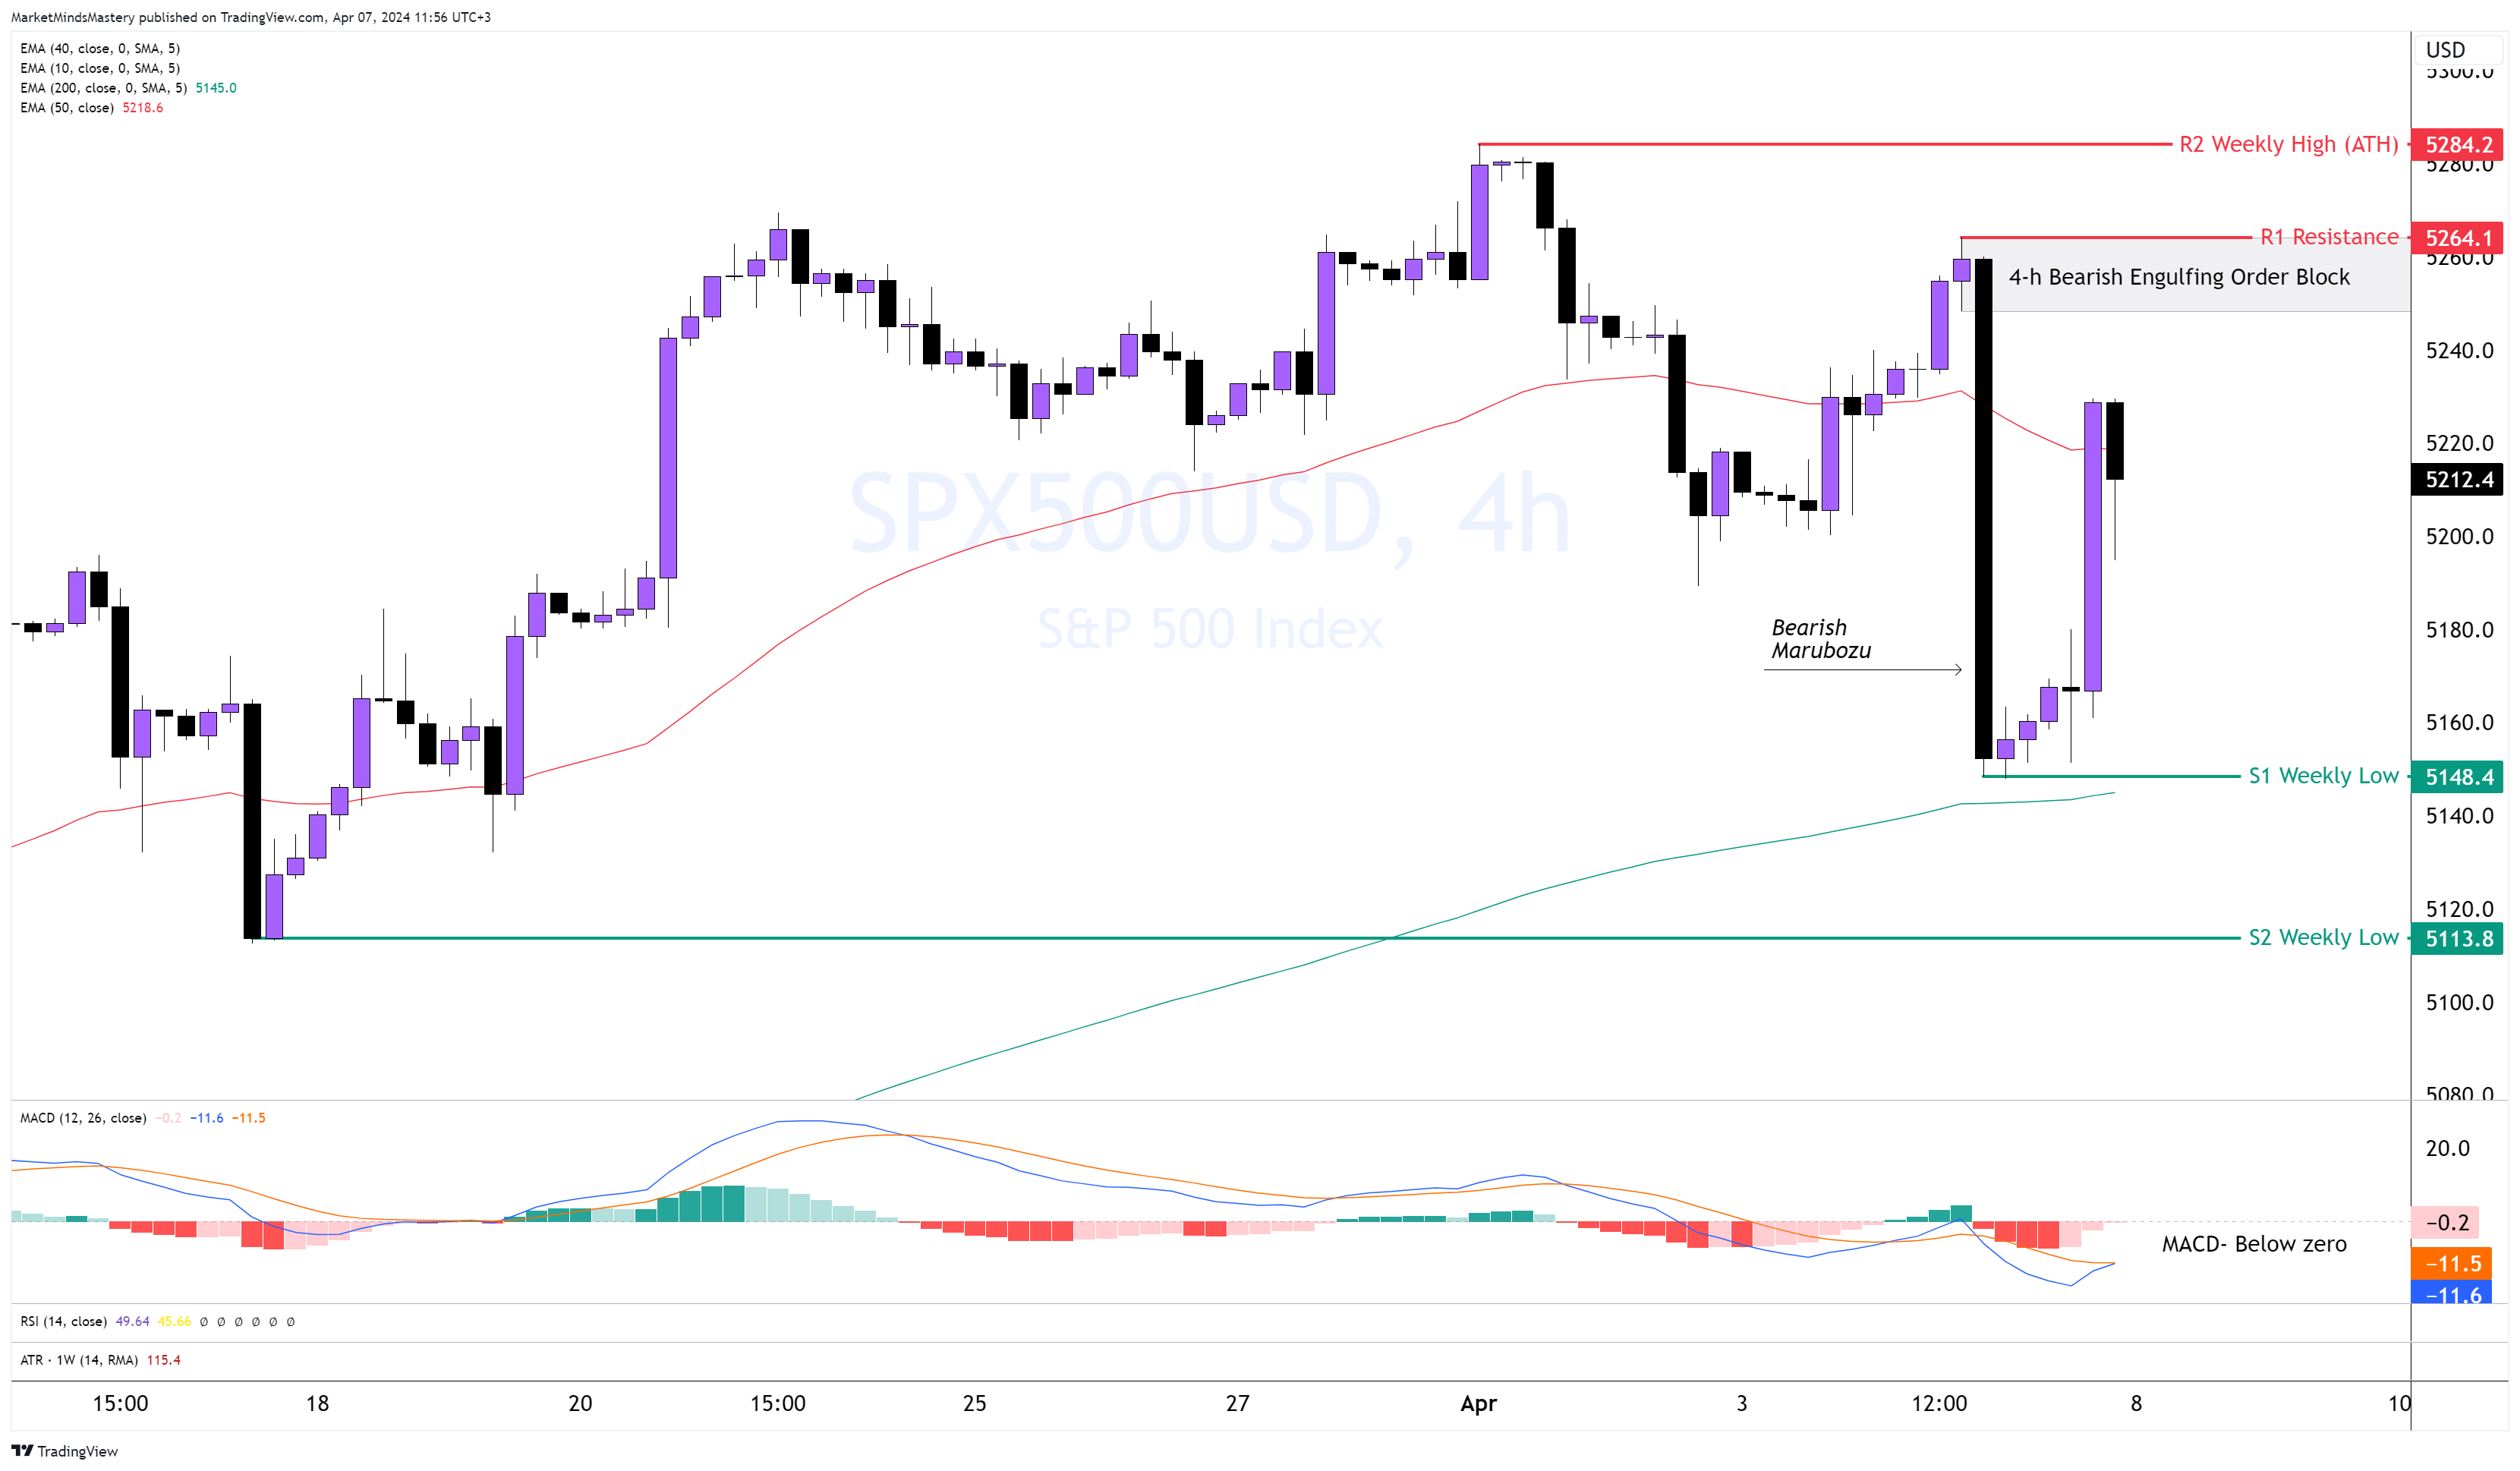
SP 500, 4H
The weekly price action (shown on the weekly chart) is a Bearish Engulfing, showing that the sellers took control of the market over the last week. The price has created a series of lower highs and lower lows on the 4-hour chart, indicating a bearish market. The 50-period is above the 200-period moving average, confronting the selling sentiment as the moving averages are lagging indicators, and we primarily pay attention to the price swings. The MACD is under the zero line, indicating bearishness. Starting Monday, if the price moves upward, the first resistance area, R1, is approximately $5264. As a Bearish Marubozu candle was created over the last week, and at the same time is a Bearish Engulfing candle, a 4-hour Order Block formed around that level can cause price rejection. However, if the price penetrates the R1 and closes above it, the next resistance area, R2, is the All-Time High, around $5284.
If the price declines and moves lower, the first support, S1, is a weekly low of around $5148 and the subsequent support, S2, is approximately $5113.
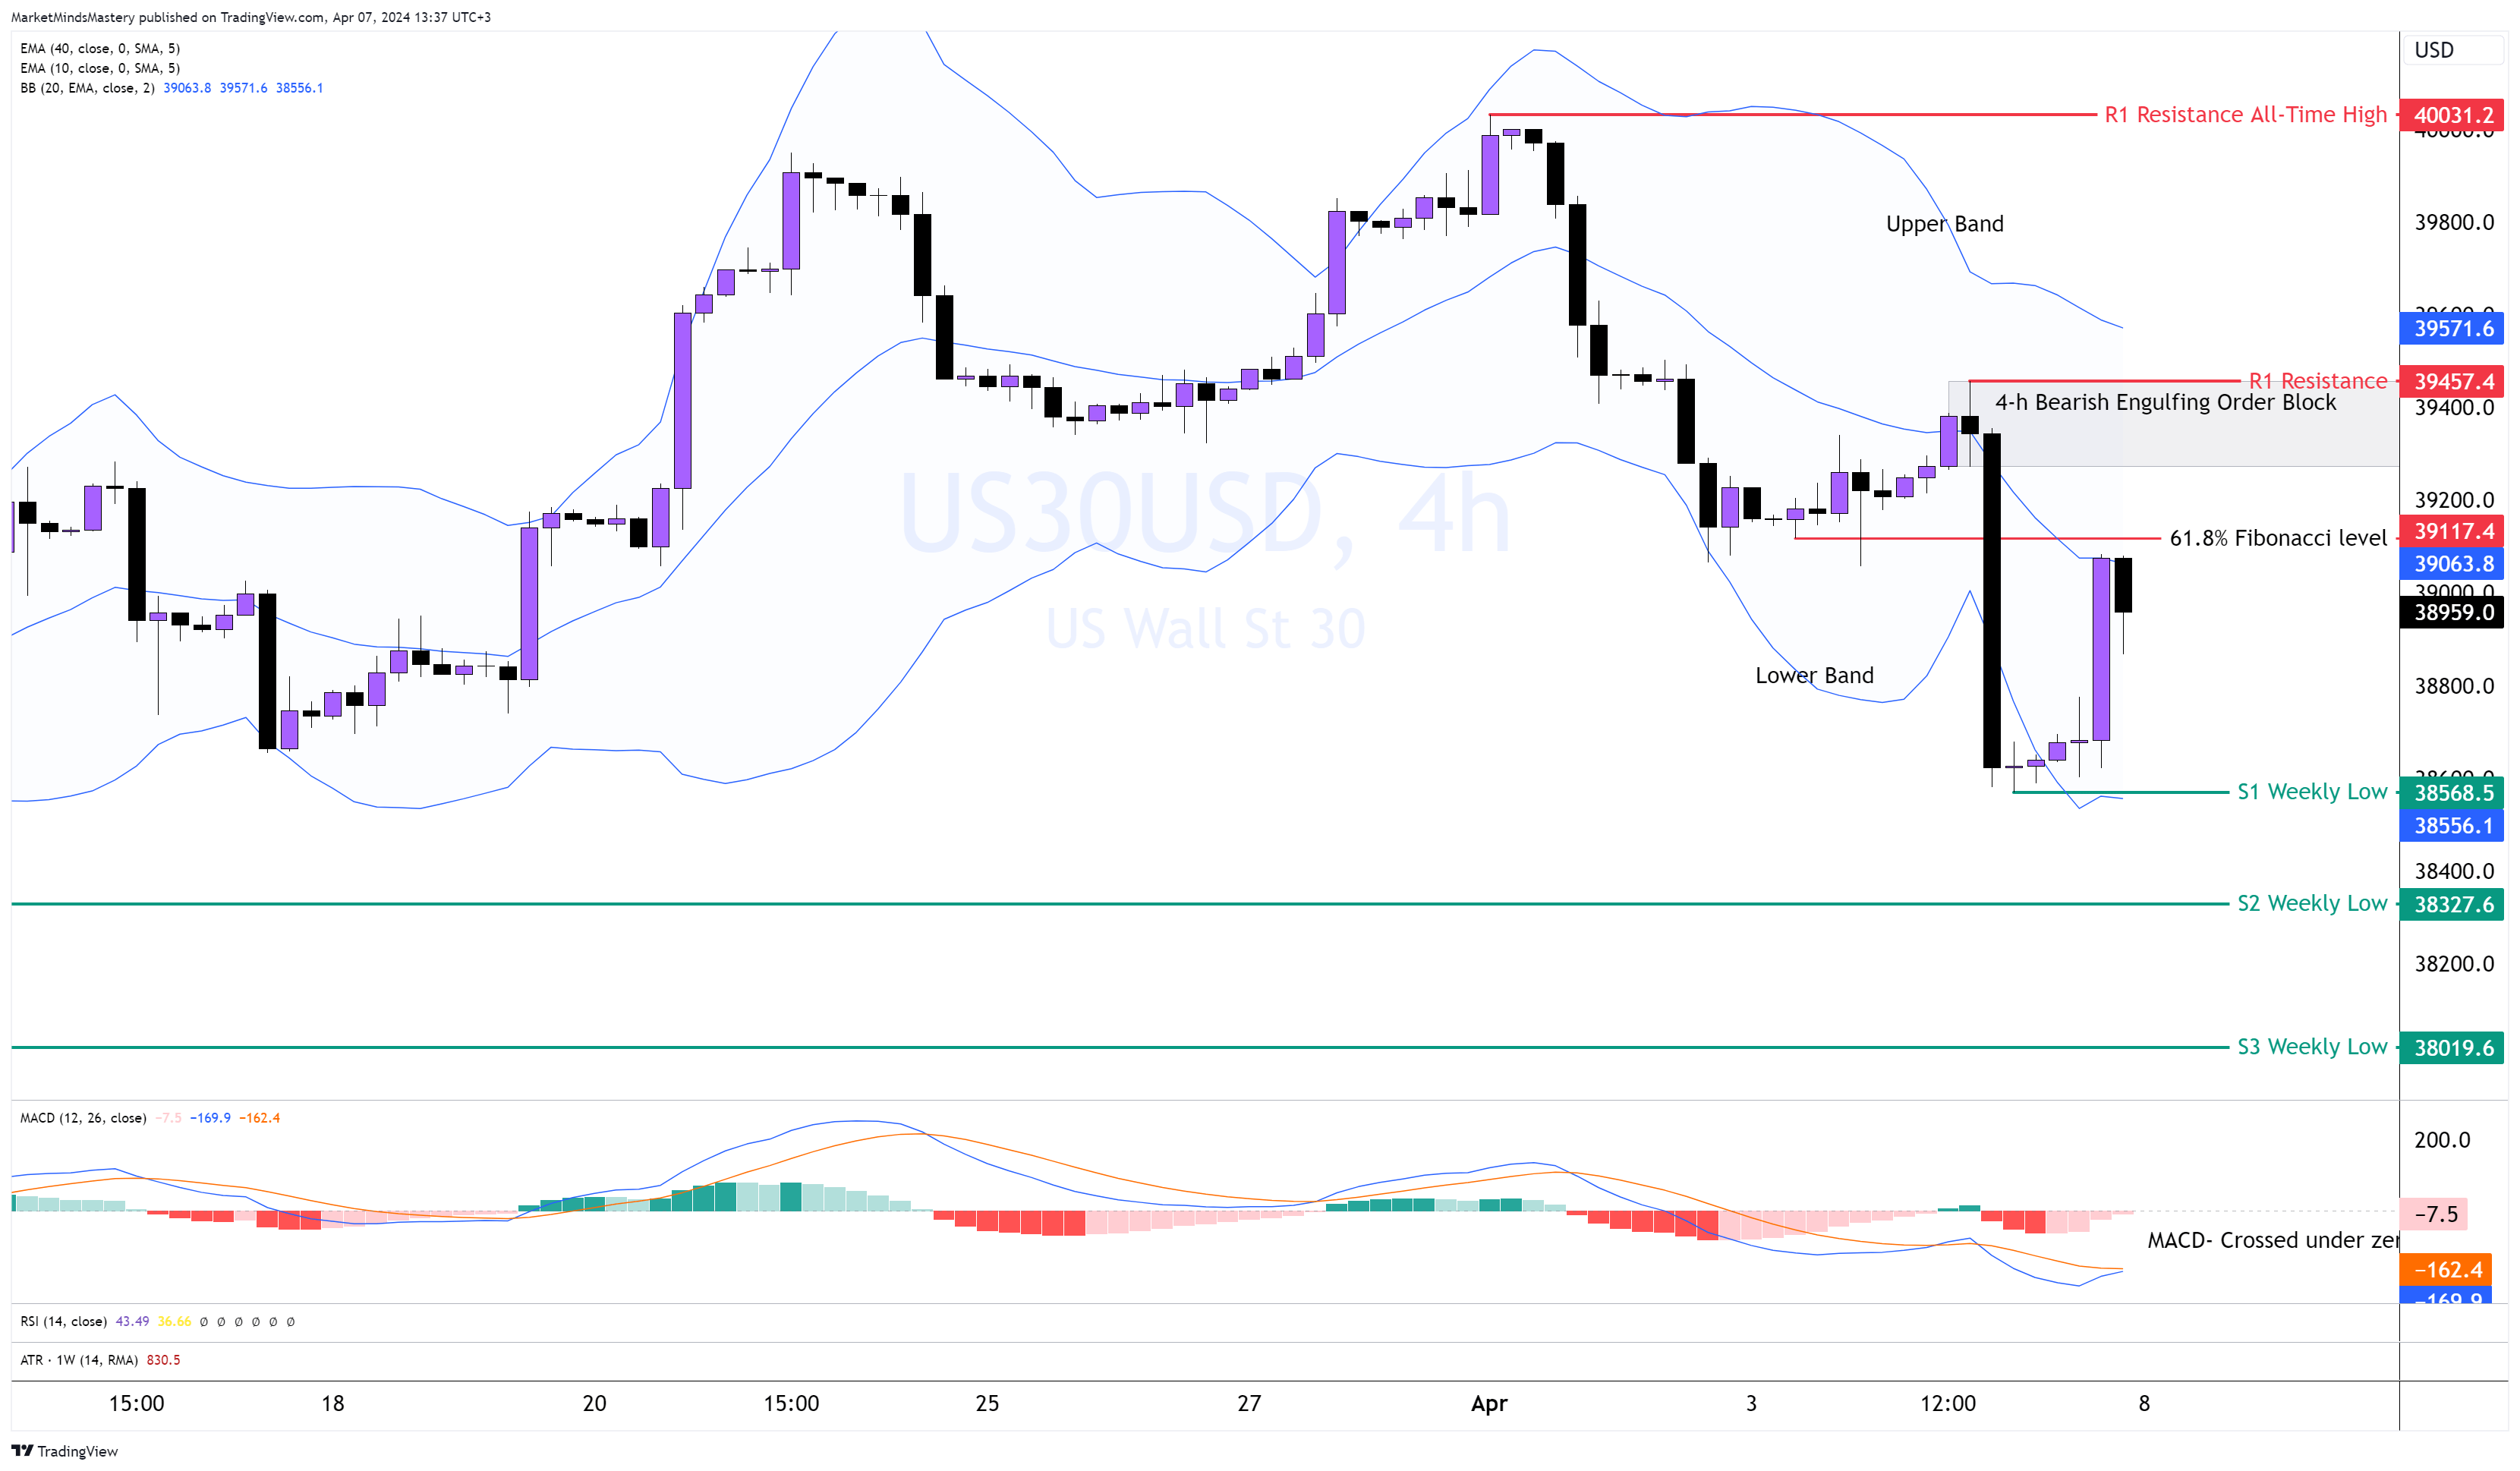
US 30, 4H
The US 30 on the weekly chart formed a Bearish engulfing candle. At the 4-hour chart, the price created a series of lower highs and lower lows. The price rejected the 20-period moving average, the middle of the Bollinger Band. Additionally, the MACD is below the zero line, indicating a downtrend.
Starting Monday, if the price moves upwards, the 61.8% Fibonacci retracement is above the current price of around 39117. I can act as a resistance in the market. A mover above 61.8% finds the R1 resistance and the 4-hour Bearish Engulfing Order Block around 39457. For the downtrend to be on track during this timeframe, the price must stay under R1 resistance. Penetration of the R1 will likely lead to the price of testing the All-Time High at around 40031.
If the price continues moving downwards, the first support area, S1, is approximately 38568. If the price decisively penetrates it and moves lower, the next support area, S2, is around 38327.
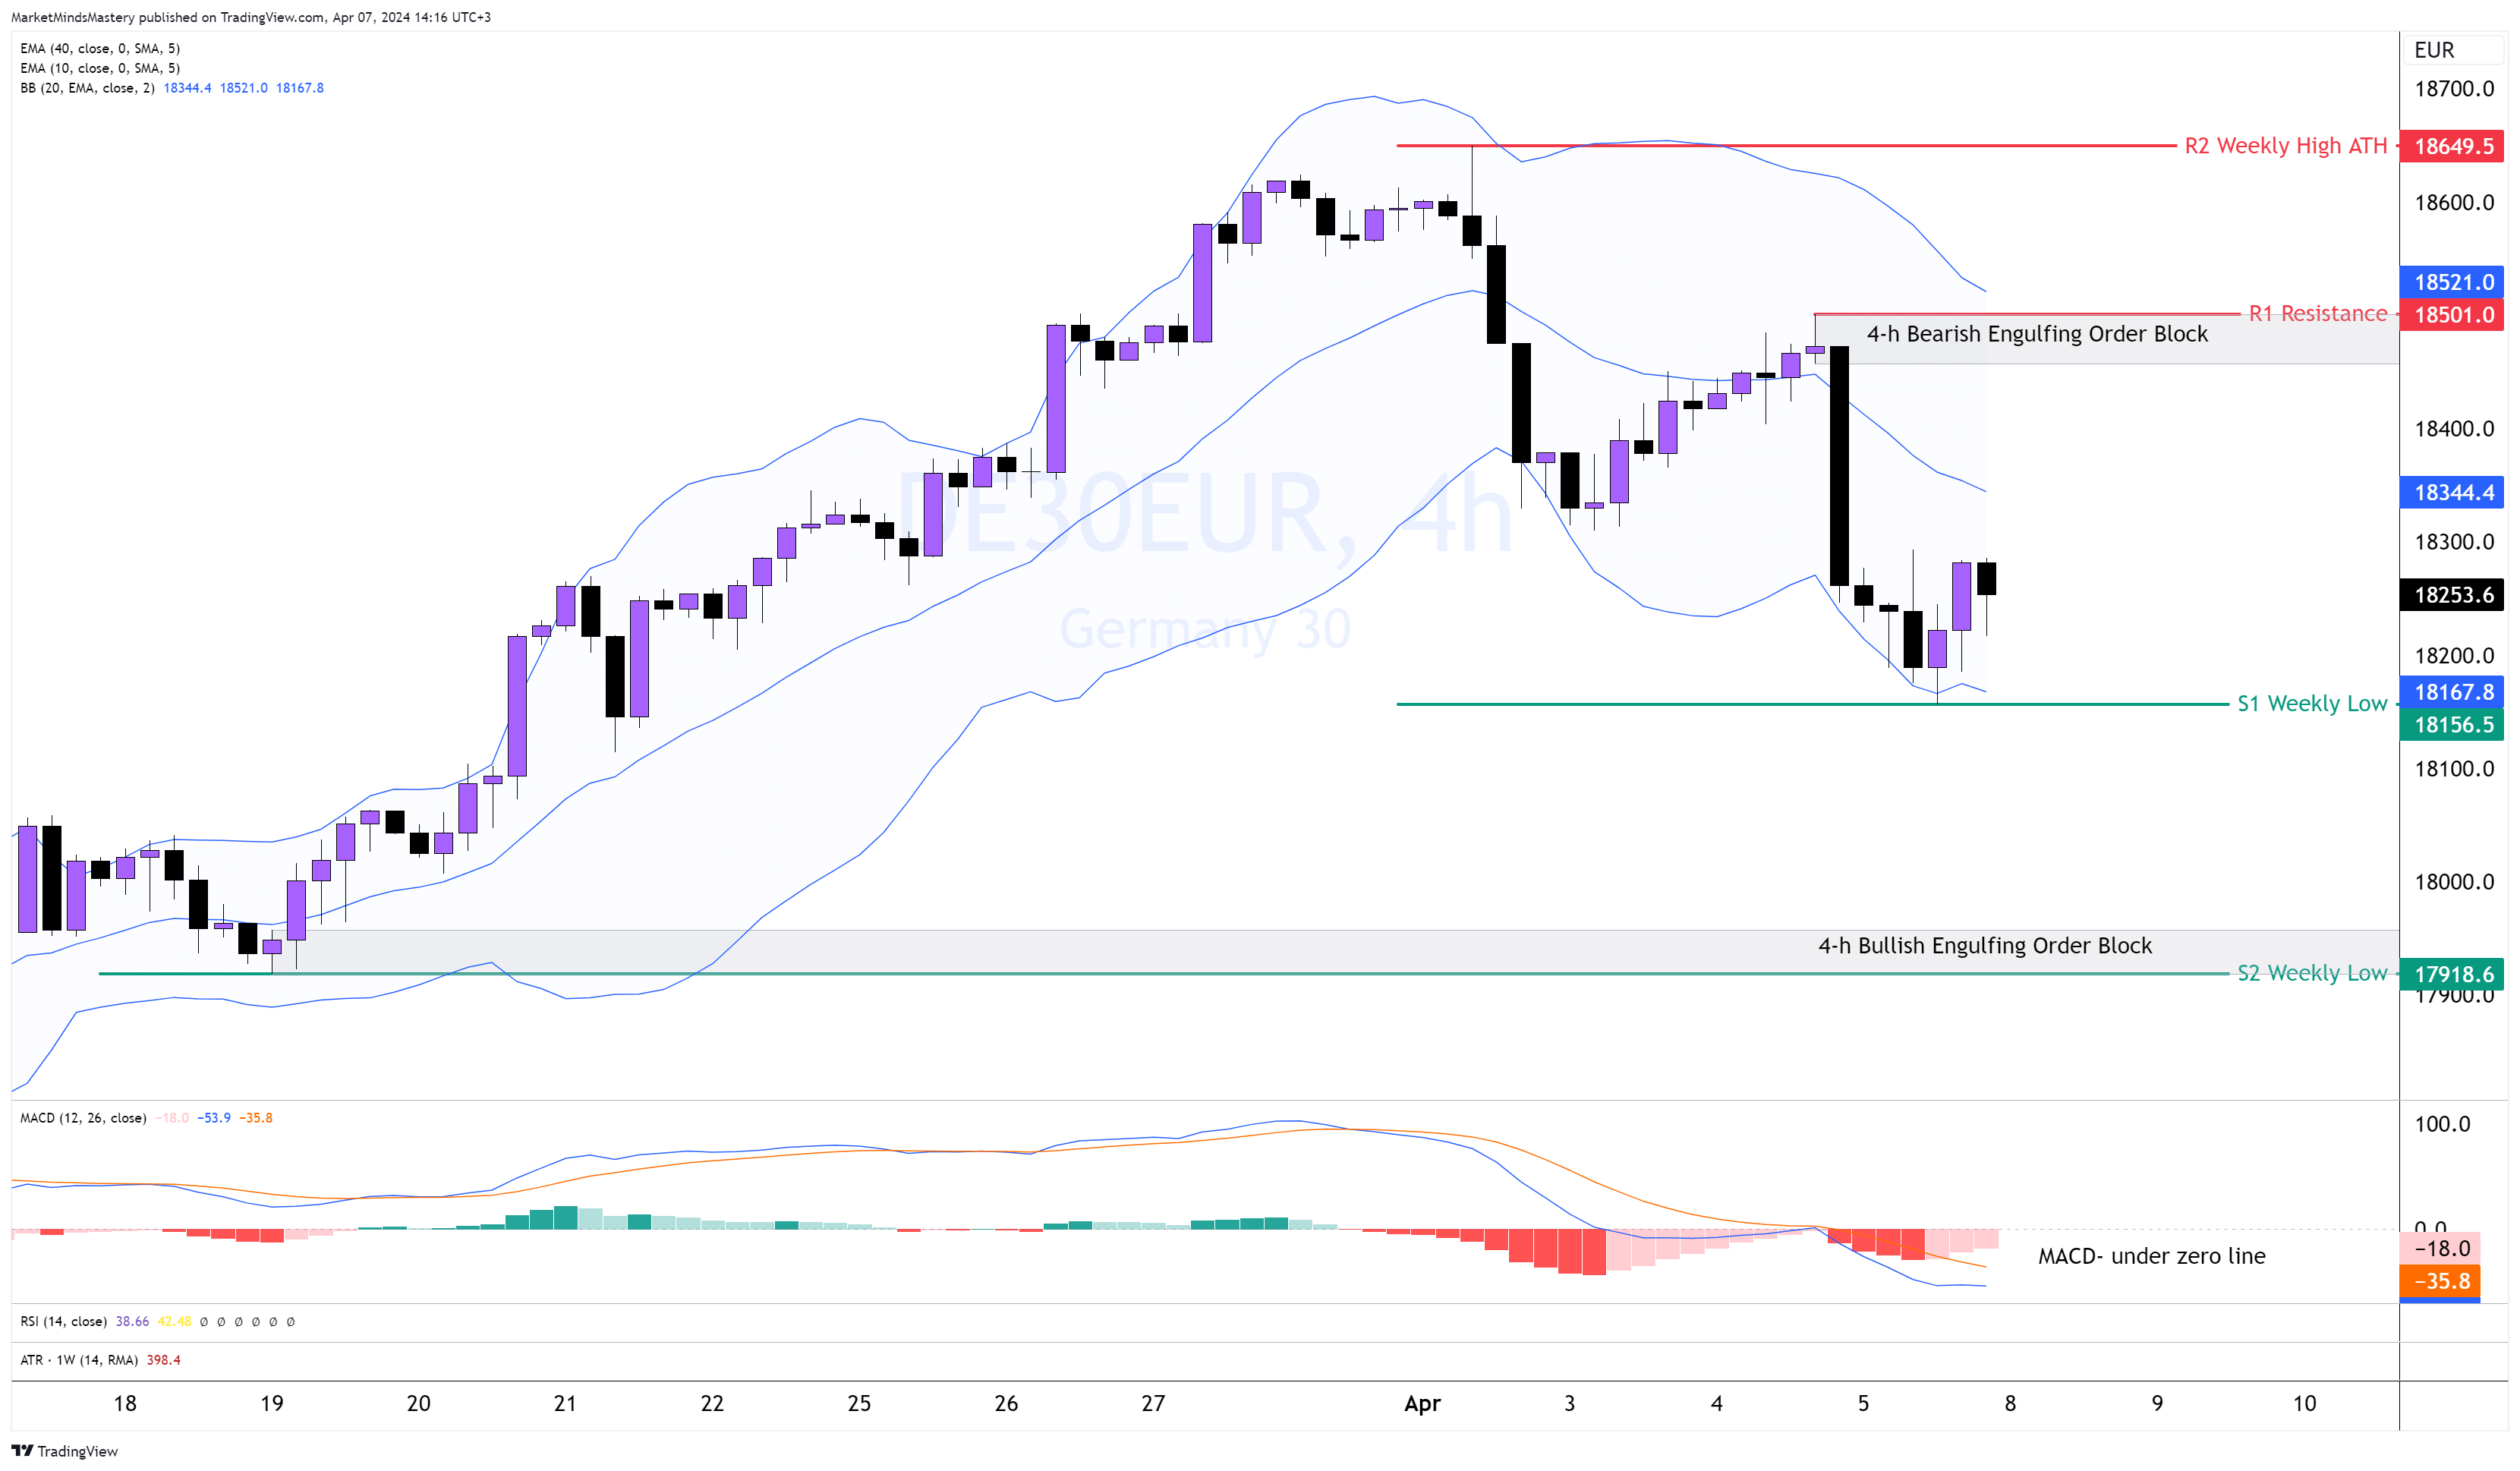
GER 40 4H
After an intense price rally based on the weekly chart, the GER 40 created a Bearish Engulfing reversal candle. This means that the trend is likely to lead to a price correction. Analysing the 4-hour chart, we see the price already made the first lower high and lower low, with an unusually long bearish candle. If the sellers are present, we will see a new lower low this week. The price touches the lower band, and the MACD is under the zero line, indicating bearishness.
If the price moves upwards for a correction, the 4-hour Bearish Engulfing Order Block should act as a solid resistance, R1 around 18501. If the price penetrates the R1 and trades above it, the next resistance area, R2, is the ATH, approximately 18649.
On the other hand, a downtrend continuation will meet the first support area S1, around 18156. If the price breaks, closes below it and moves downwards, the next support area is approximately 17918.
👉 Click here to check our Challenges
👉 Don’t miss our Free Live Webinars
👉Join us on Discord
Risk Disclosure:
The Trading Pit offers only demo accounts to all users within the Challenges and Signal Provider Agreements (Scaling Plan). All assets and trading activities are purely virtual. Please note that we do not offer CFD (Contract for Difference) challenges to residents of Canada and the United States. All content and information on this website is for informational purposes only and should not be interpreted as financial advice. Also, remember that results achieved in the past are no guarantee of future results. It is essential to understand the risks associated with trading. If you are unsure, always consult an independent financial advisor.