The Trading Pit Week Ahead Market Outlook (February 26 – March 03)
Last week, the market volatility wasn’t significant based on volatility metrics compared to other weeks, while there weren’t too many important events. Moving into the last trading week of February, there won't be any significant news events on Monday and Tuesday. Therefore, volatility is expected to be as usual.
On Wednesday, during the Sydney and Asian trading sessions, they will report the CPI (Consumer Price Index) in Australia. The consensus estimates an increase of 0.1%. In the last report, the CPI was 3.4% and now is estimated to rise to 3.5%. This will be significant for the Aussie, and if the market follows through, the AUD is likely to increase. Therefore, it can cause the AUDJPY and AUDUSD to rally at least until the following resistance areas. The focus, though, will be on the Kiwi, as the Reserve Bank of New Zealand is about to report the new Interest Rates for the month, and they are looking to keep them unchanged at 5.5%. Usually, when the IR remain unchanged, the currency depreciates. Right after the IR will report, the Monetary policy statement and the press conference will occur. The last significant event of the day will be the US GDP (Gross Domestic Product). As per the consensus, the numbers are expected to remain the same as they were the last time, at 3.3%.
On Thursday, Australia will report its Retail Sales numbers. Previously, it was reported as -2.7%, and the forecast estimated an increase of 1.7%. This will be a significant increase, and if the market participants rush to buy the Aussie, a promising rally is around the corner. The news will get busy during the London trading session, with Germany first to report the Retail Sales for January. Currency, they are sitting at -1.7%. Next will be the Gross Domestic Product in Switzerland. No forecast number is given. The last report was 0.3%.
During the New York Session, the CPI in Germany will be reported. Consensus estimated a drop from 2.9% to 2.6%. If this is confirmed, it can set the Euro for weakness. Hence, the EURAUD on the weekly chart is in an intermediate bearish sentiment, and if the Australian dollar gains strength, it can set a bearish tone on the currency pair. Thirty minutes later, the GDP will be reported in Canada, and from -1.1%, an improved number to 0.8% is forecasted. We can experience high volatility around the Canadian dollar during the event. The CADCHF, in a short or near-term trend, moves upwards. Therefore, if the Loonie (short for CAD) appreciates and the Swissy (Short for CHF) depreciates, a continuation of the upward move of the CADCHF can be set.
Lastly, they will report the NBS and Caixin Manufacturing PMI in China on Friday. The attention for the day will be on the Eurozone as they will report the CPI, which is expected to drop from 3.3 to 2.9%. Again, this will add to the Euro weakness and the EURJPY as a decline as it approaches a significant area, just below the 165. The last event of the week will be the ISD Manufacturing PMI in the US. The numbers are still forecast to remain below the benchmark of 50.
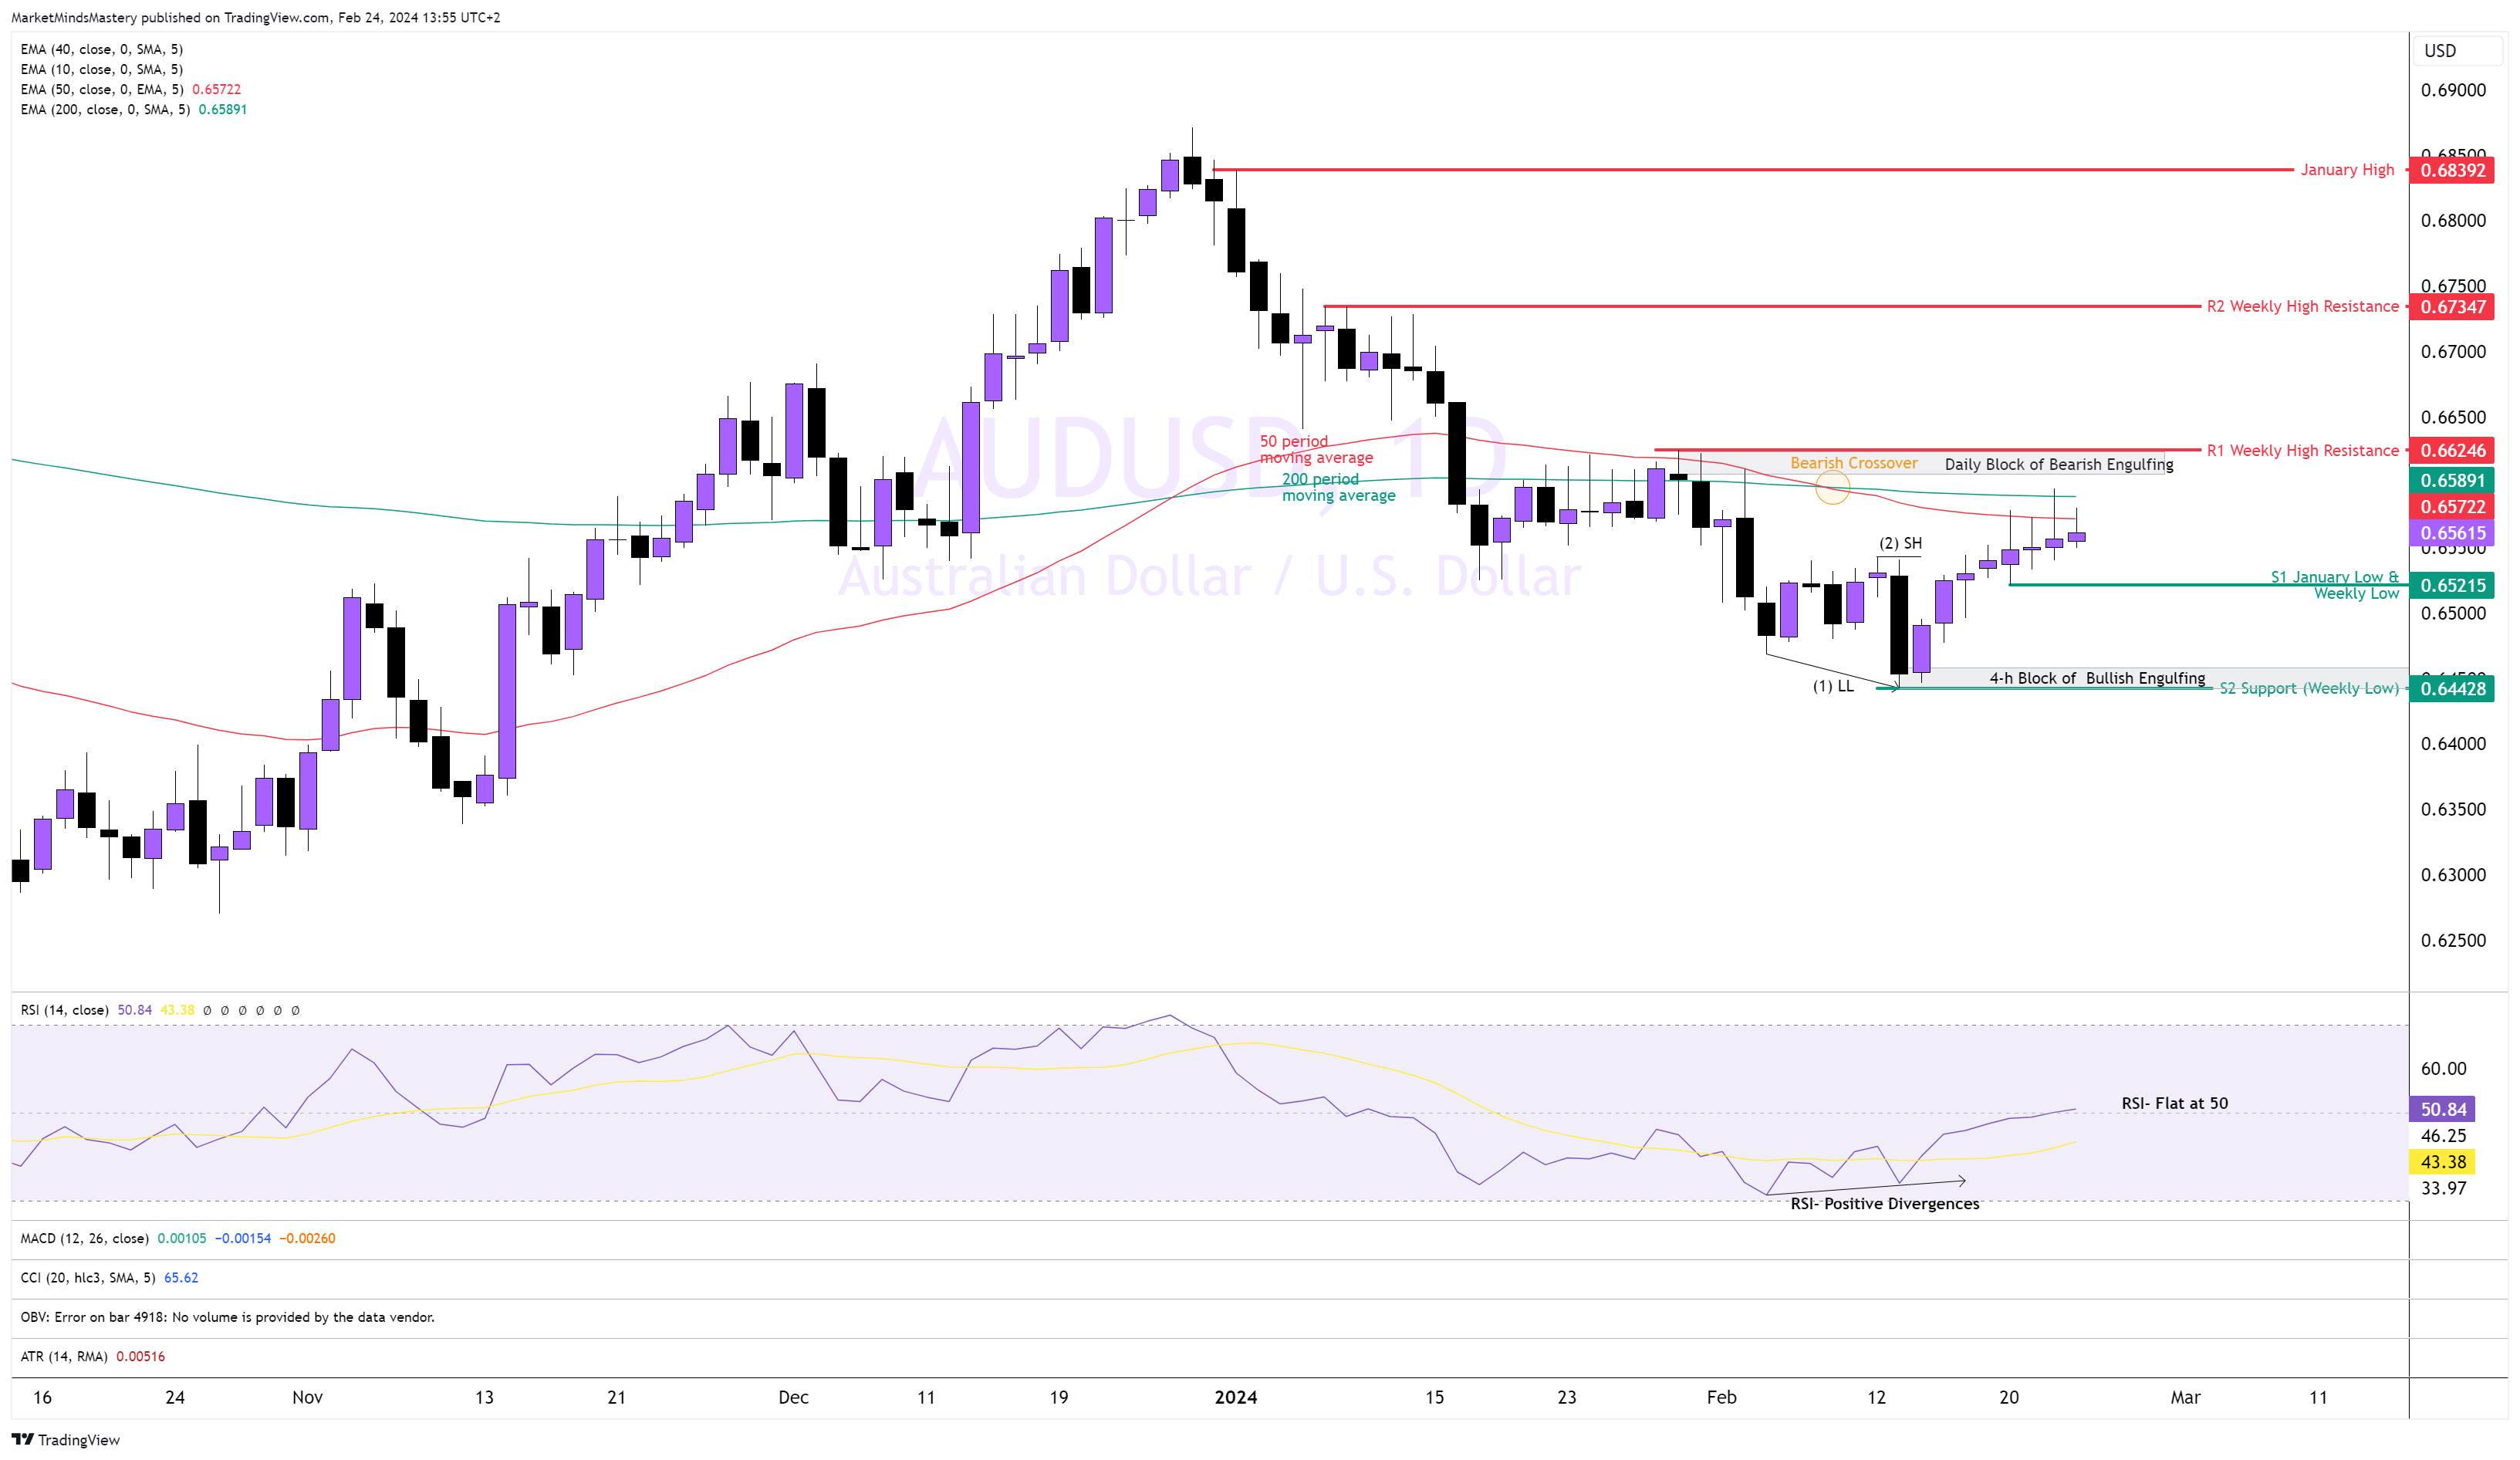
AUDUSD Daily

Last week, the price of the AUDUSD moved upwards, creating a new weekly high and low. Regardless, the price averaged a total move of approximately 60 pips. The weekly average of this pair, based on the ATR, is approximately 130 pips. The last five candles show that the bodies are smaller than their wicks.
Also, the prices were rejected and closed below the 50 and the 200-period moving averages. The RSI is flat, around 50. The price at point (1) created an LL and three days later retraced 100% of the move, and at point (2), it penetrated the Swing High. If the price continues upward the next week, the first resistance, R1, is the area around 0.66246, and this is a weekly high price. Opposively, if the price declines and moves lower, the S1 support is January’s low, which consists of last week's low of around 0.65215. A further price decline can test the S2 support at around 0.64428.
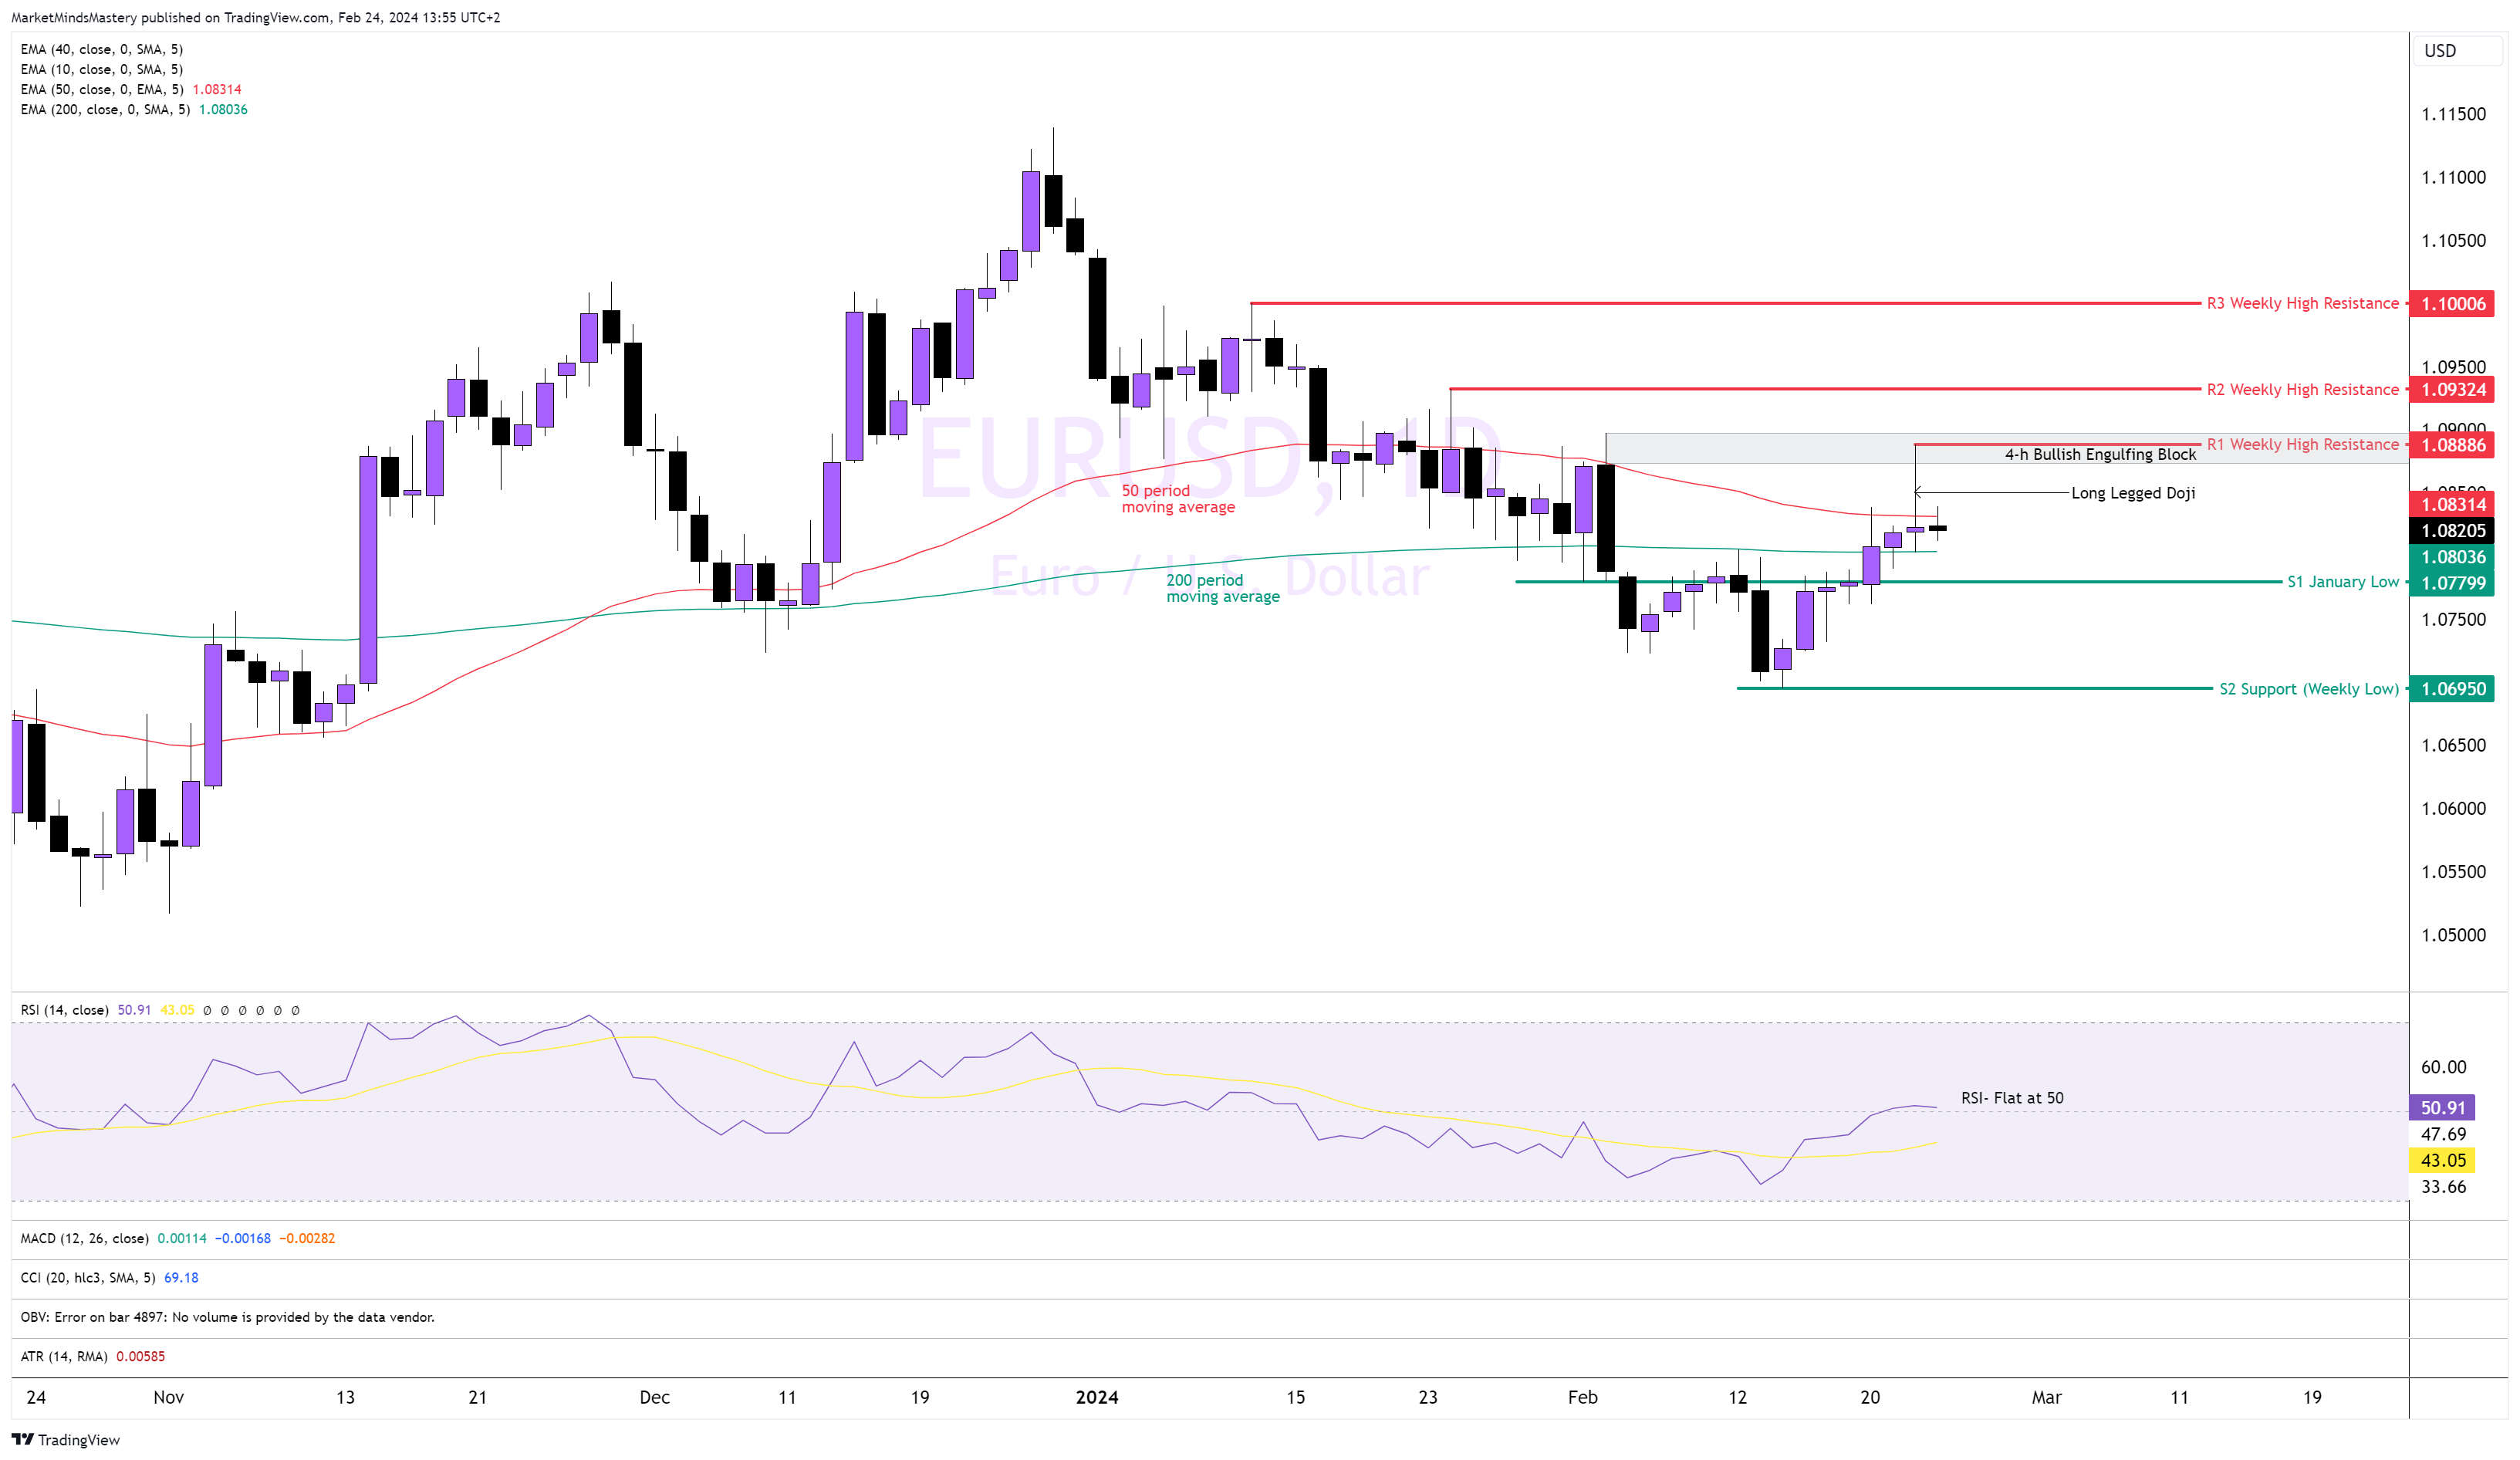
EURUSD, Daily
Last week, the price in a trial to move beyond the 1.09 price level got rejected by the 4-h bearish engulfing block and by the end of the week, it also got rejected by the 50-period moving average, leaving behind a long wick—currently, the price is between the 50 and the 200-period moving averages. Based on the moving averages, the bias is natural. Also, the RSI is flat at around 50, which means the market is directionless. Starting Monday, if the price moves upwards and penetrates last week’s high, it will find the next Resistance around 1.09324. On the contrary, if the price declines and moves lower, the first support area is January’s low, around 1.0800. If the price doesn't bounce off last month's low and moves below it, the next area of support, S2, is a weekly low of around 1.06950.
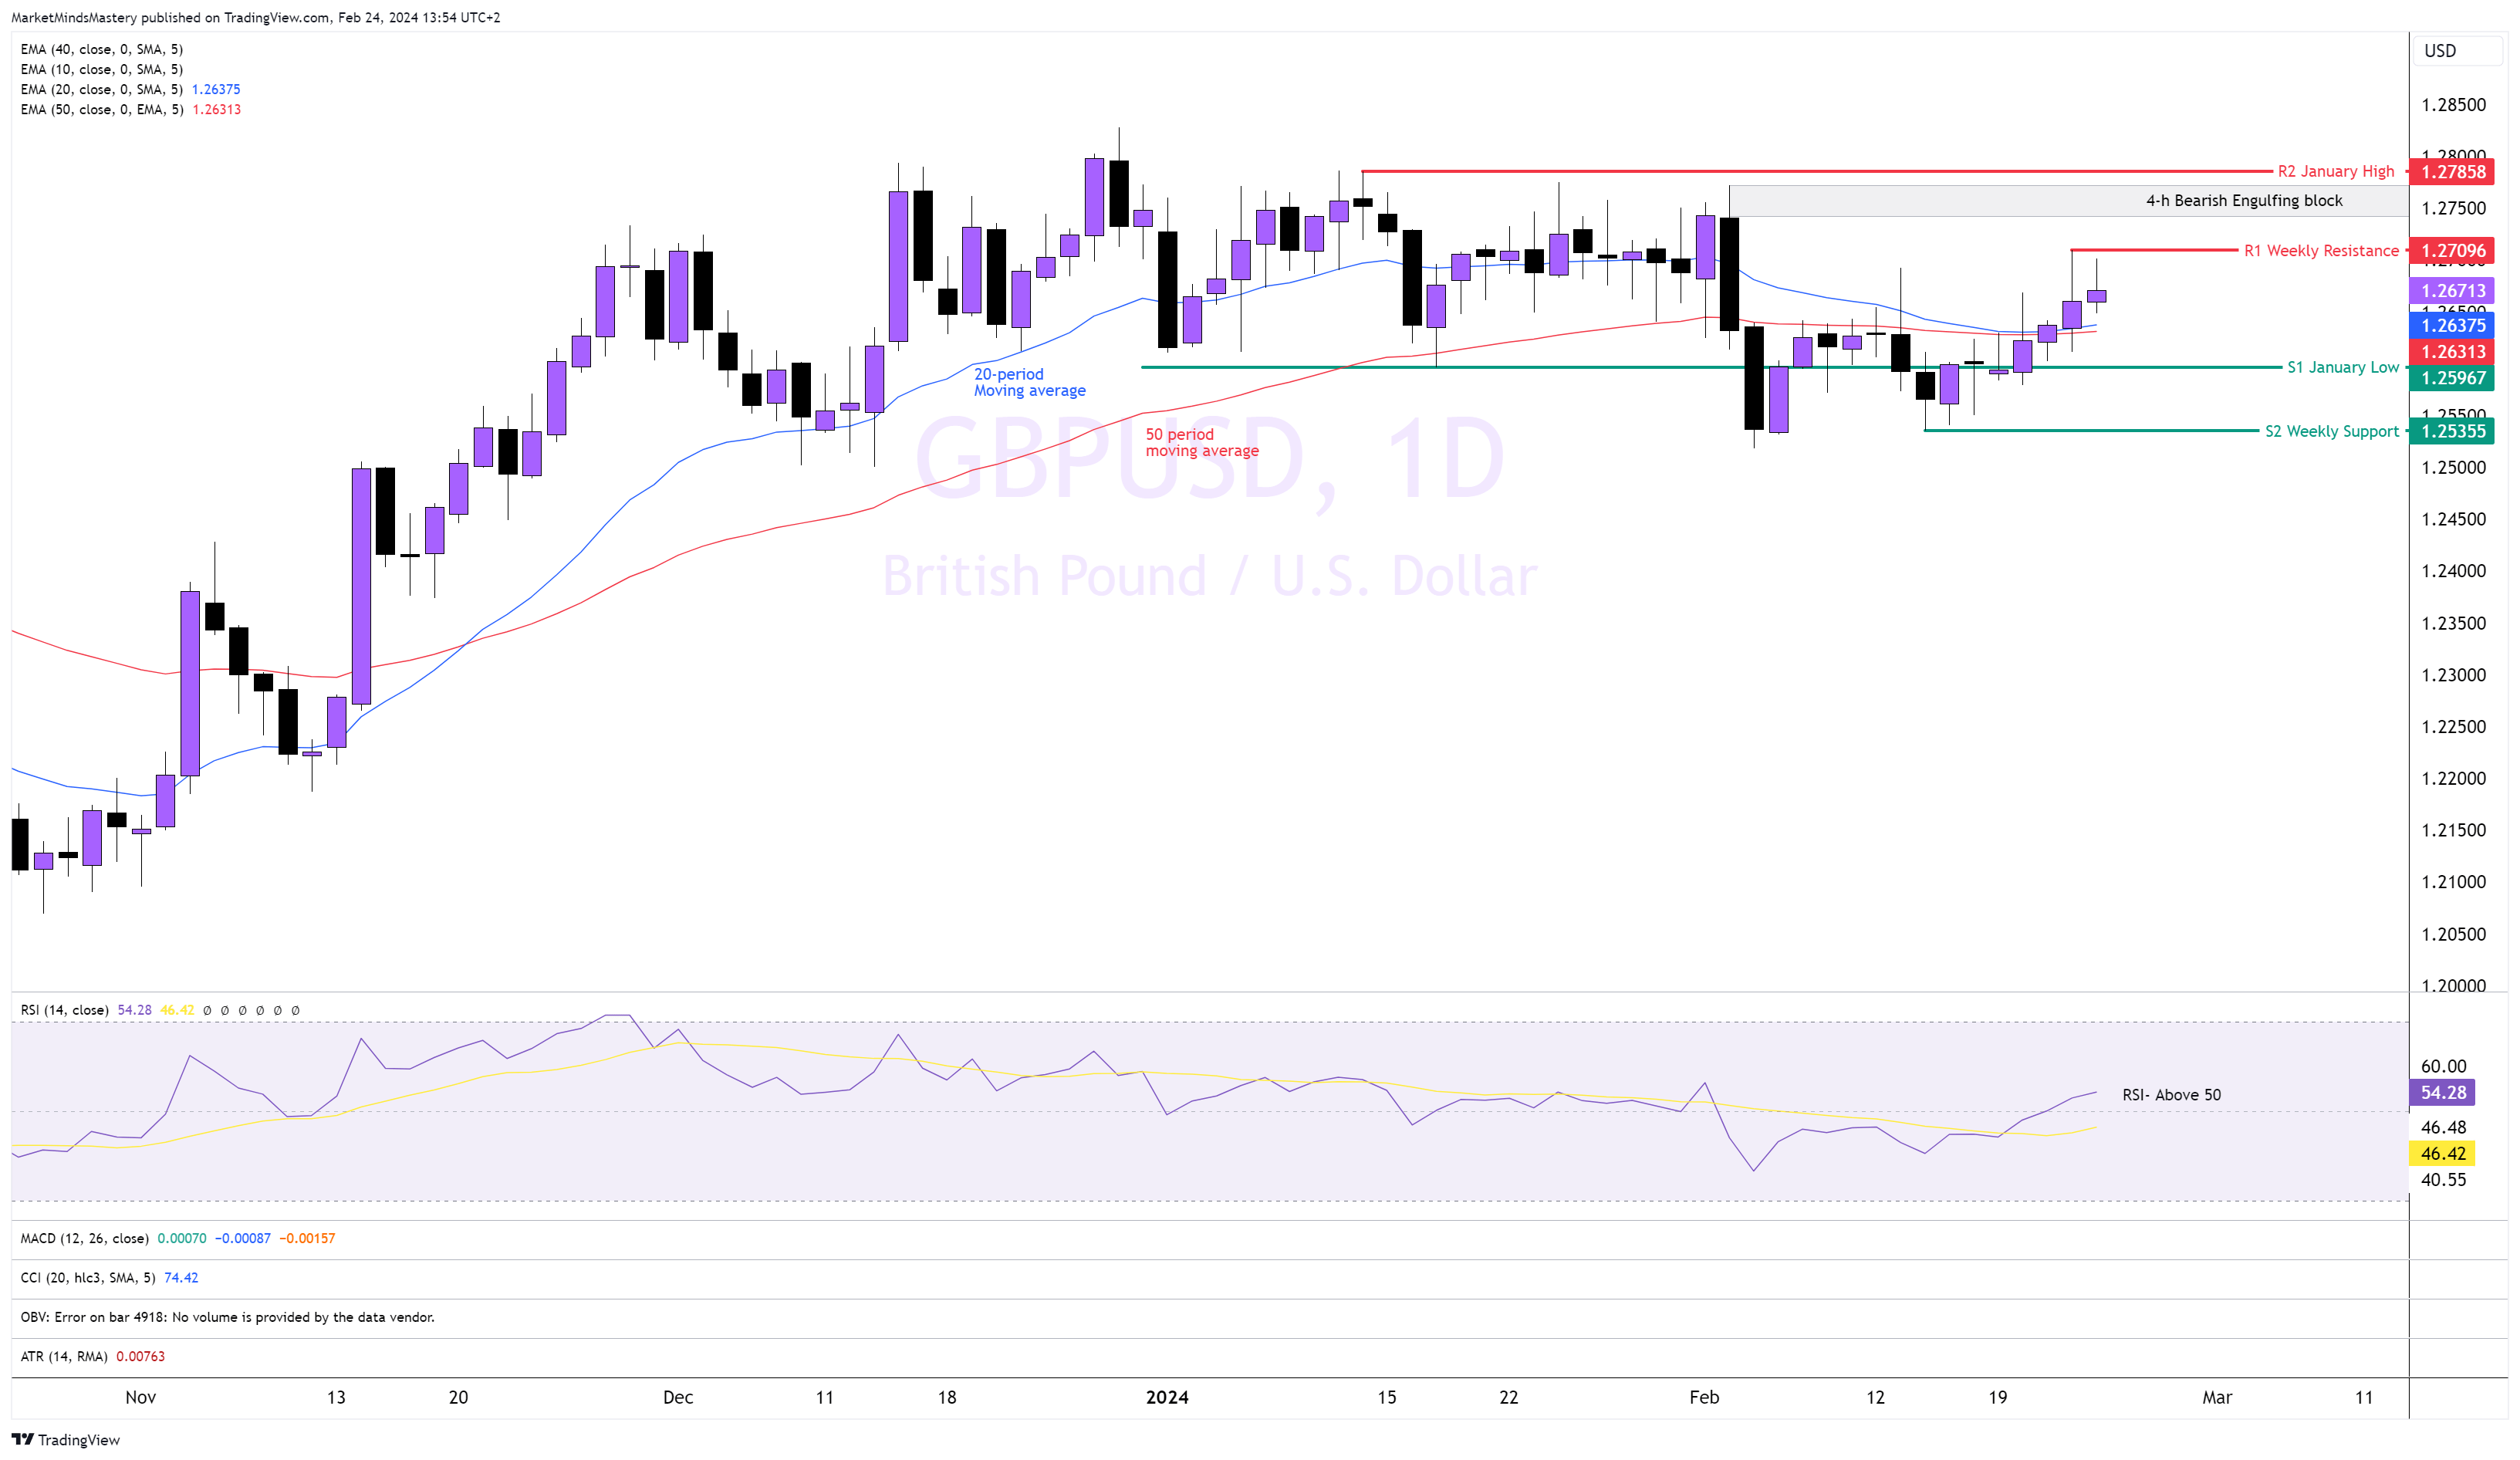
GBPUSD, Daily
Following the failure swing pattern we explained in the analysis last week, the Sterling moved upwards, penetrating and closing above the 20 and 50-period moving averages. The price was also entrenched into the Daily bearish engulfing block area last Thursday, and it didn’t sell off instantly. The RSi is above 50, which is considered bullish. So, based on the moving averages and the RSI, the market has a bullish bias. However, the price hasn’t created a directional upward move. Also, the candles have noticeable wicks and are long compared to their bodies. Therefore, if the price moves upwards, last week’s high is the first resistance, R1, around 1.27096. If it penetrates and closes above it, the next resistance area, R2, is a monthly level that hosts a 4-h bearish engulfing block. Conversely, if the price declines and moves lower, the first support area, S1, is last month's low, approximately 1.2600. A close below it and a move lower, find the following support, S2, around 1.25355 level.
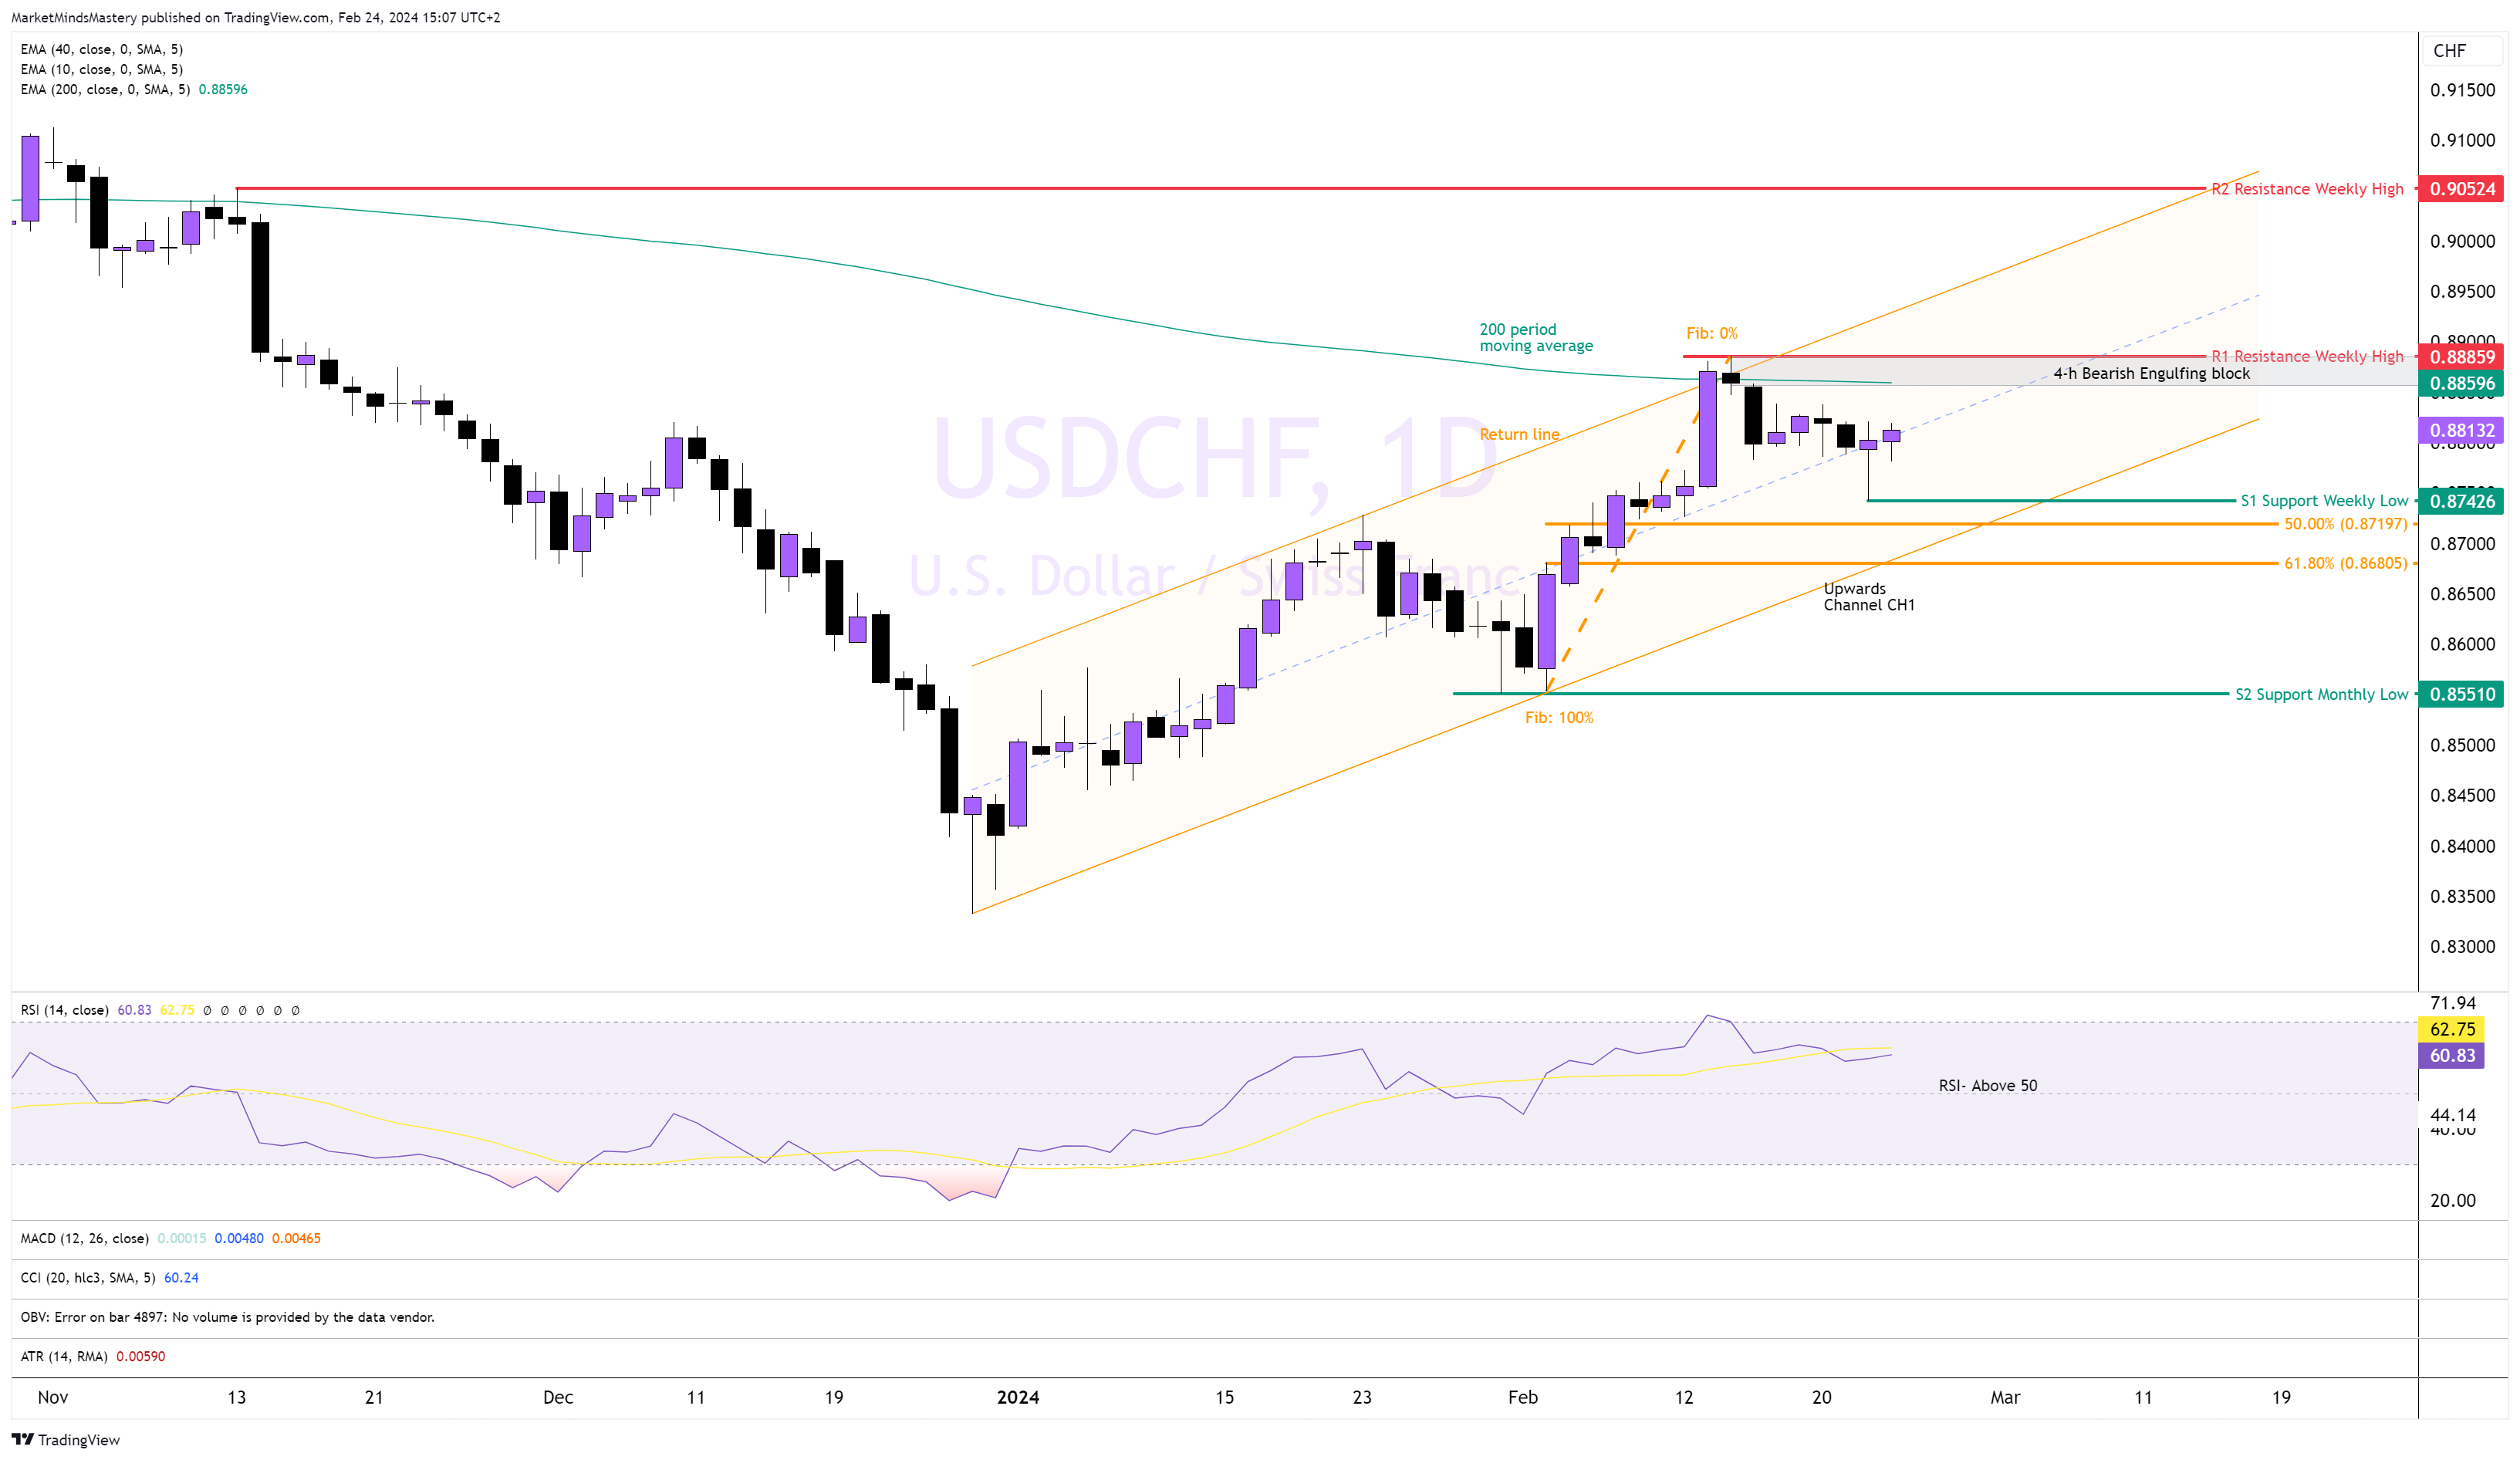
USDCHF Daily
The Upwards channel, CH1, is still valid as it hasn’t penetrated the price. Last week, as we explained, the price was trading upwards, and a bounce off the recent swing high was possible on price correction. That occurred, and simultaneously, the price tapped into the 4-h bullish engulfing block and bounced upwards last Thursday, leaving behind a long wick. The RSI is well above the benchmark 50, and this is bullish. The price currently trades around the middle of the upward channel CH1, which is also bullish.
If the price this week continues to increase, the 200-period moving average can act as the dynamic resistance, currently around 0.88596. As the MA changes when the price changes, its value fluctuates. Around the same price region is the R1 resistance from a weekly high and a 4-h Bearish engulfing block. If the price penetrates it and moves beyond that, the channel’s return line will be the next resistance. On the other hand, if the price declines and moves lower, the last week’s low is the first support, S1, around 0.87426. If the price decisively closes below the S1, the next support, S2, can be the upward trendline of the CH1 channel, which consists of the 61,8% Fibonacci retracement level.
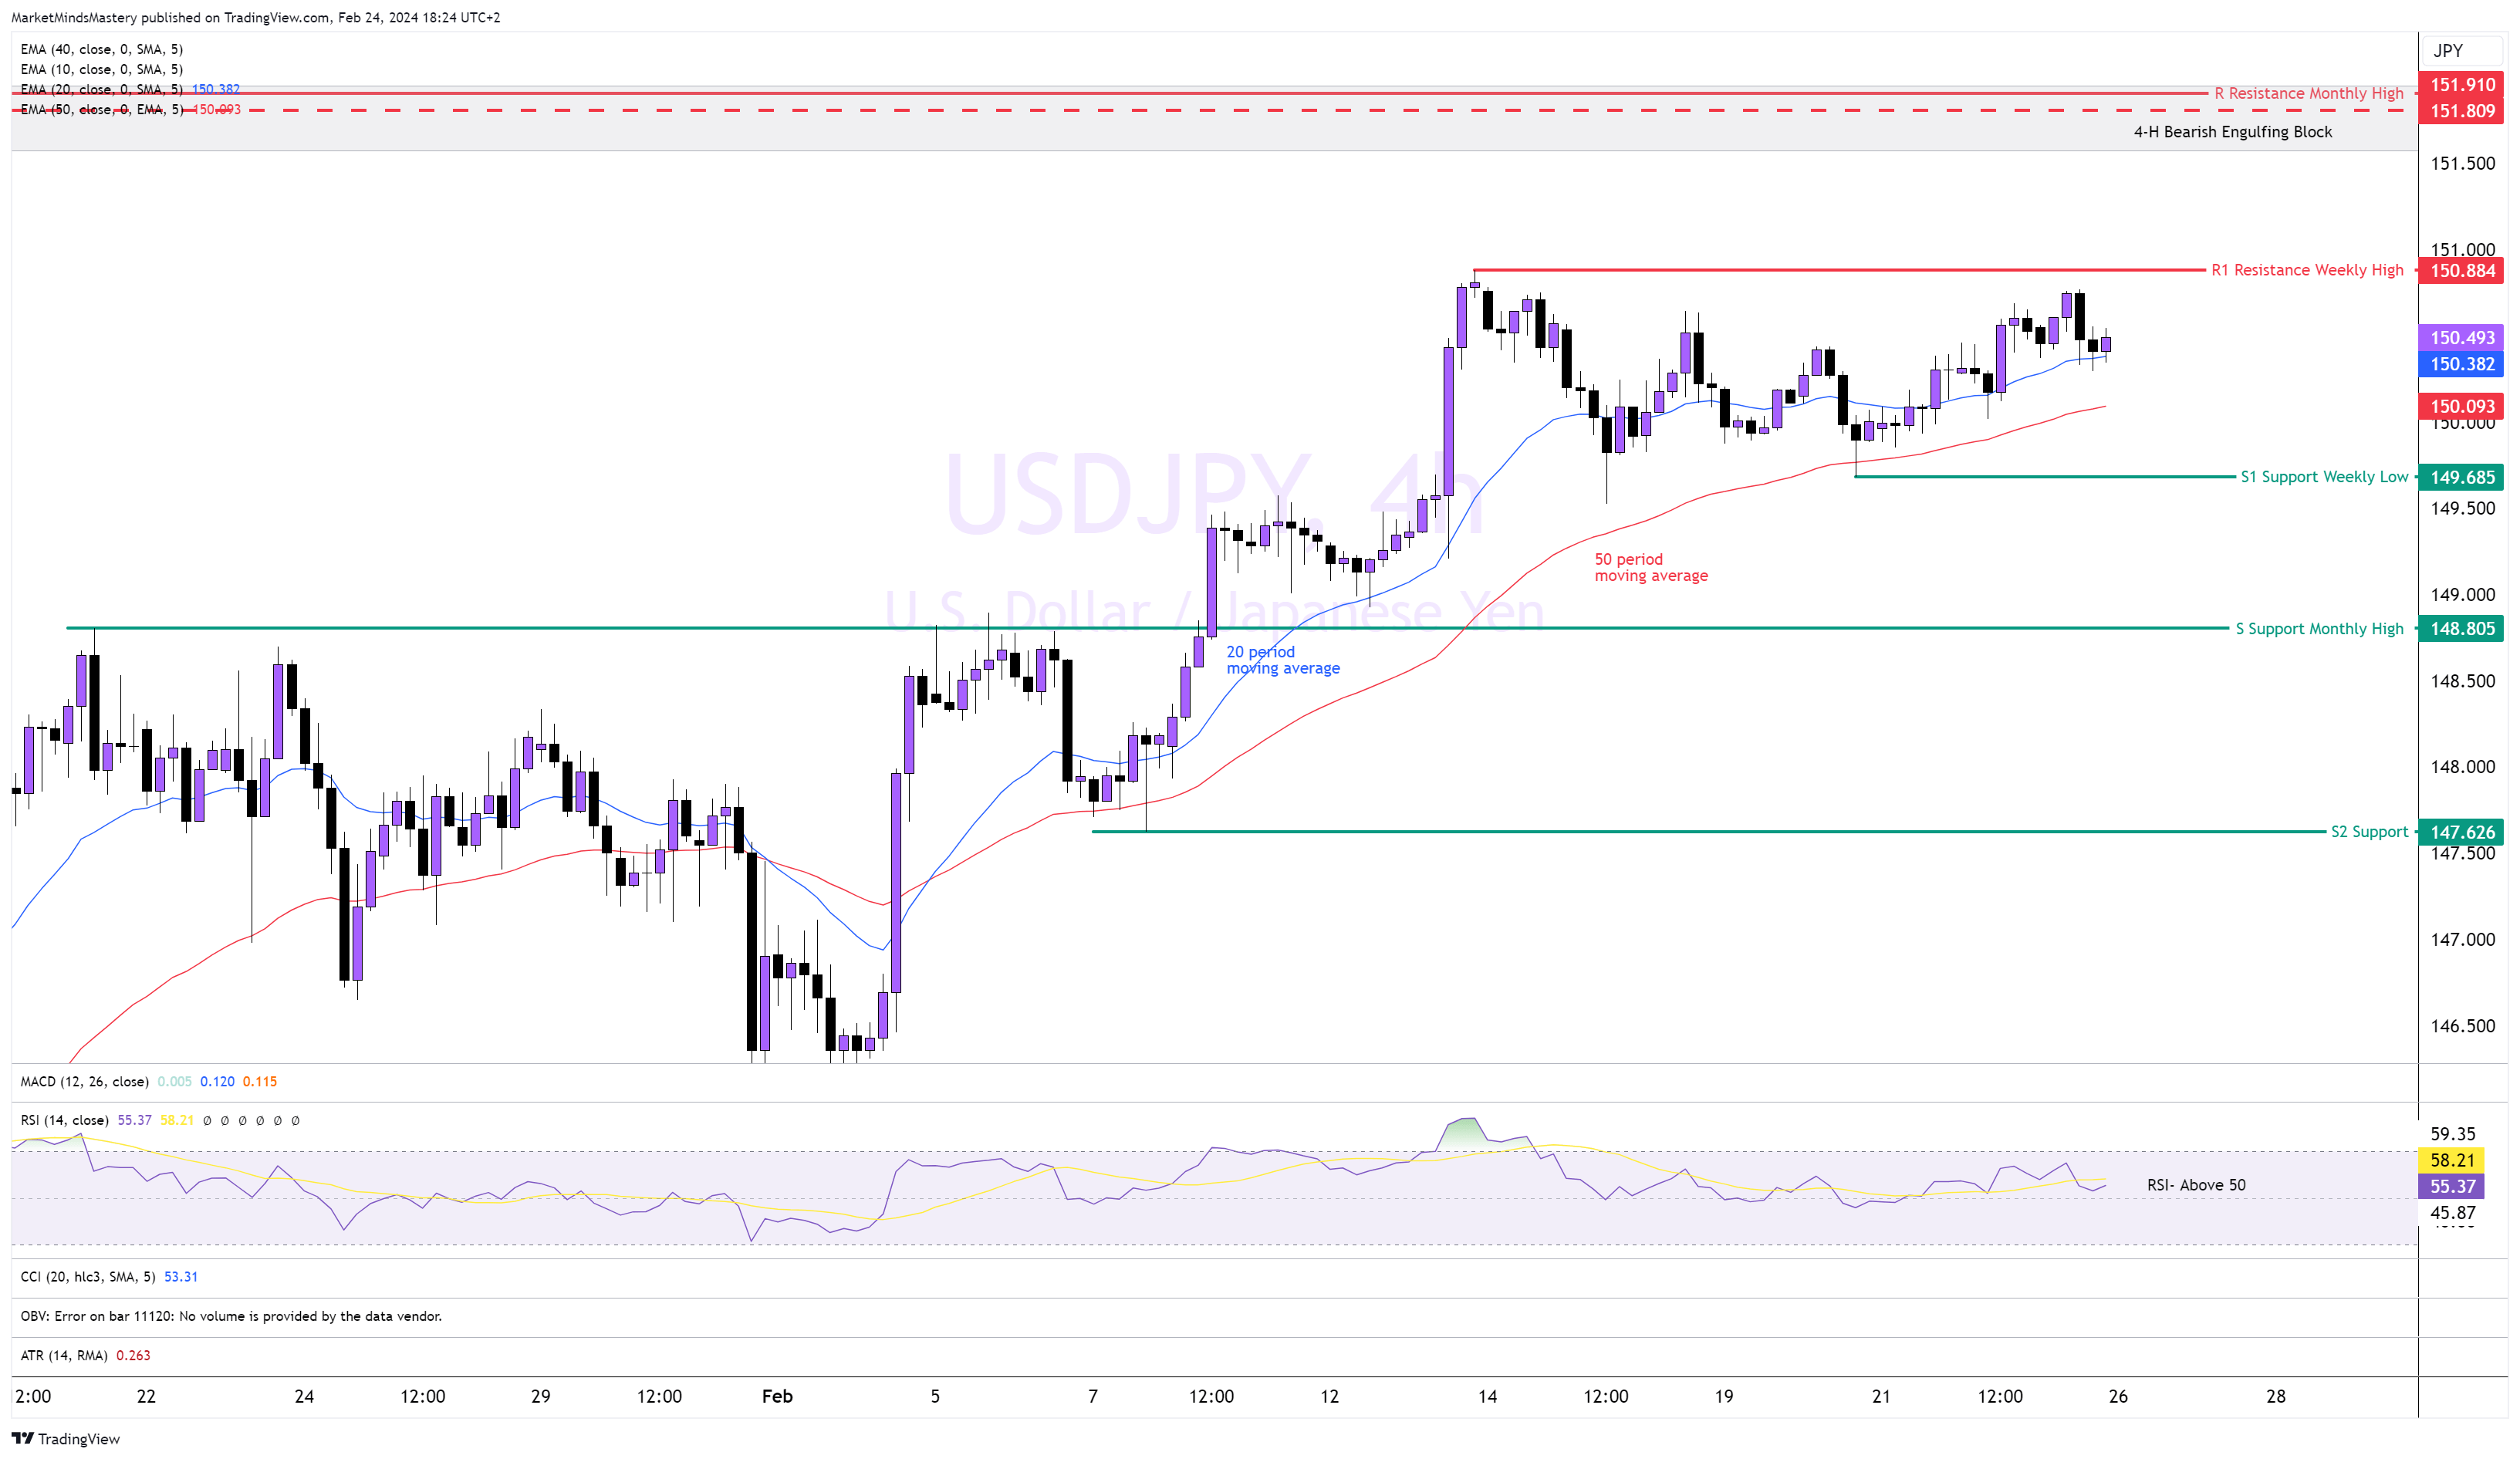
USDJPY 4h
Following the uptrend that started at the beginning of February, the price on the 4h chart is moving upwards within a series of higher highs and higher lows. The 20-period is above the 50-period moving average, which has bullish implications. The RSI oscillator is above 50, indicating bullishness in the market.
If the price continues upwards, the first resistance area, R1, is a weekly high of around 150.884. If the price breaks and closes above this level, the next area of resistance, R2, becomes a monthly high, just below the 152.000 level. It is worth noticing that at this price area, a 4-h Bearish Engulfing block was established some time ago and hasn’t been tested yet.
On the contrary, if the price declines and moves downwards, the 50-period moving average can act as a dynamic support. However, the first static support is the S1, which is around 149.685 and a weekly low. A move below that can push the price to travel to the next area of support, S2, which is taken from the previous month’s high.
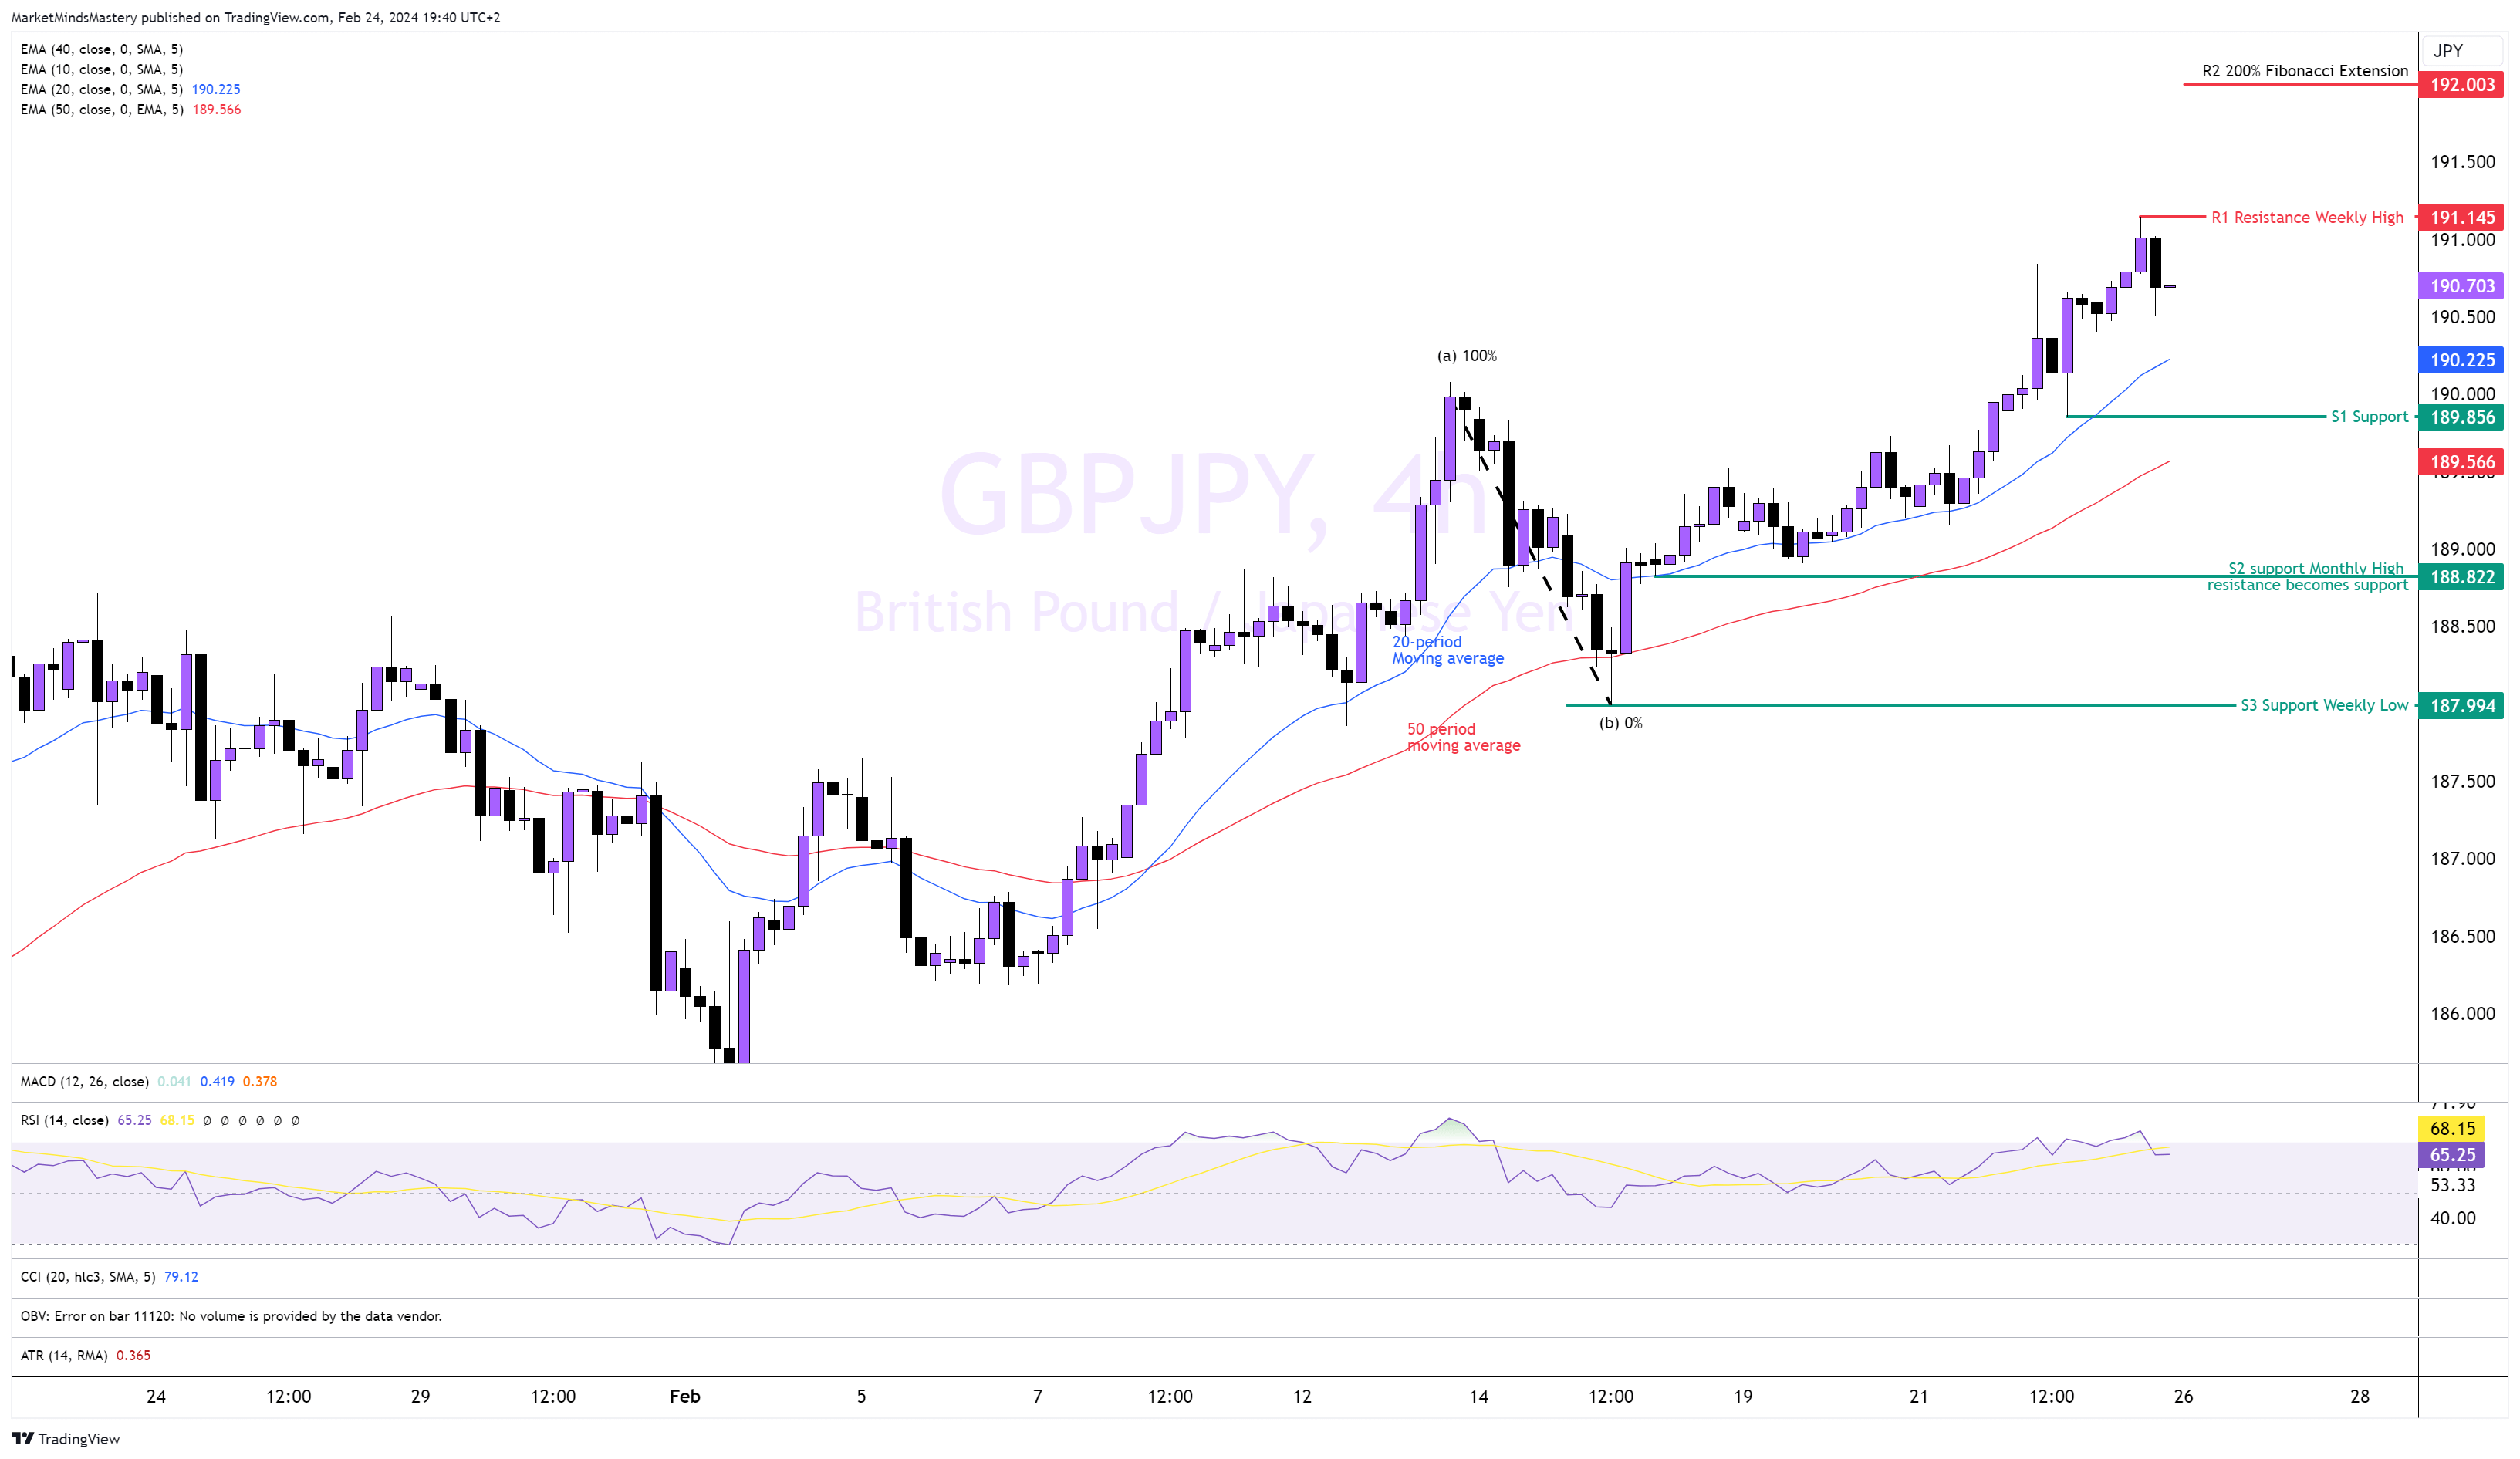
GBPJPY 4h
Following the higher highs and higher lows, an uptrend that started a few weeks ago was defined. The price increased last week, creating a new weekly high around the 191.145 level. The 20-period is above the 50-period moving average, indicating buying pressure in the market. At the same time, the distance between the moving averages gets wider, indicating bullish solid pressure. The MACD crossed above the zero line, and the MACD line is trading above the signal line, which is also a bullish indication. Therefore, if the price continues to increase, the most recent high will be the first resistance R1, around 191.145. If the price penetrates and moves above it, the next resistance is estimated using the Fibonacci extension from point (a) to point (b), measuring the most recent retracement. So, the R2 resistance is expected to be around the 192.000 level.
On the contrary, if the price declines and moves lower, the first area of support, S1, is approximately 189.856. A break and close below it can find the price testing the next support, S2, just below the 189.000.
This is considered a significant area, as last month's broken high level can now act as support based on the law of polarity (broken resistance becomes support and vice versa).
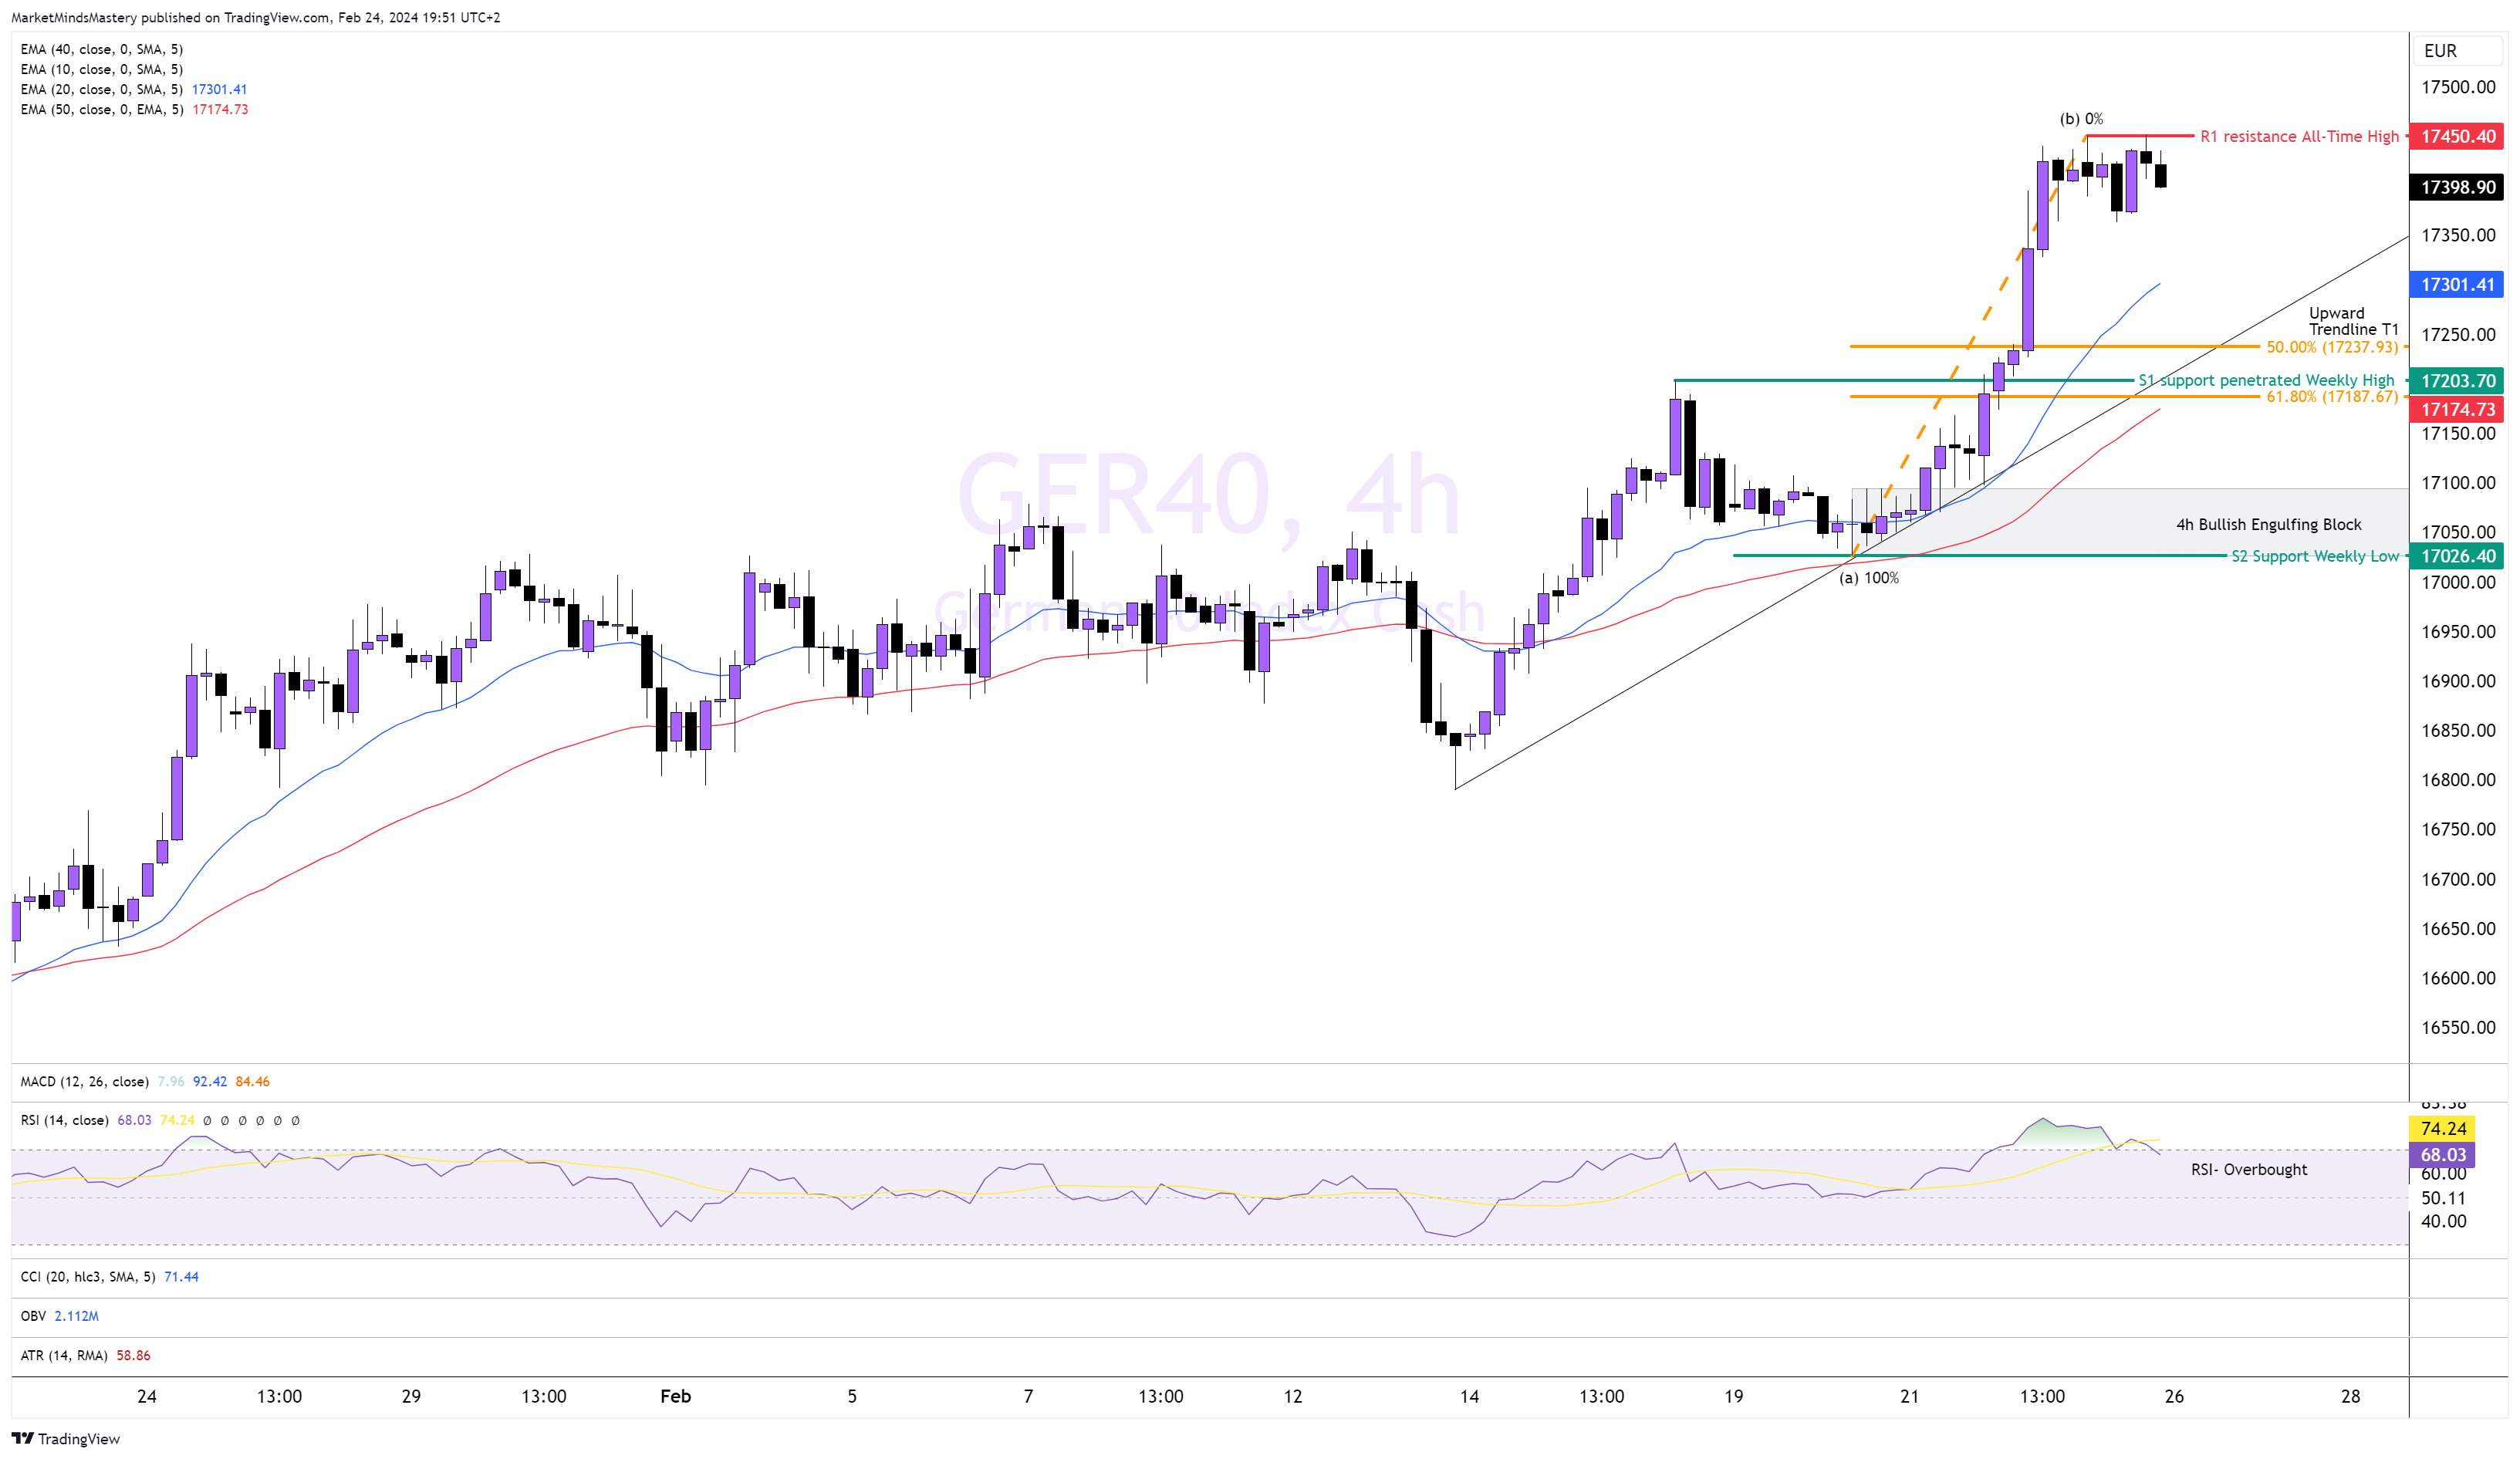
GER40, 4h
Following the last week’s bullish momentum, the price created a new all-time high of around 17,450. The 20 is above the 50 period moving average, and they are getting well apart. Also, the RSI is overbought, which is a bullish indication.
The price is above the upward trendline T1, which is also a bullish indication. Hence, if the price enters into a correcting phase and moves downwards, the first area of support, S1, consists of the penetrated weekly high, which now can act as a support, the area between the 50% and 61.8% Fibonacci retracement, the upwards trendline T1 and the 50-period moving average.
Therefore, this area of confluence factors adds weight to the validity of this 17,200 level. If the price declines further and moves lower, the next support area is a 4-h bullish block around 17,100. Opposively, if the price bounces off and moves upwards, we will use the all-time high as the first resistance, and if it continues rising, we can use the 17,500 as a round number for the R2.
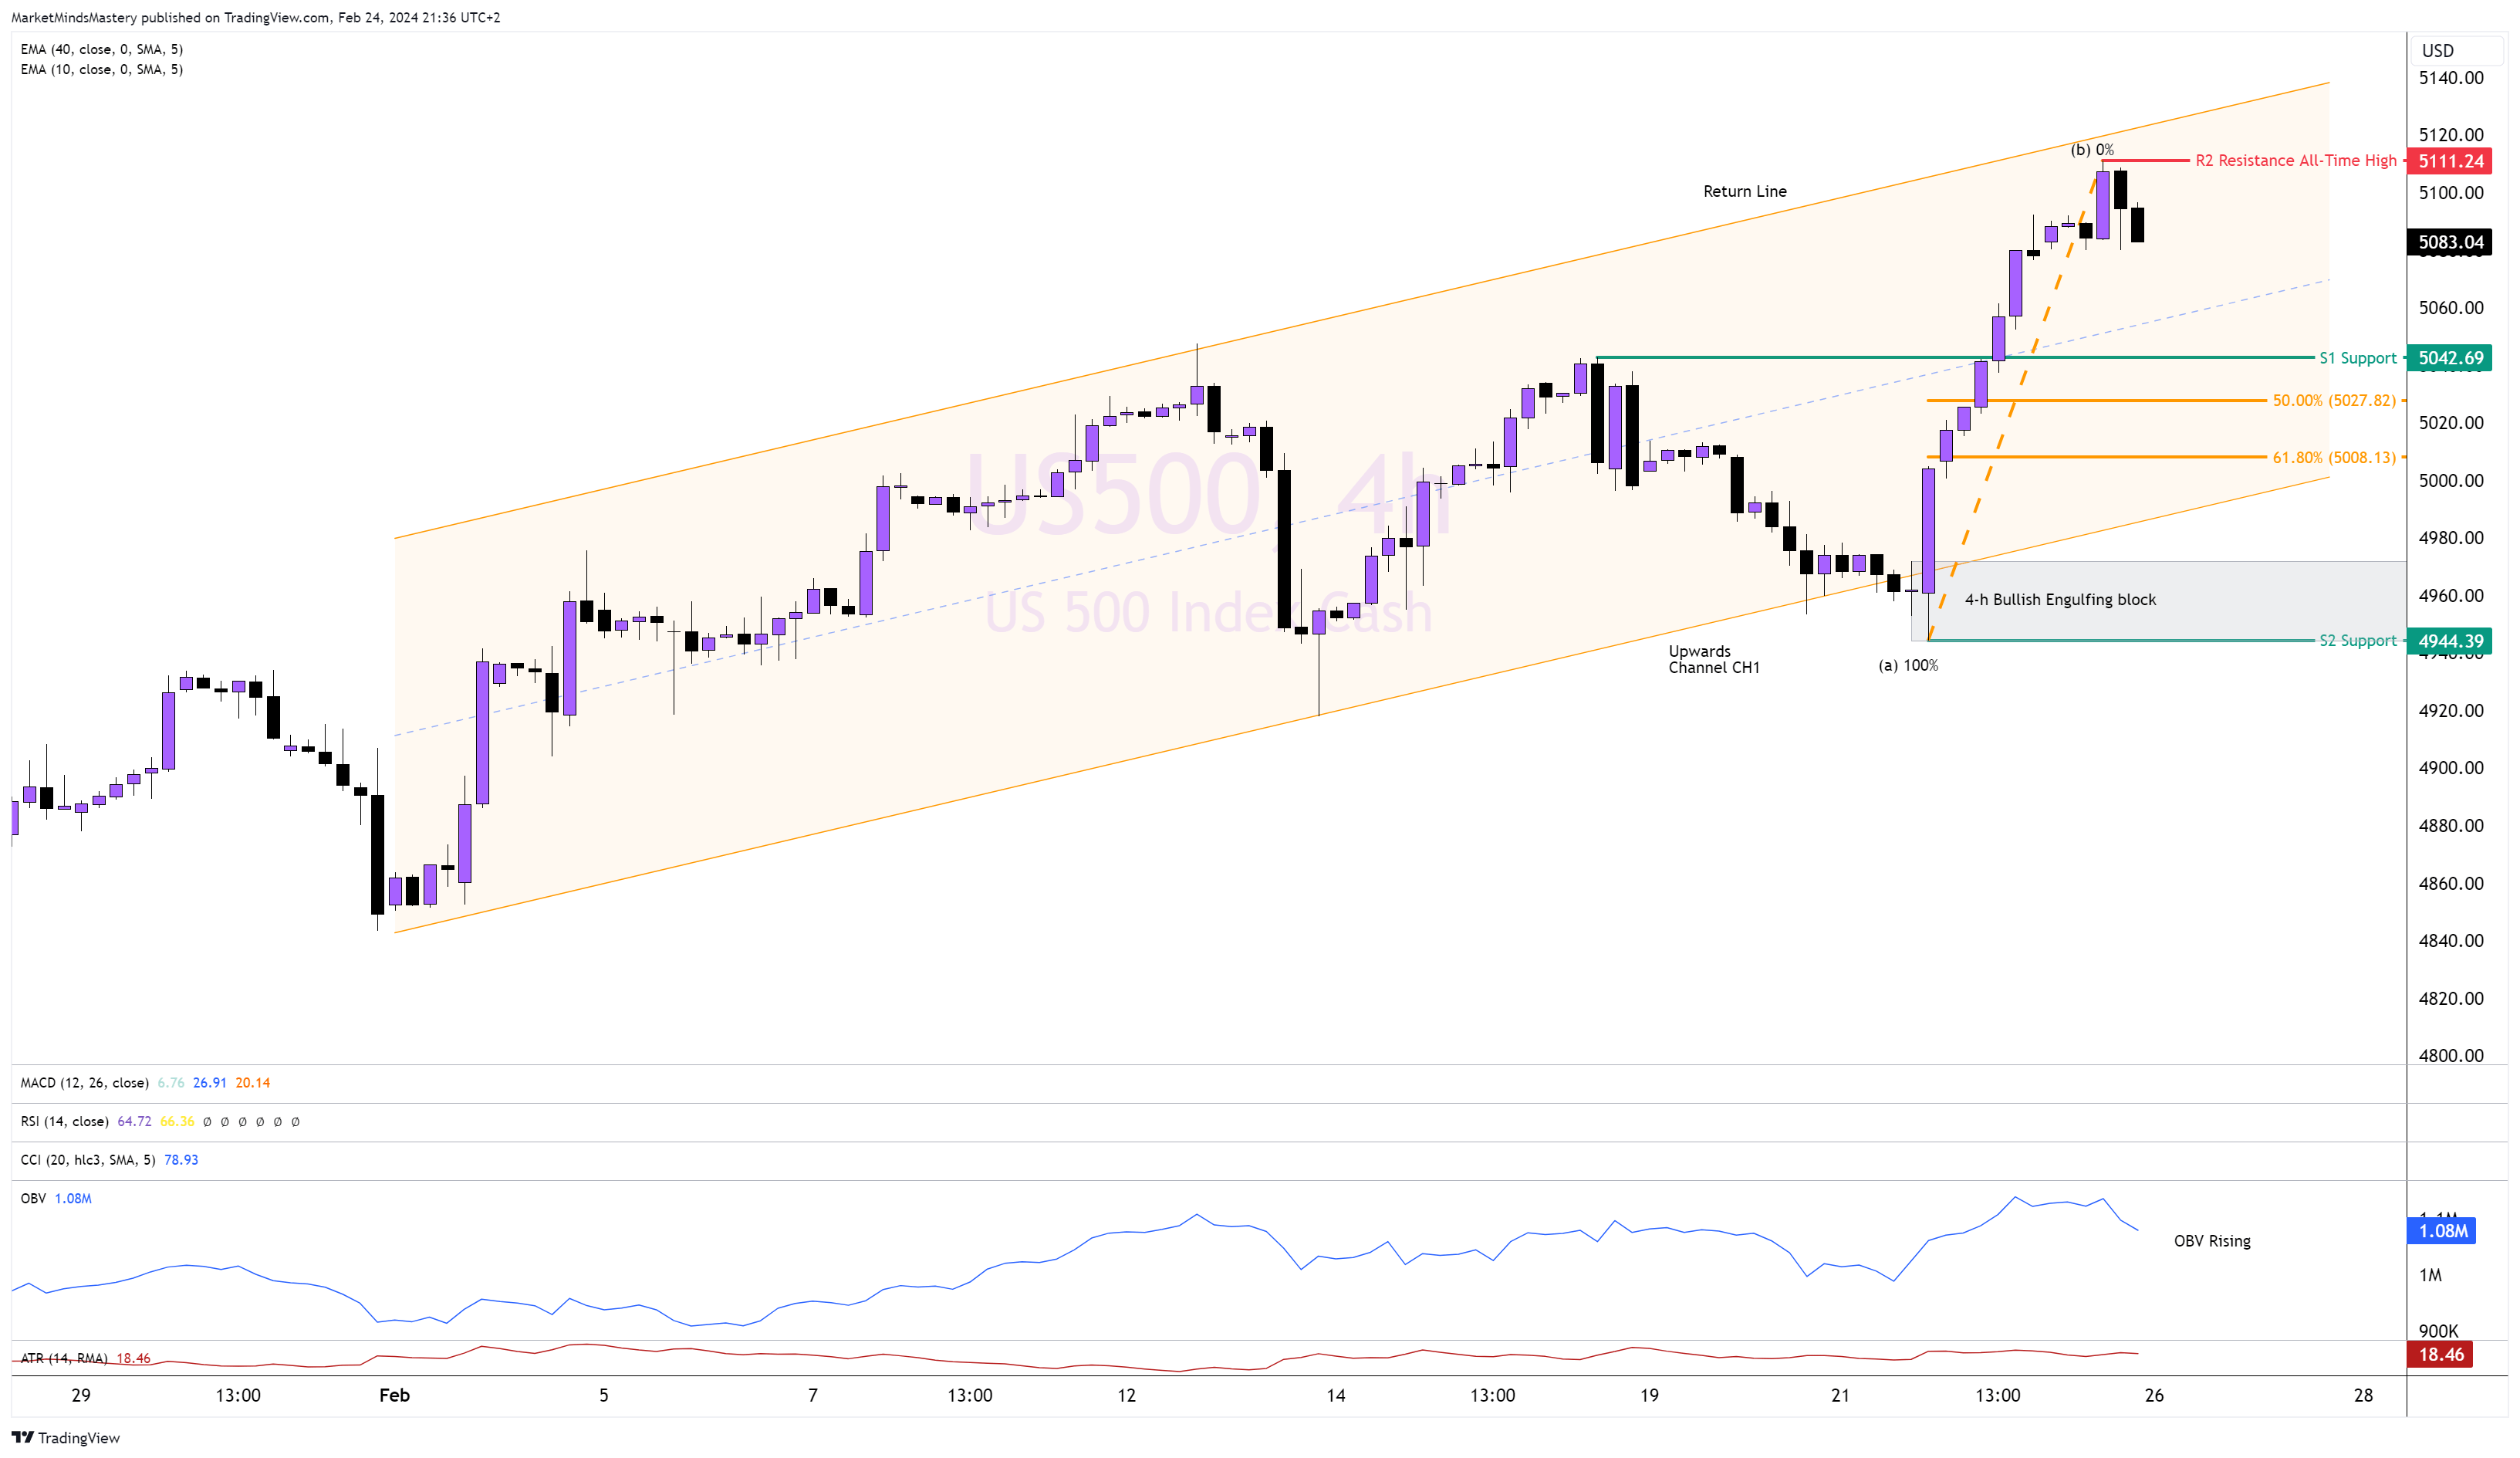
SP500, 4H
Last week, the price of the SP500 moved lower as expected because of the two bearish engulfing created. It reached the trendline of the upward channel CH1. Price bounced off afterwards, with a bulling engulfing with a long body, and then made a new all-time high, reaching almost the return line and stopping. A bullish engulfing block is created, which is pointed out on the chart. As the On Balance Volume indicator shows that money flows into the SP500, and the price rises, the price is expected to maintain its upward move. If the price continues to increase, the R1 resistance at an all-time high around 5111 will be the most relevant level. If the price penetrates it and rises, the 5125 is the next level we will look at.
Conversely, if the price declines and moves downwards, the S1 support around 5042 is the first found. This level was a recent broken swing high. Further decline can reach the 50% and 61.8% Fibonacci levels around 5027 and 5008, respectively.
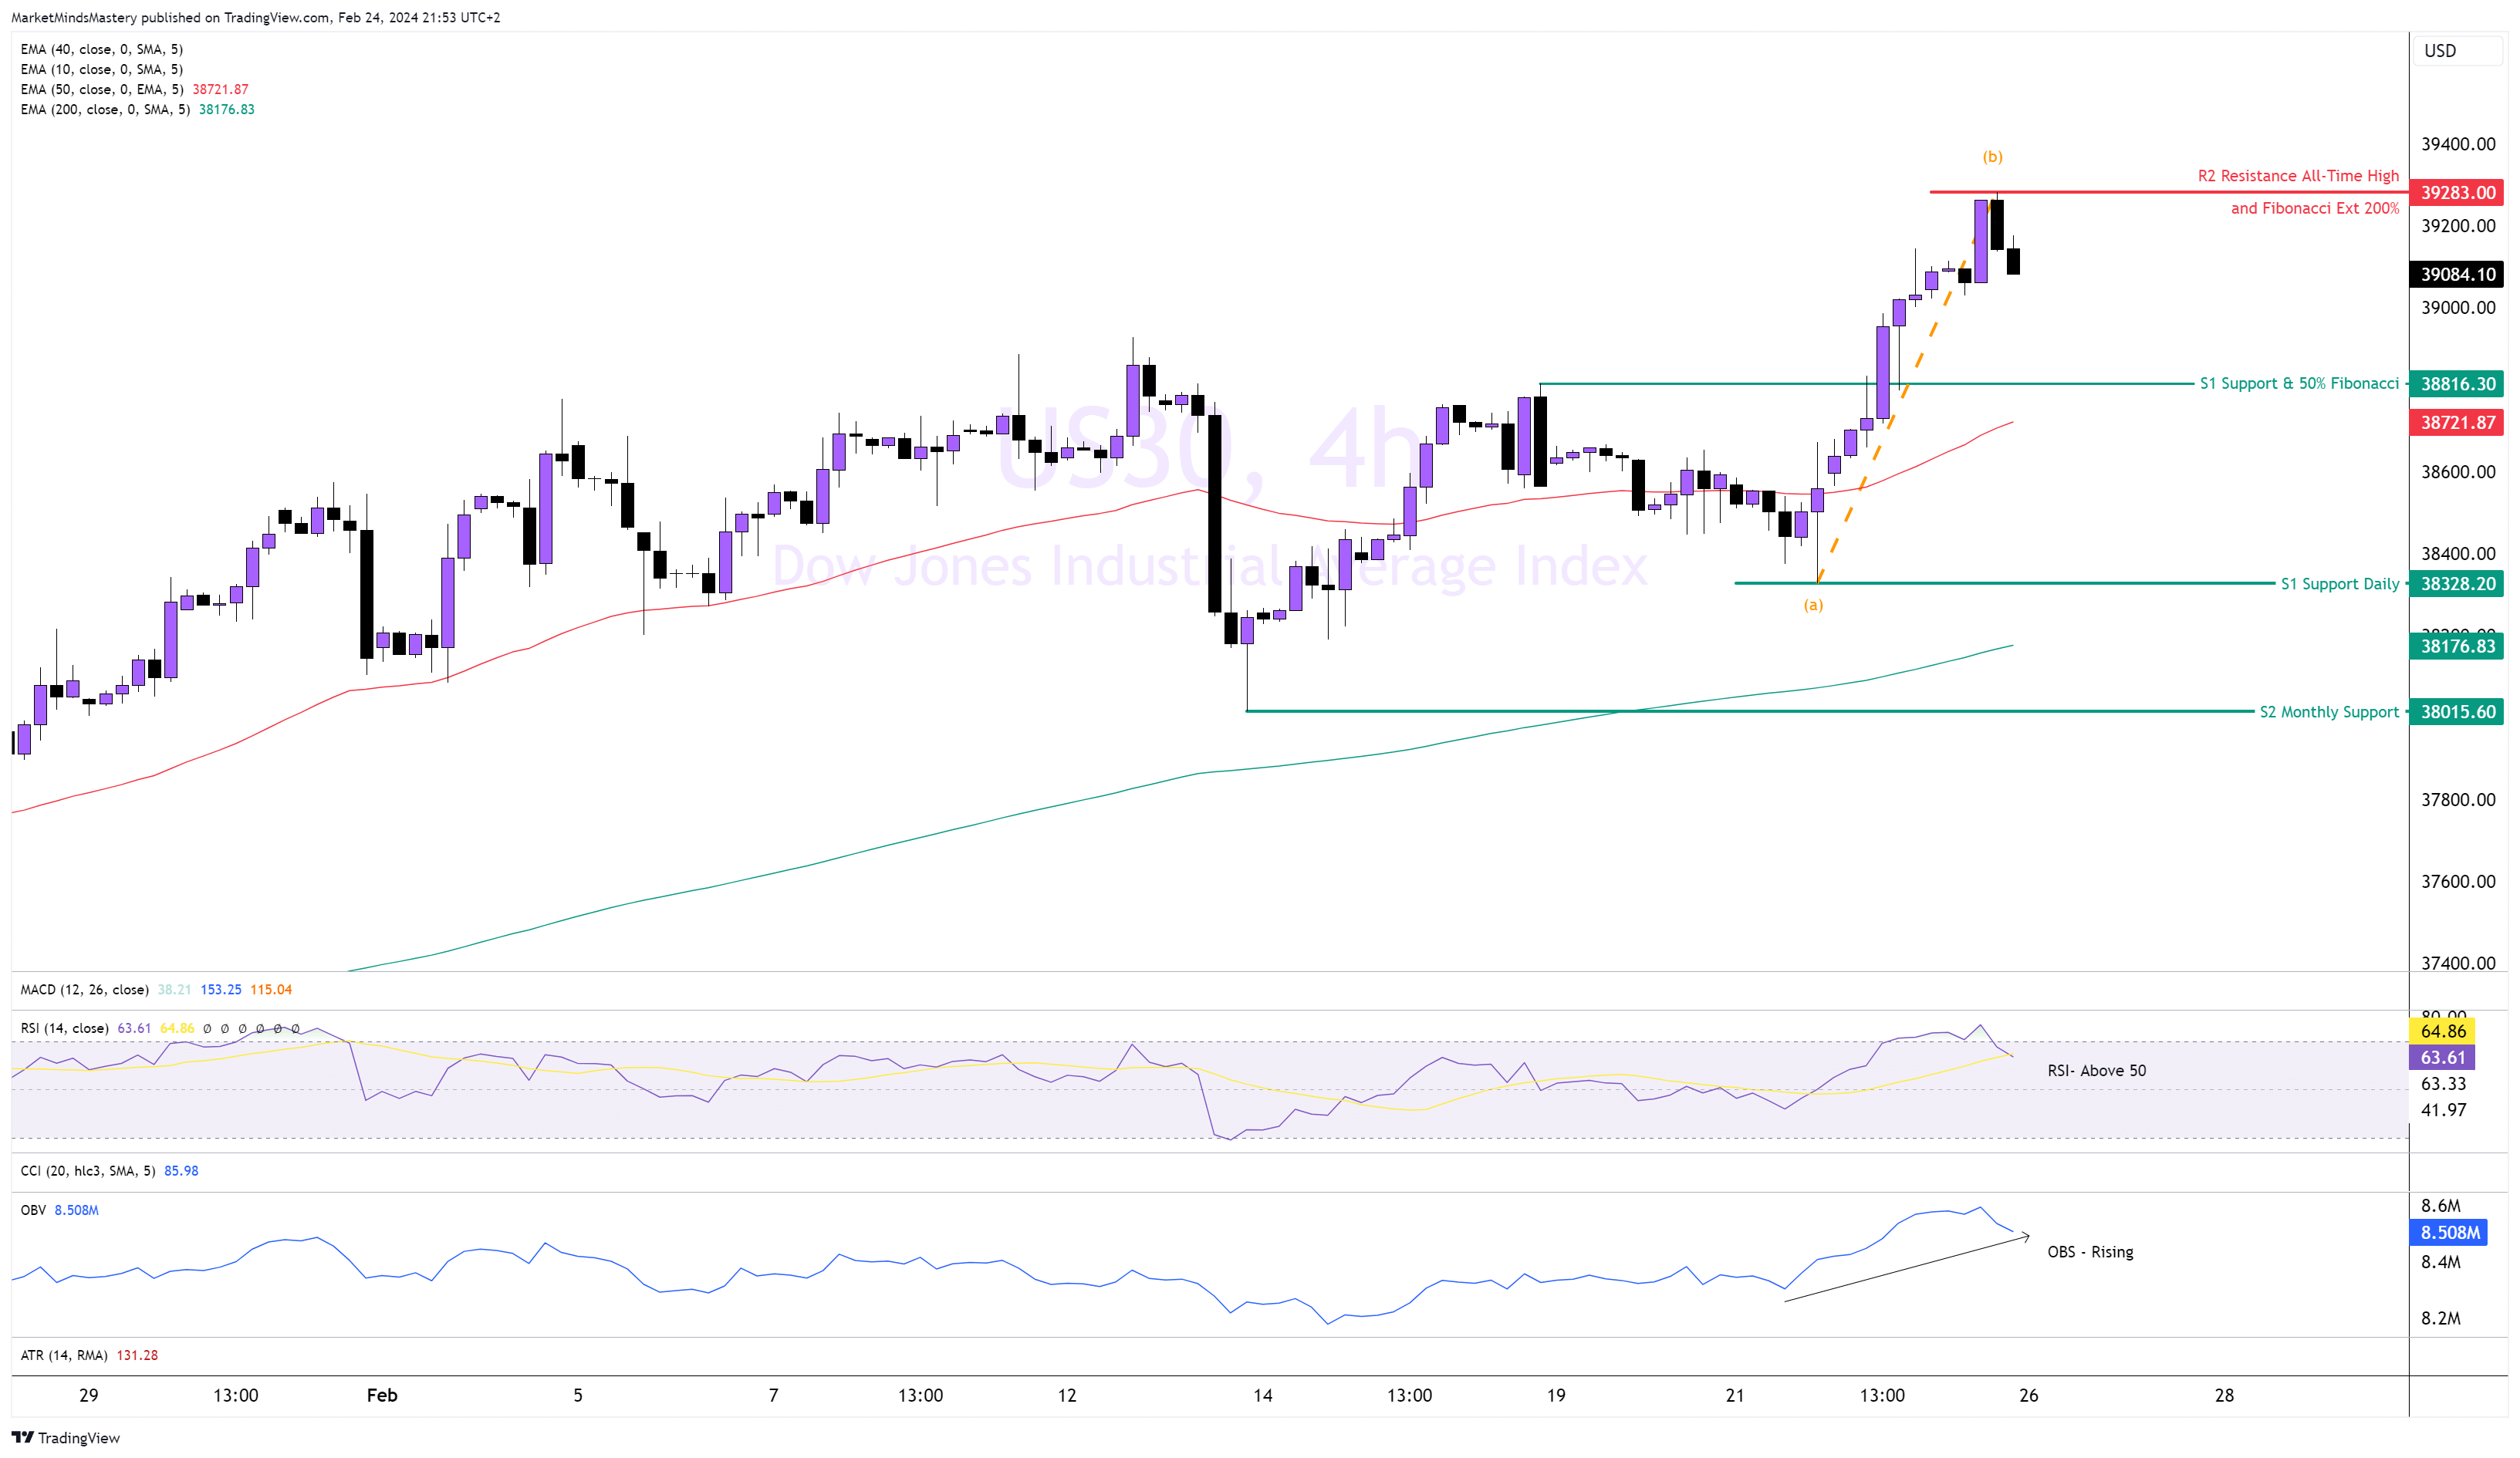
US30, 4H
The price of the US30 has advanced sharply since Wednesday last week. After the FOMC minutes, all the US indices rallied. The price then created a new all-time high, around 39283. The price trades well above the 50-period moving average (red). The 50 and the 200 MA are well apart from each other. The RSI oscillator was overbought, still above 50, and the OBV volume indicator shows a rising line. Therefore, we expect the price to continue upwards, with the first resistance being at an all-time high of around 39283. This is also the estimated target of 200% Fibonacci extension.
A move above it can find the price at an all-time high, and we can use round numbers like 39400, 39500, 39600, etc. On the other hand, if the price declines and moves lower, the first area of support is around 38816, and it is the most recent broken swing high, which also consists of the 50% Fibonacci retracement from point (a) to point (b).
GOLD, 4H
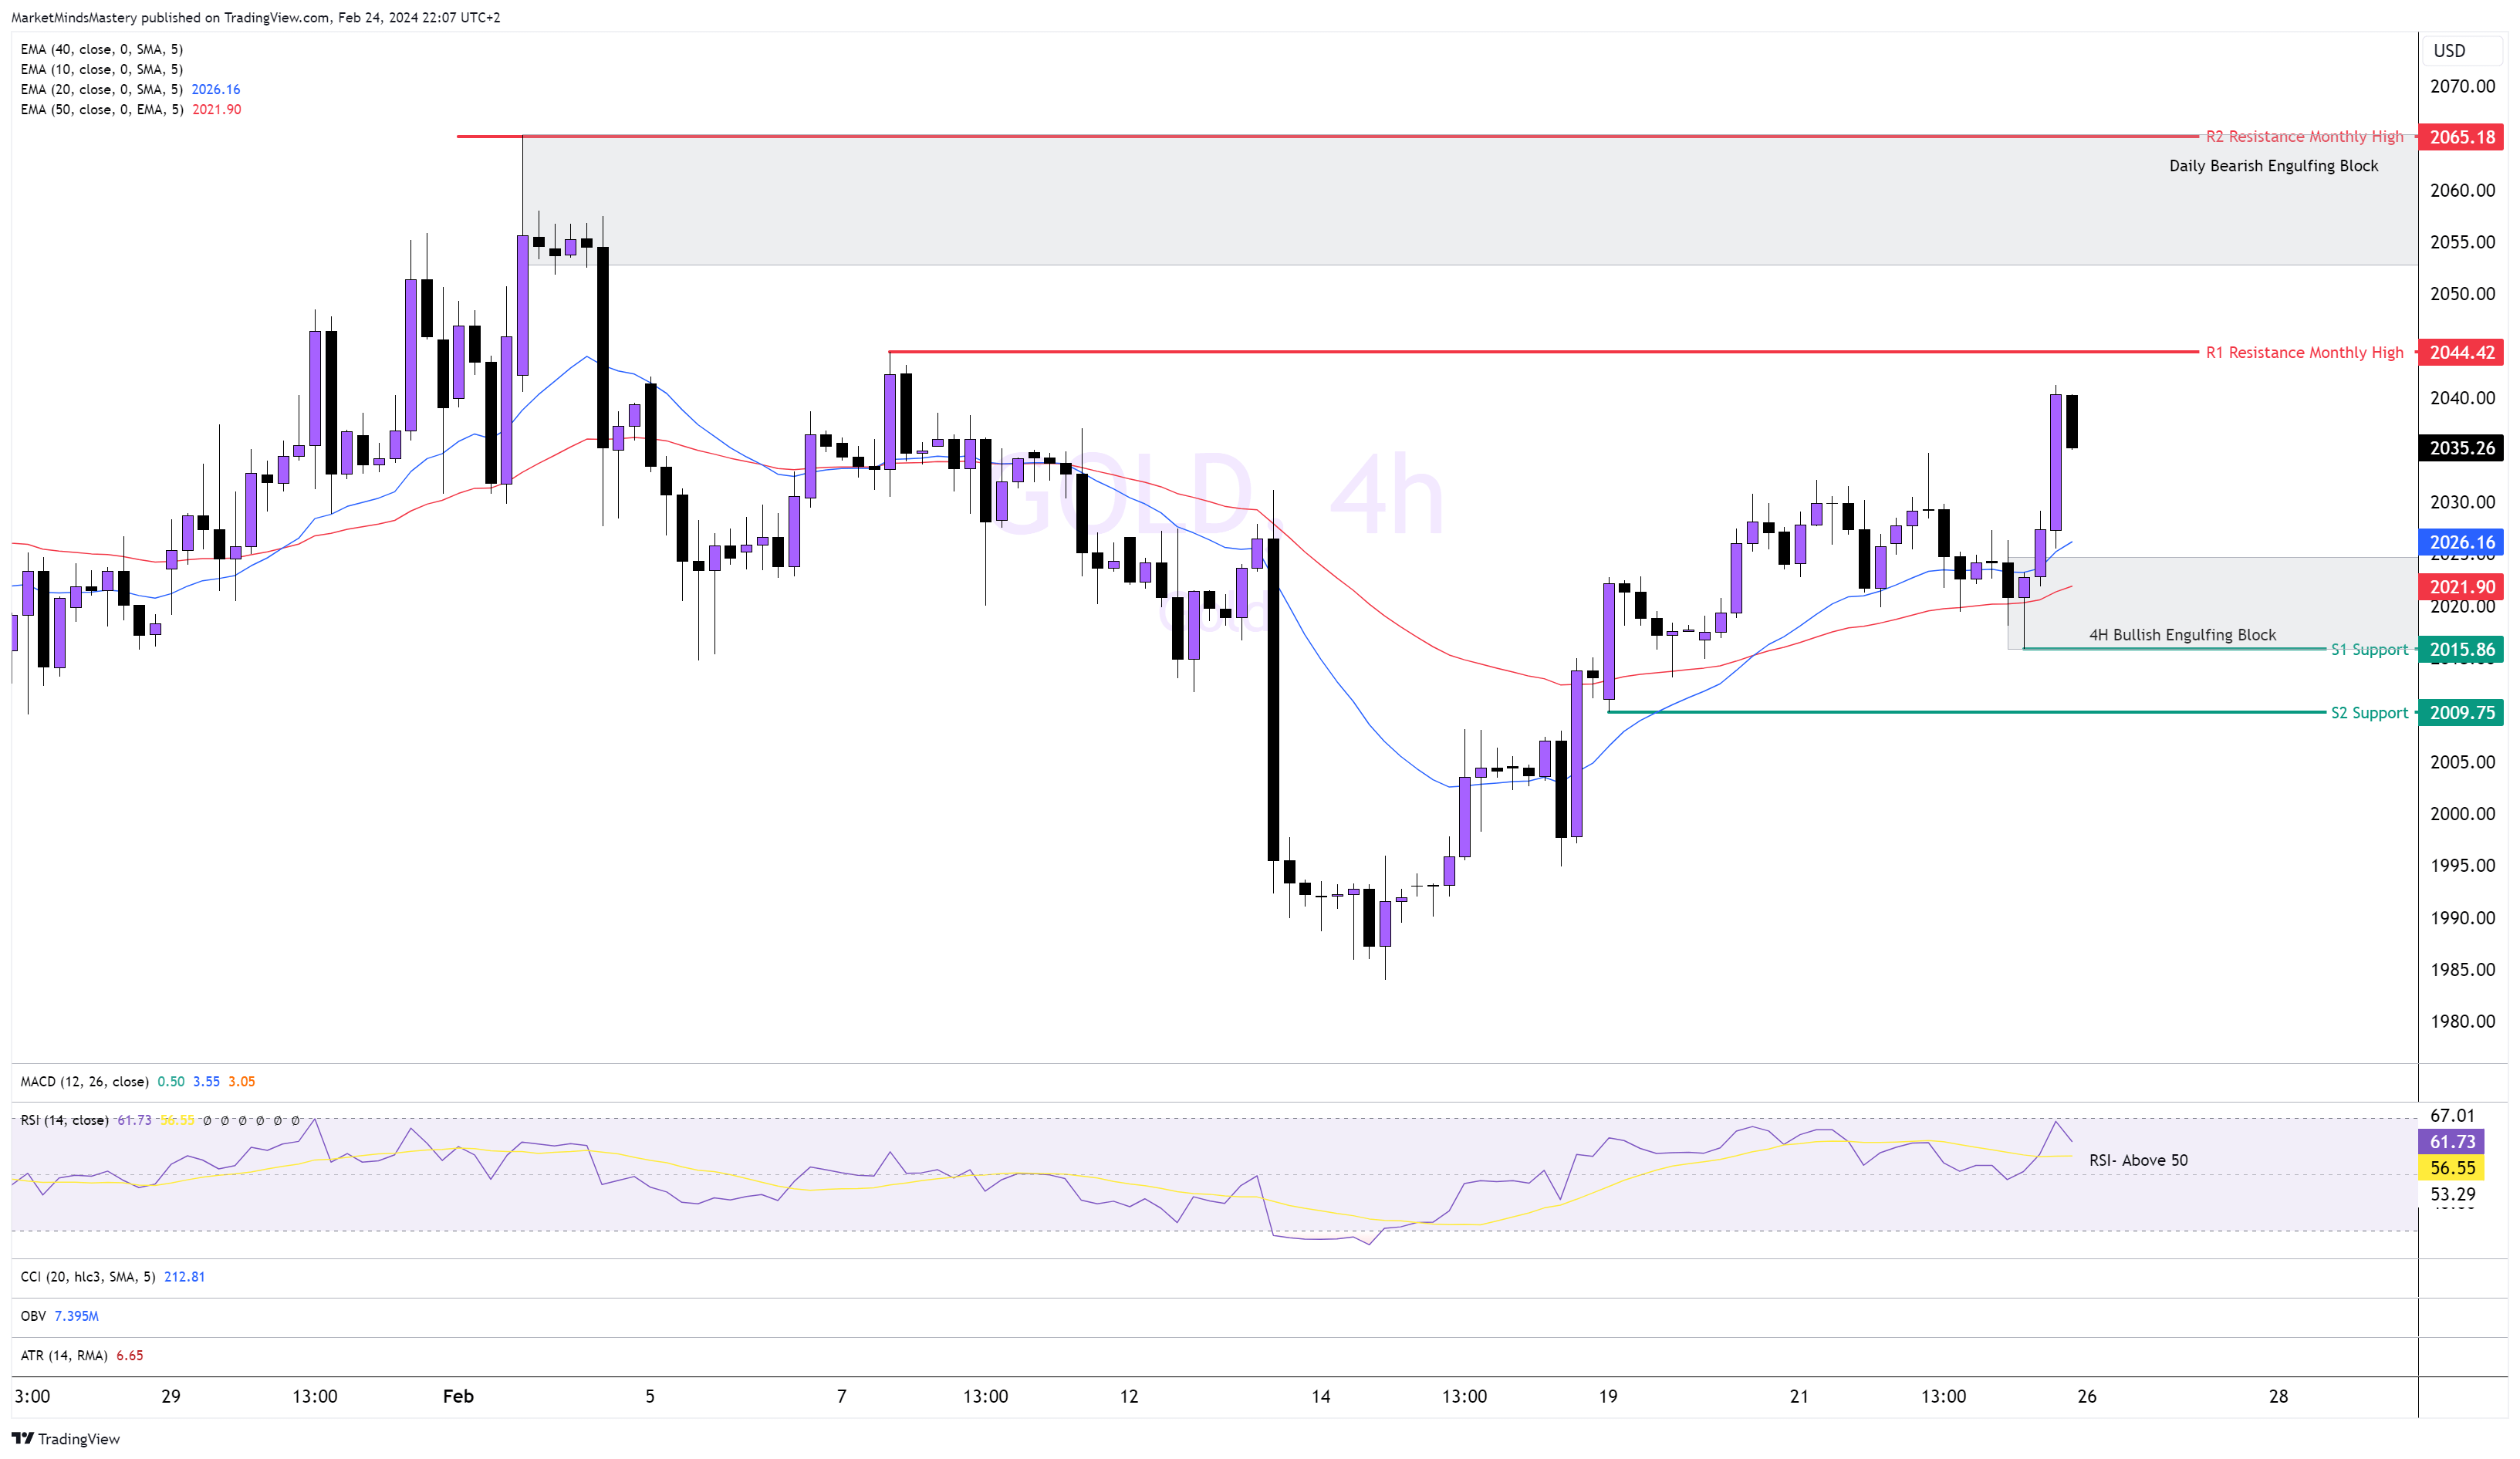
Following the consolidation that occurred last week within the 4-h bearish engulfing block we analysed in the previous report, the price offered tradable price action opportunities as per the candlestick patterns, then it found support around the 50-period moving average (red), created a hammer reversal price action and bounced upwards, creating a new higher high last Friday. Both moving averages are in order, with 20 (blue) above 50(red) indicating a bullish market. The RSI oscillator is above 50, indicating buying pressure on the Gold.
Starting Monday, if the price continues to increase, the first area of resistance, R1, is a monthly high, approximately 2044. If the price penetrates it and moves higher, the next resistance, R2, will also be a monthly high around 2065. Here also rests a Daily bearish block.
On the contrary, if the price declines and moves downwards, the Bullish block founded on the 4-h timeframe rests above the S1 support around the 2015 level. A move below it finds the next support, S2, around the 2009 level.
USOIL, 4H
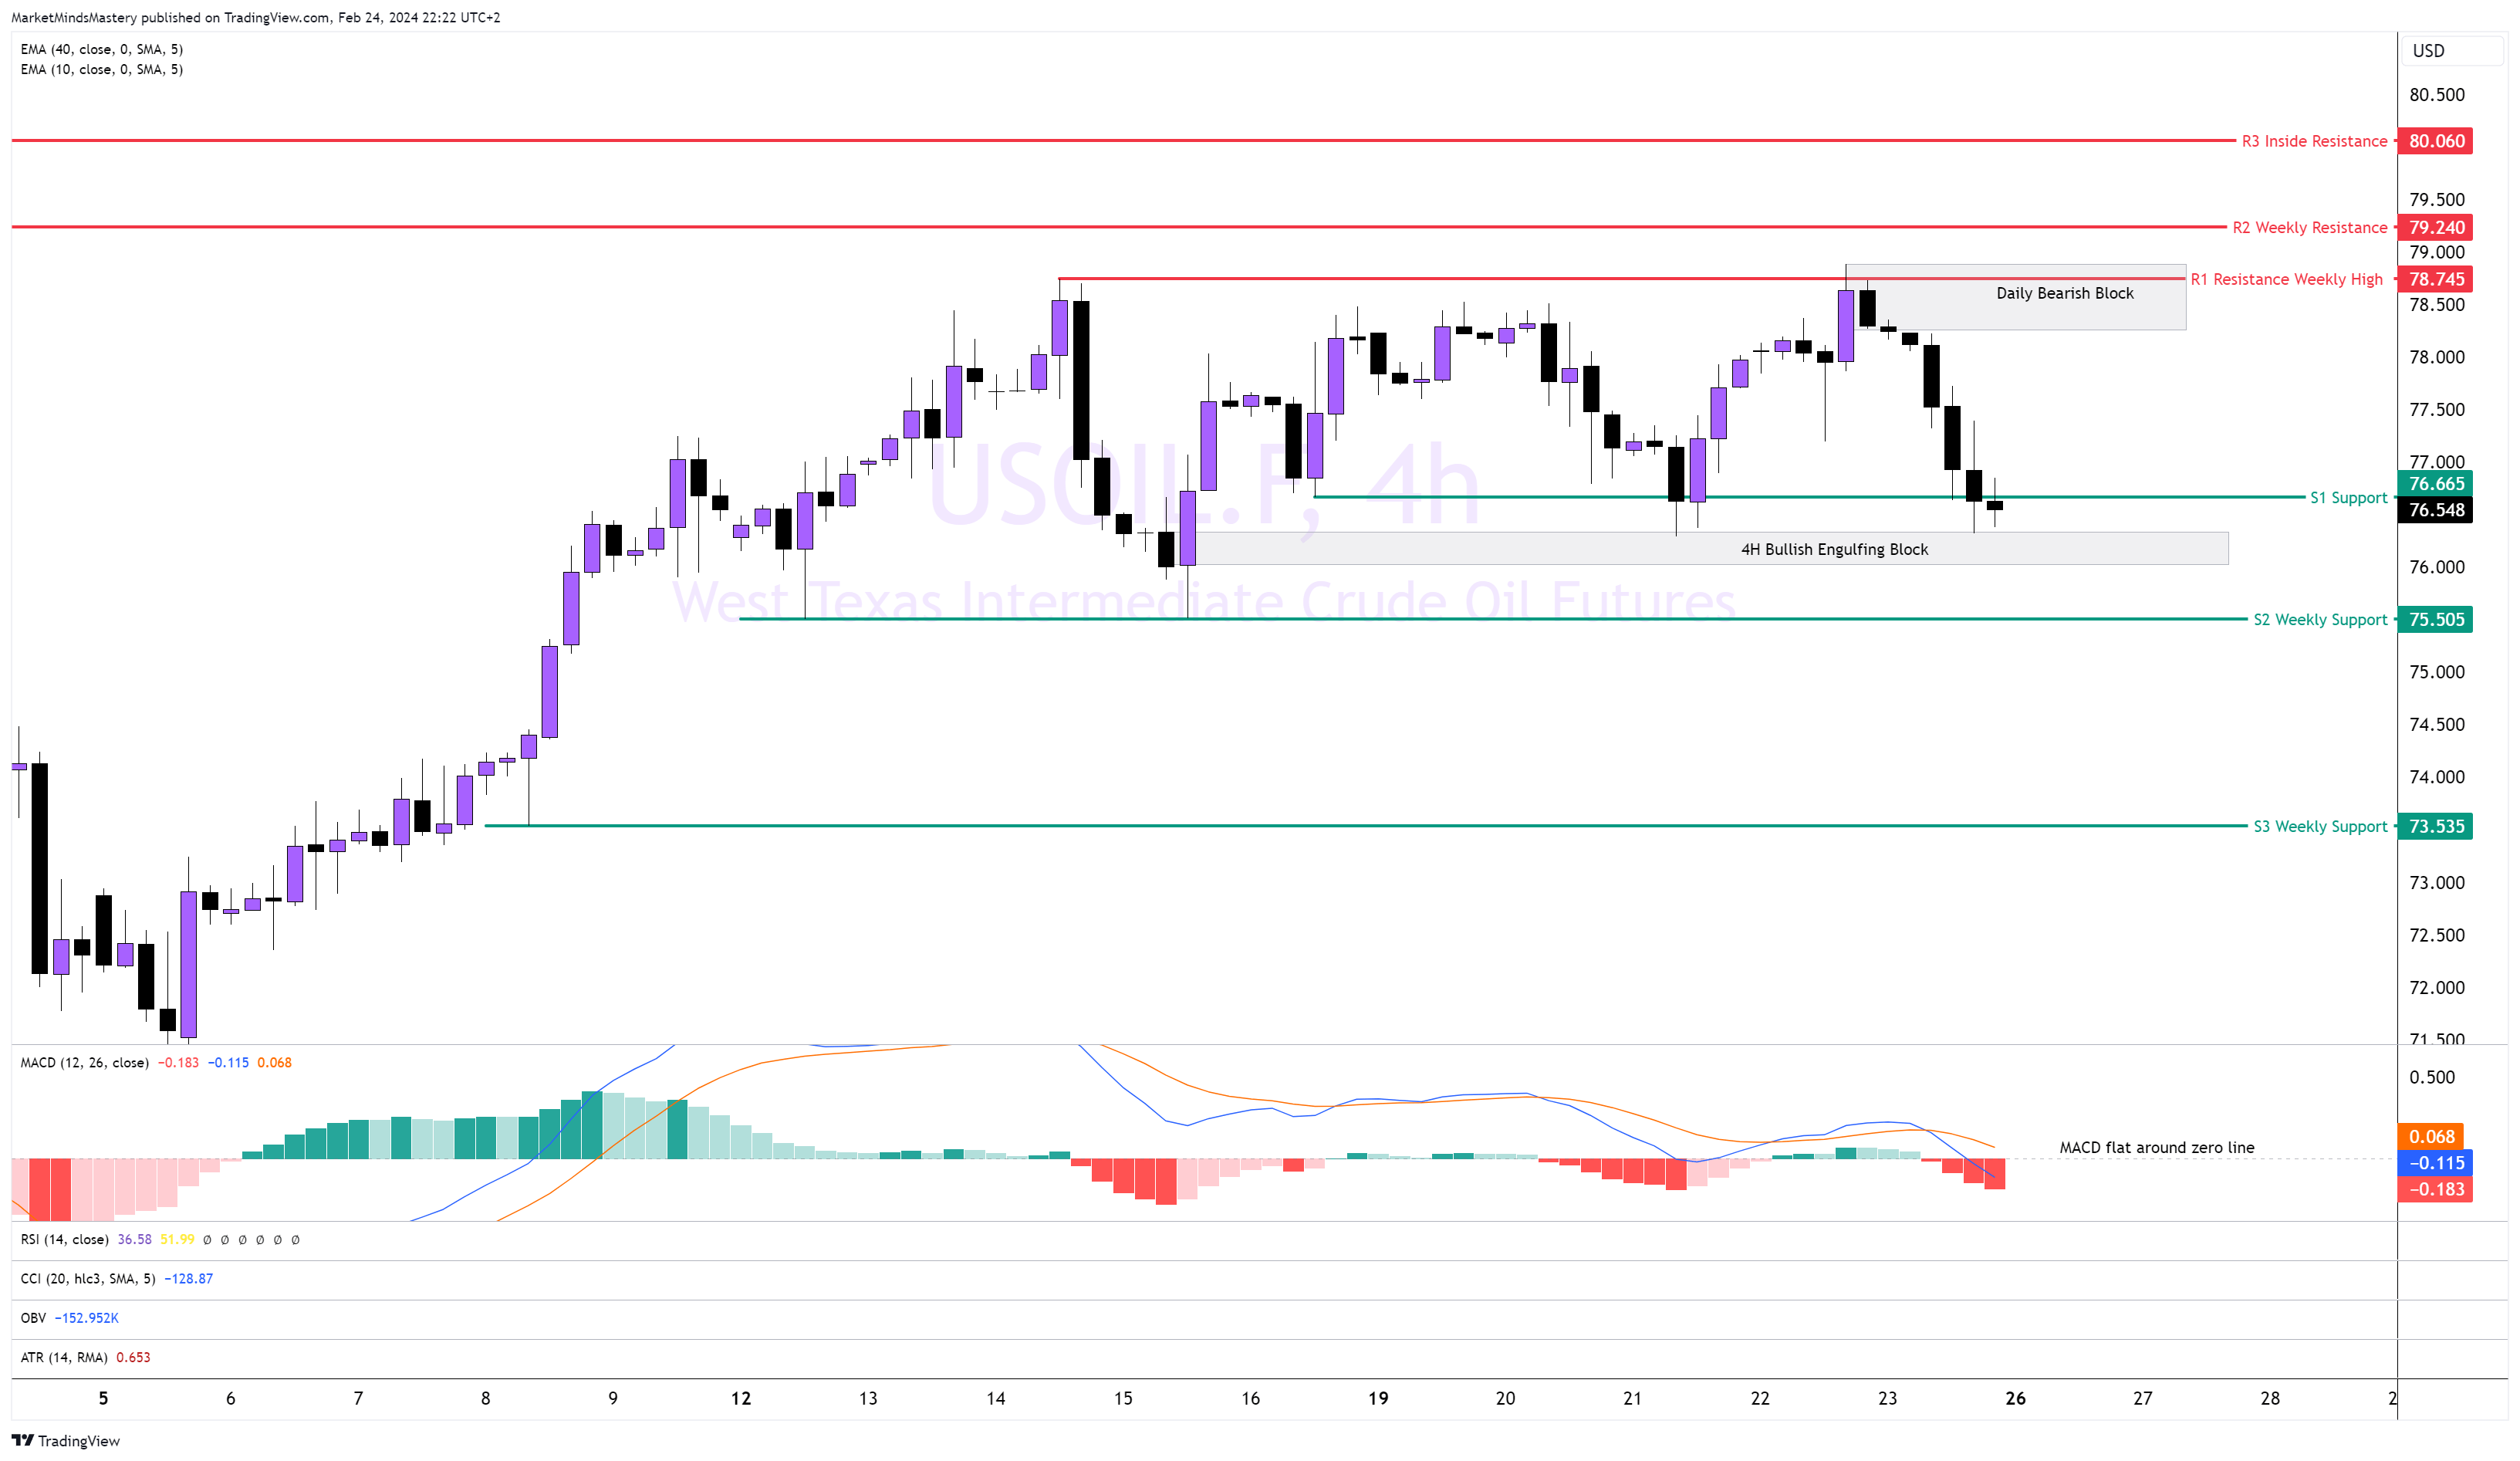
The USOil price moved sideways last week on the 4-h time frame. Last Wednesday, the price entered the 4-h bullish engulfing block around 76.37 and bounced off, moving upwards, retested the resistance around 78.74 and declined, moving downwards back to the bullish engulfing order area.
Currently, the price is trading within a range from the R1 resistance to the S1 support. As expected, the MACD is flat around zero, as the price is directionless.
Therefore, if the price bounces off and moves upwards, the first area of resistance, R1, is the last week’s high, and there, it creates a bearish engulfing block from the Daily chart. If the pierce penetrates it and moves higher, the R2, weekly resistance around 79.24, can cause the price to stop. Now, the price rests around the S1 support, approximately 76.66. If the price penetrates it, closes below it, and surpasses the 4-h Bullish engulfing block, the next support, S2, is approximately 75.50.
BTCUSD, 4H
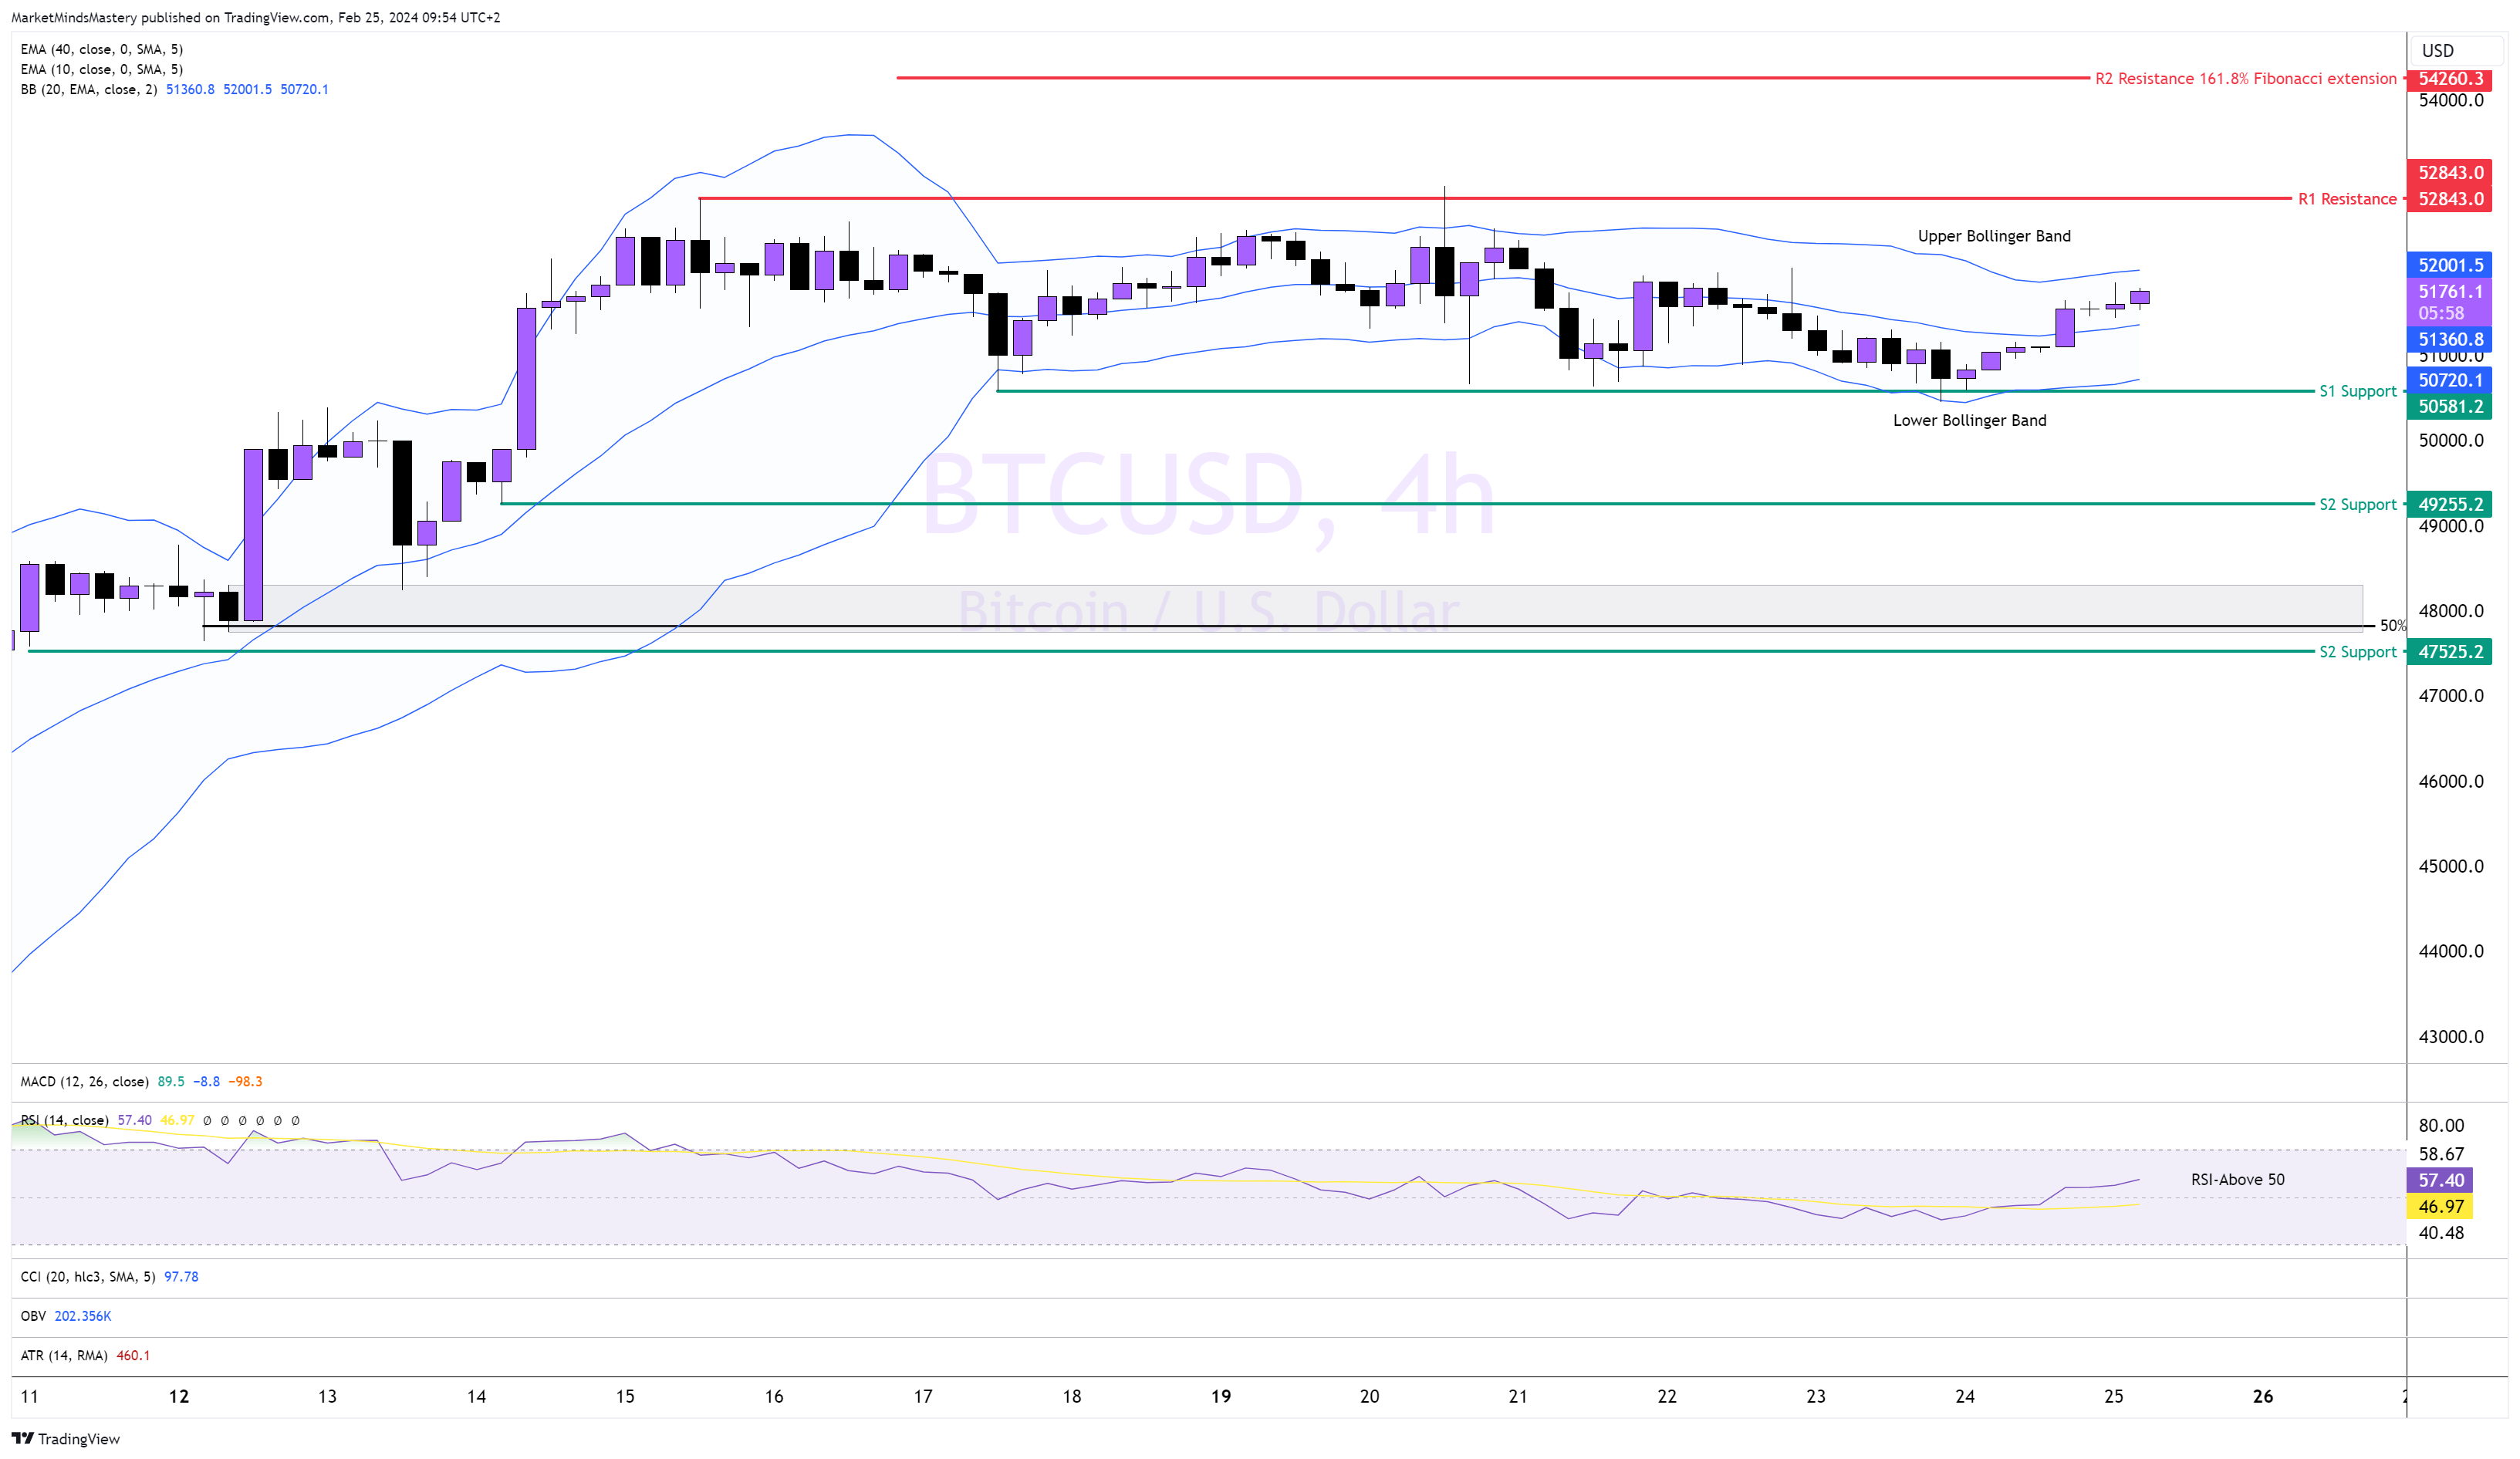
Bitcoin's price stayed around 52.000 last week, and it didn't create a new directional move to the upside due to the price's higher highs and higher lows. Instead, the price entered a sideways range. The price found resistance at the R1 resistance around the 53.843 level to move lower. The Bollinger Upper Band simultaneously rejected the price.
Hence, the price declined and tested a few times the S1 support last week, around 50581. At the same time, the Bollinger Lower Band holds. Price inability to close above the upper band and below the lower band indicated a trendless market. Currently, the RSI is above 50, indicating bullishness. If the price moves upwards, the same R1 resistance around 52843 is the first resistance in the market.
If the price penetrates it and moves beyond it, the R2 resistance is approximately 54260. Conversely, if the price drops, the first support, S1, is around 50582. If the price closes below it and keeps lowering, the next support, S2, is approximately 49255.
👉 Click here to check our Challenges
👉 Don’t miss our Free Live Webinars
👉Join us on Discord
Risk Disclosure:
The Trading Pit offers only demo accounts to all users within the Challenges and Signal Provider Agreements (Scaling Plan). All assets and trading activities are purely virtual. Please note that we do not offer CFD (Contract for Difference) challenges to residents of Canada and the United States. All content and information on this website is for informational purposes only and should not be interpreted as financial advice. Also, remember that results achieved in the past are no guarantee of future results. It is essential to understand the risks associated with trading. If you are unsure, always consult an independent financial advisor.