The Trading Pit Week Ahead Market Outlook (May 06 – May 12)
The previous week was intense and surprising. The Fed decided to keep the interest rates at the currency rate of 5.5%, and they said that inflation is rising, but it is also improving compared to the same period of the year before. Also, the NFP (Non-Farm Payrolls) reported as much less than was given in the forecast, and the USD dropped around 55 pips in the Euro and 66 pips in the Sterling in one minute.
On Monday, the banks will be closed in the UK due to the early May bank holiday. Even though the London Stock Exchange will be closed, the Great British Pound in the Forex Market will be trading, and volatility is expected to rise during the New York trading session.
In Basel, Switzerland's National Bank Chairman, Jordan, will host a speech about the Bank’s project, Halvetia III. The Swissy (short for Swiss Frank) is at a critical support level, and events like this that support innovation in a country like Switzerland can lift the currency.
On Tuesday, the focus will be on the Australian dollar, as the Reserve Bank of Australia will release the new Interest Rates. Currently, the rate in the country is 4.35%. The forecast shows the RBA keeping the same number since November 2023. The Aussie is not at its best performance based on long-term observation, and the stable Interest Rates usually depreciate the currency. The AUDUSD is currently at a resistance level, as seen in the charts below.
Next will be Switzerland’s Unemployment Rate, which currently is at 2.3%. The forecast number hasn’t been provided yet, however, a positive number can cause Swissy to push higher against the USD. The last significant event for the day will be the Retail Sales in the Eurozone. The current number is -0.7% and a positive outcome could positively impact the Euro. For the Euro, this particular event has been seen to attract volatility.
On Wednesday, despite the middle of the trading week, the only significant news event will be the Weekly Crude Oil Stocks. Usually, this event affects the Canadian Dollar and the USOIL as a lower reading number reveals that more barrels are consumed and fewer barrels are held by US firms, which means the demand is greater and usually has bullish implications for crude oil’s prices. Additionally, it is essential to know that this event also impacts the inflation number.
Moving on to Thursday, all the market participants will anxiously wait for the Bank of England to release the news rates in the UK. In a nutshell, 8 out of the 9 members of the Monetary Policy Committee voted, as per the forecast, to keep the rates the same at its current rate of 5.25%. Only one of the members voted for a rate cut. The volatility is expected to pick up around this event therefore, traders must be aware of it. The Monetary Policy will be reported, and only 30 minutes later, the Bank of England’s Governor Bailey will host a speech.
Due to ascension day, the banks will be closed in Switzerland, Germany and France. This means there is no trading activity for the GER30 index.
One hour before London opens, the first quarter's GDP (Gross Domestic Product) number will be reported on Friday in the UK. The current number is -0.3%, and as per the consensus, the GDP of the UK is expected to increase to 0.4%. A positive GDP will favour Sterling’s value, and if the market follows through, the GBP can push higher against the USD. Overall, the market will react to the Interest Rates and GDP outcomes.
Next will be the Unemployment Rate in Canada, which is expected to increase from 6.1% to 6.2%. A rising unemployment rate leads to a weak Canadian dollar because more people claim unemployment. This leads to a lack of economic expansion, one of the Canadian economy's leading indicators.
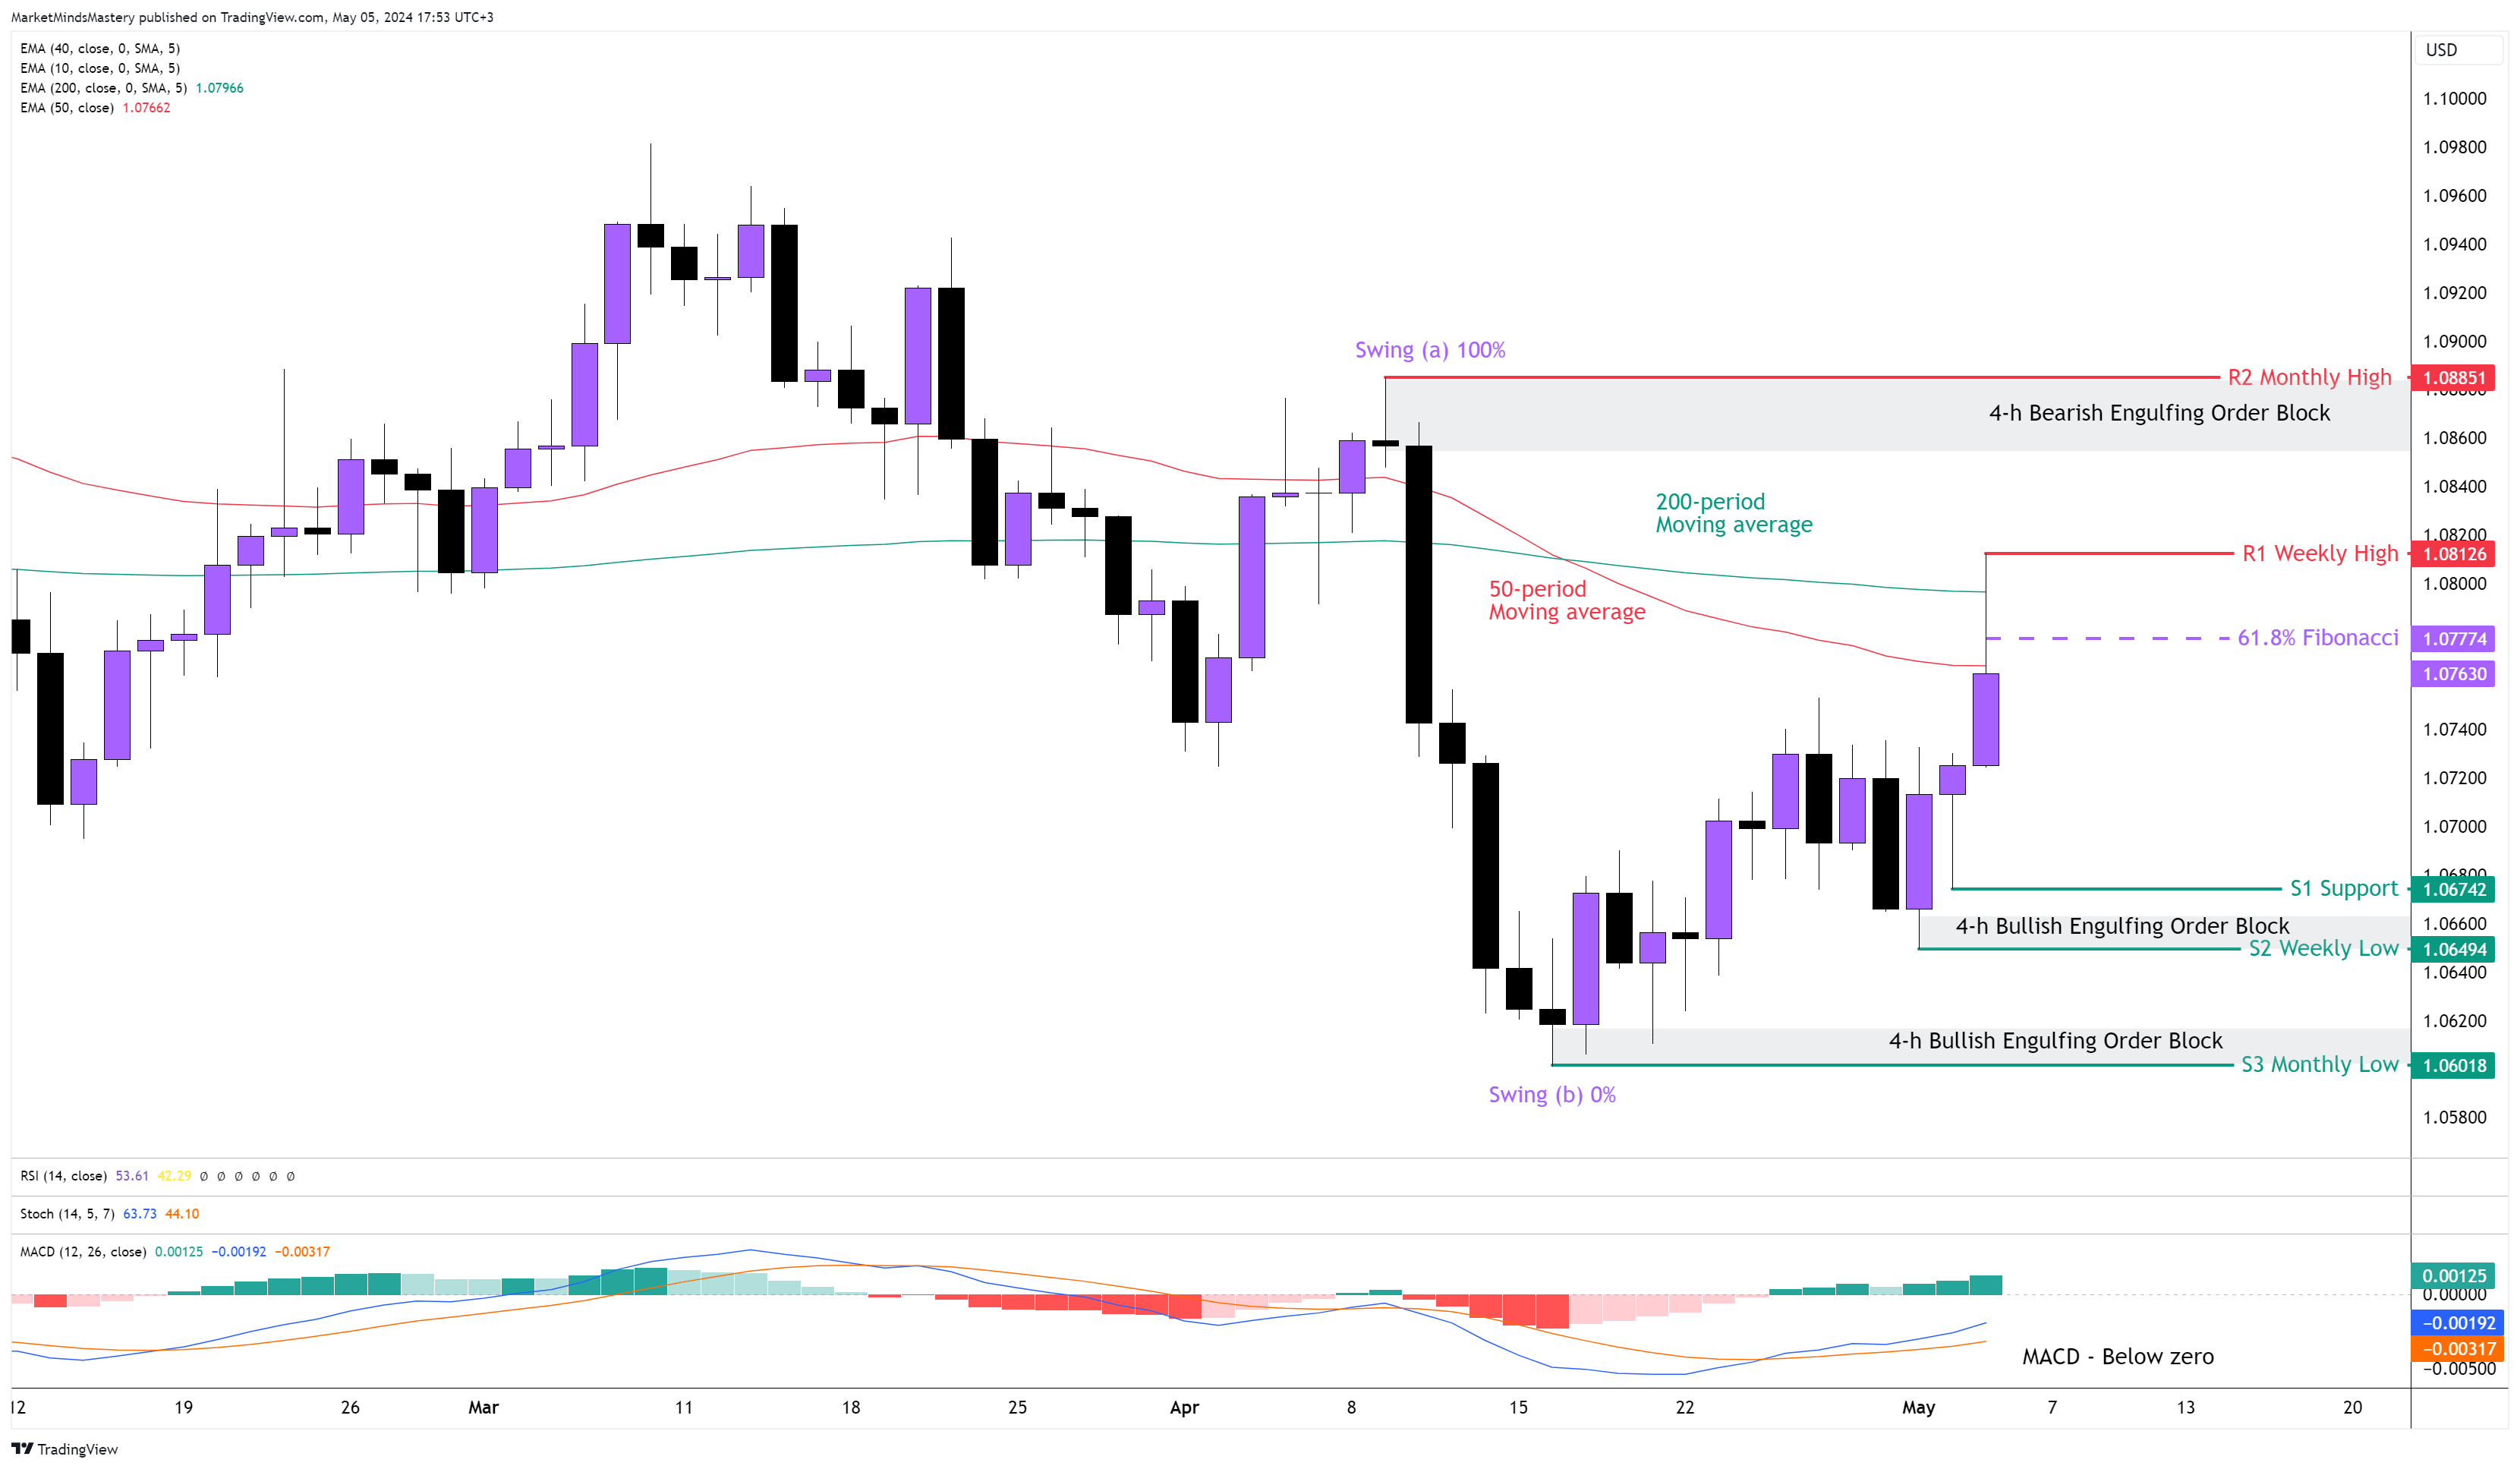
EUR USD, DAILY

The FOMC minutes last Wednesday were enough to send the USD lower and give advance to the EURUSD. During the NPF on Friday, the price broke above the 61.8% Golden Ratio of the Fibonacci numbers, and by the end of the day, the price closed below it. The series of lower highs and lower lows defines the Daily’s chart downtrend. The 50-period being under the 200-period moving average confirms the market’s bearishness. Additionally, the MACD is below the zero line, which is also a bearish indication.
Starting Monday, if the price declines and moves downwards, the first support, S1, is approximately 1.0674. However, the significant support, S2, will be the 1.0649, approximately 23 pips below the S1, with a 4-h Bullish Engulfing Order Block. The 4-hour Order Blocks are significant areas on the charts, as we explain in a previous analysis because an accumulation of buy and sell orders (usually with a form of limit orders) are placed. On the other hand, if the price finds support, bounces off and moves upwards, the first resistance, R1, will be the previous week’s high at 1.0812. If the price surpasses the R1 and moves higher, the next resistance, R2, will be the last month’s high at 1.0885, with a well-defined Bearish Engulfing Order Block.
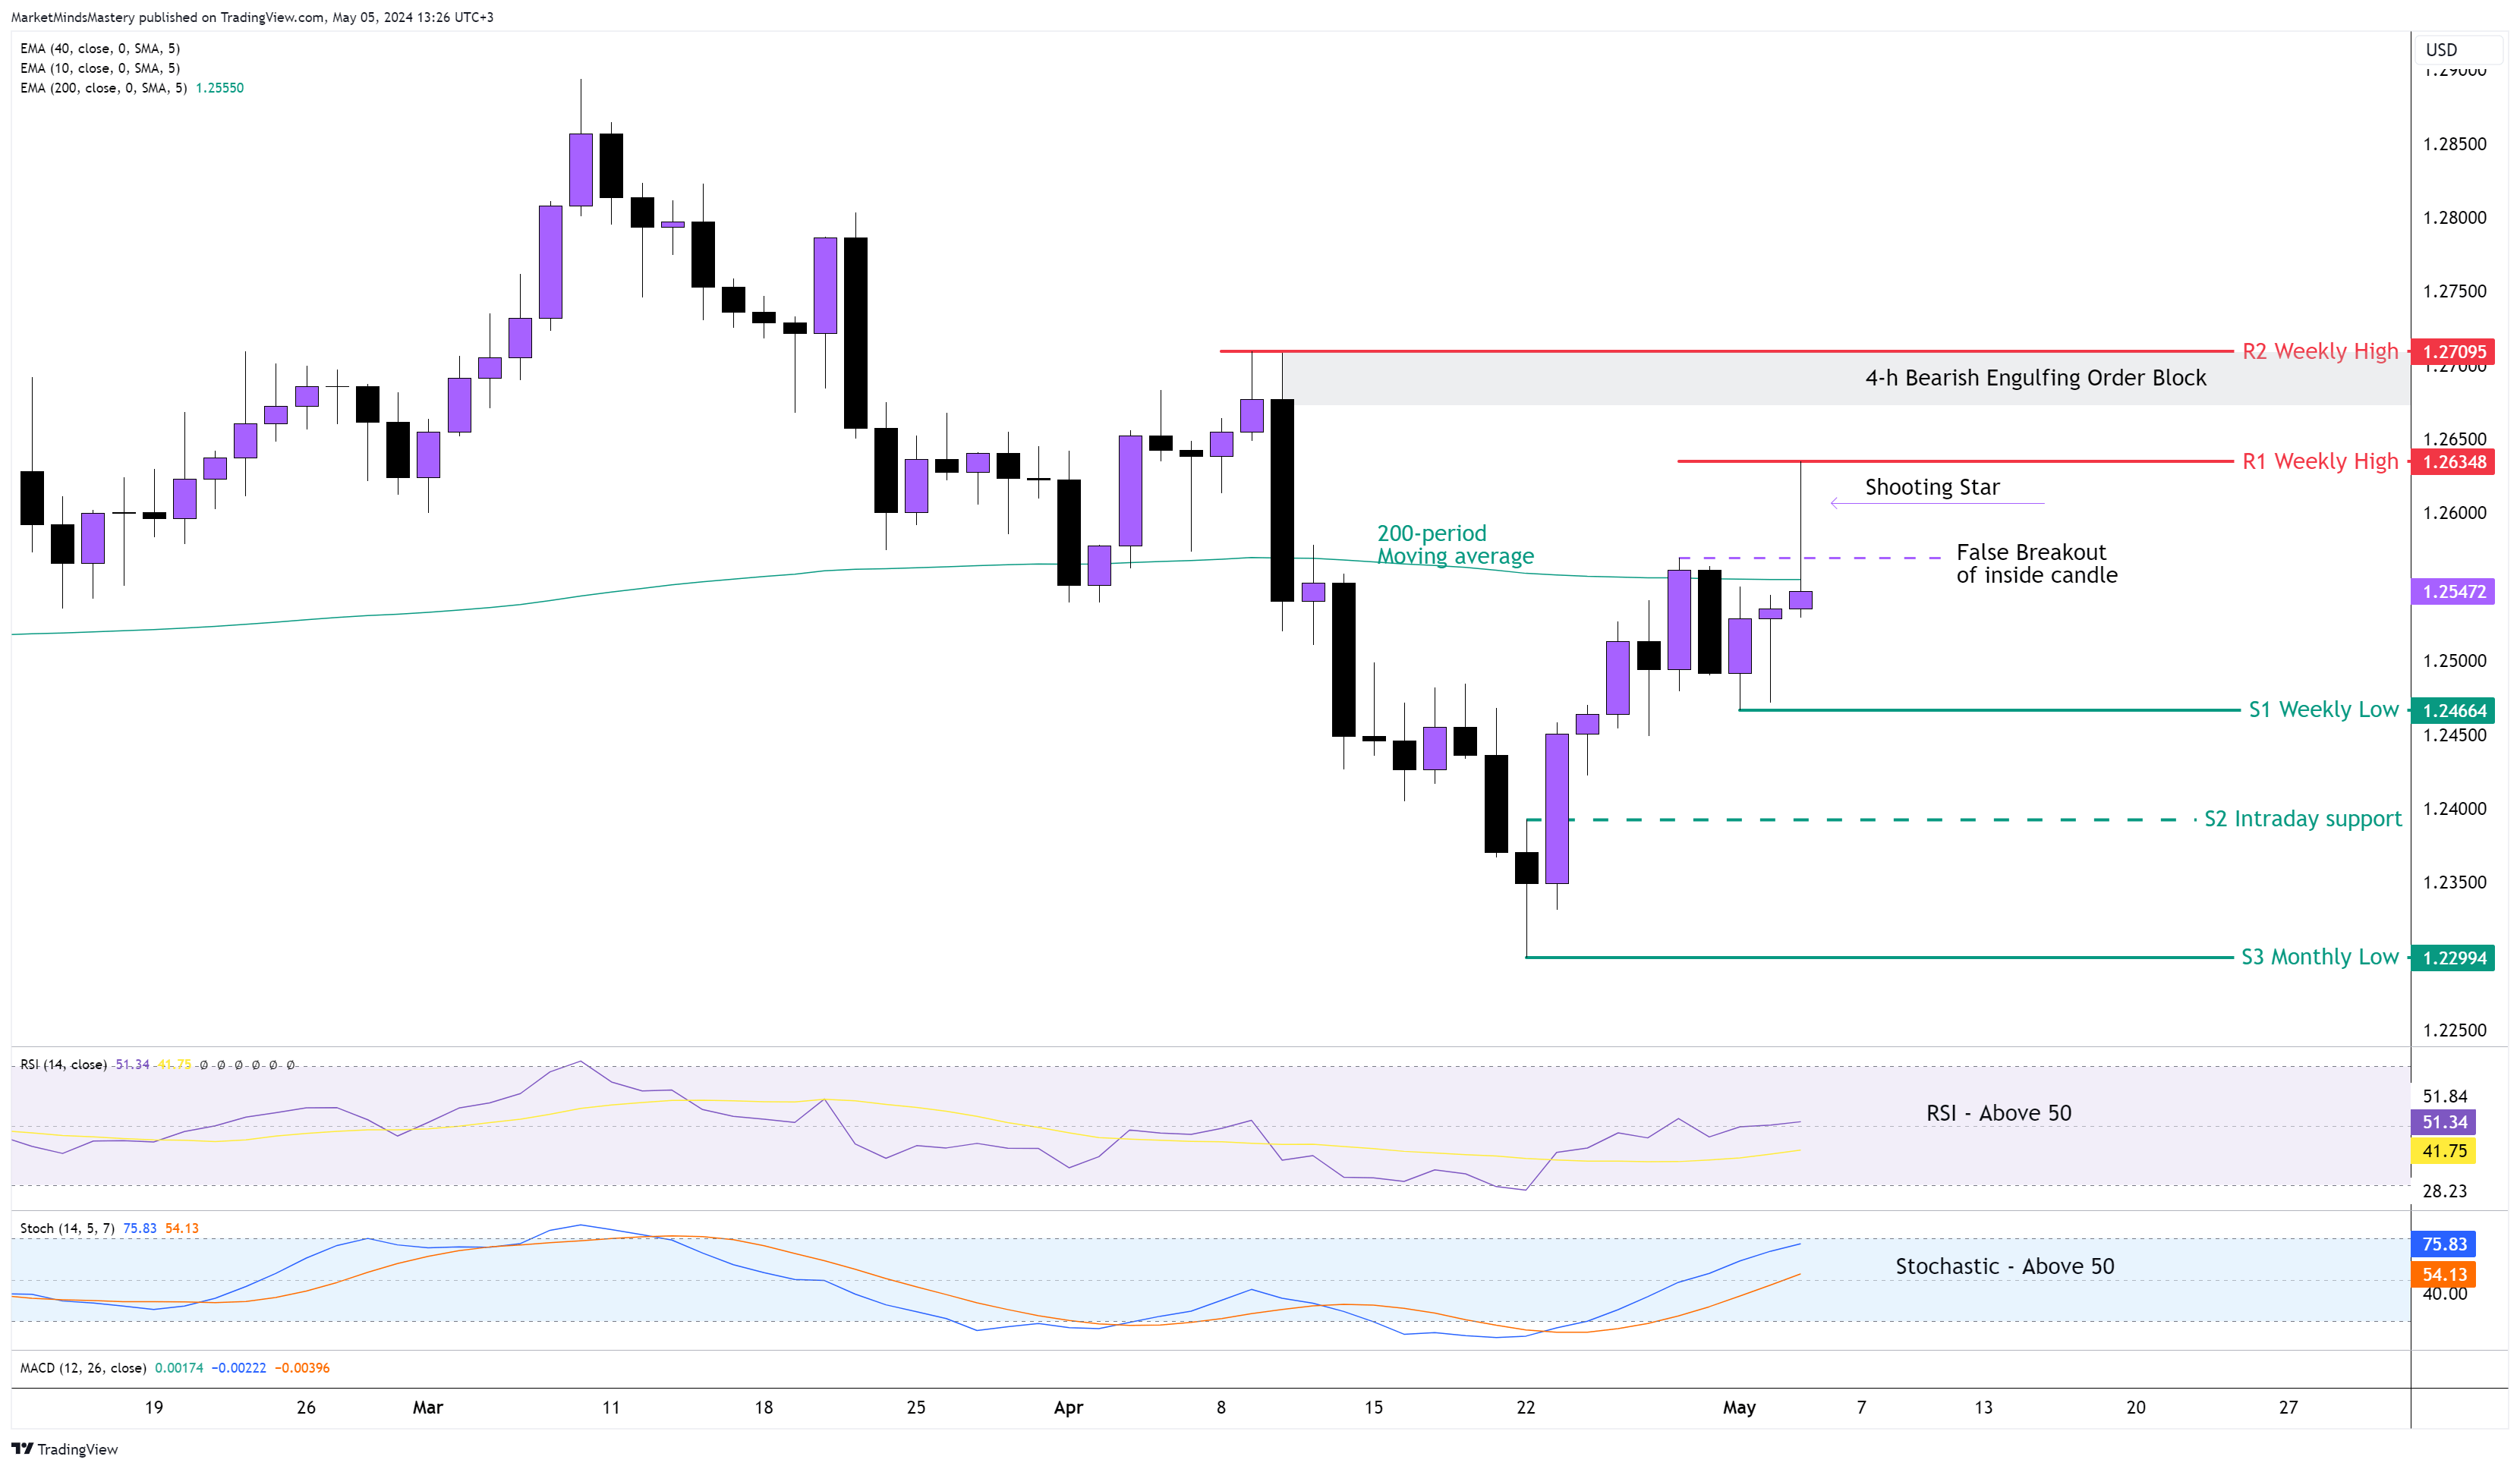
GBP USD DAILY
Last Tuesday, a Bearish inside candle was a prominent price action to lower the price as the price reached a significant resistance level and the trend was down. The market, instead, a few days later, and after the NFP was reported, moved upwards, went for an upside breakout and declined by the 200-period moving average, creating a shooting star reversal. The price makes lower highs and lower lows, indicating bearishness. The price is under the 200-period moving average, which has bearish implications. The RSI and the Stochastic oscillators are both above their middle lines, indicating bullishness, which is normal, as for the last 11 periods, the price has been moving upwards.
If the price declines and moves downwards to resume the primary downtrend, the first significant support area, S1, is the previous week’s low, around 1.24664. If it breaks and closes under the S1, the next support area, S2, is approximately 1.24000. On the other hand, if the price moves upwards, the shooting star’s high, around 1.26348, will be the first resistance area, R1. If the price breaks above R1 and moves upwards, the next resistance, R2, will be around 1.27095. The level is significant as a Bearish Engulfing Order Block is formed.
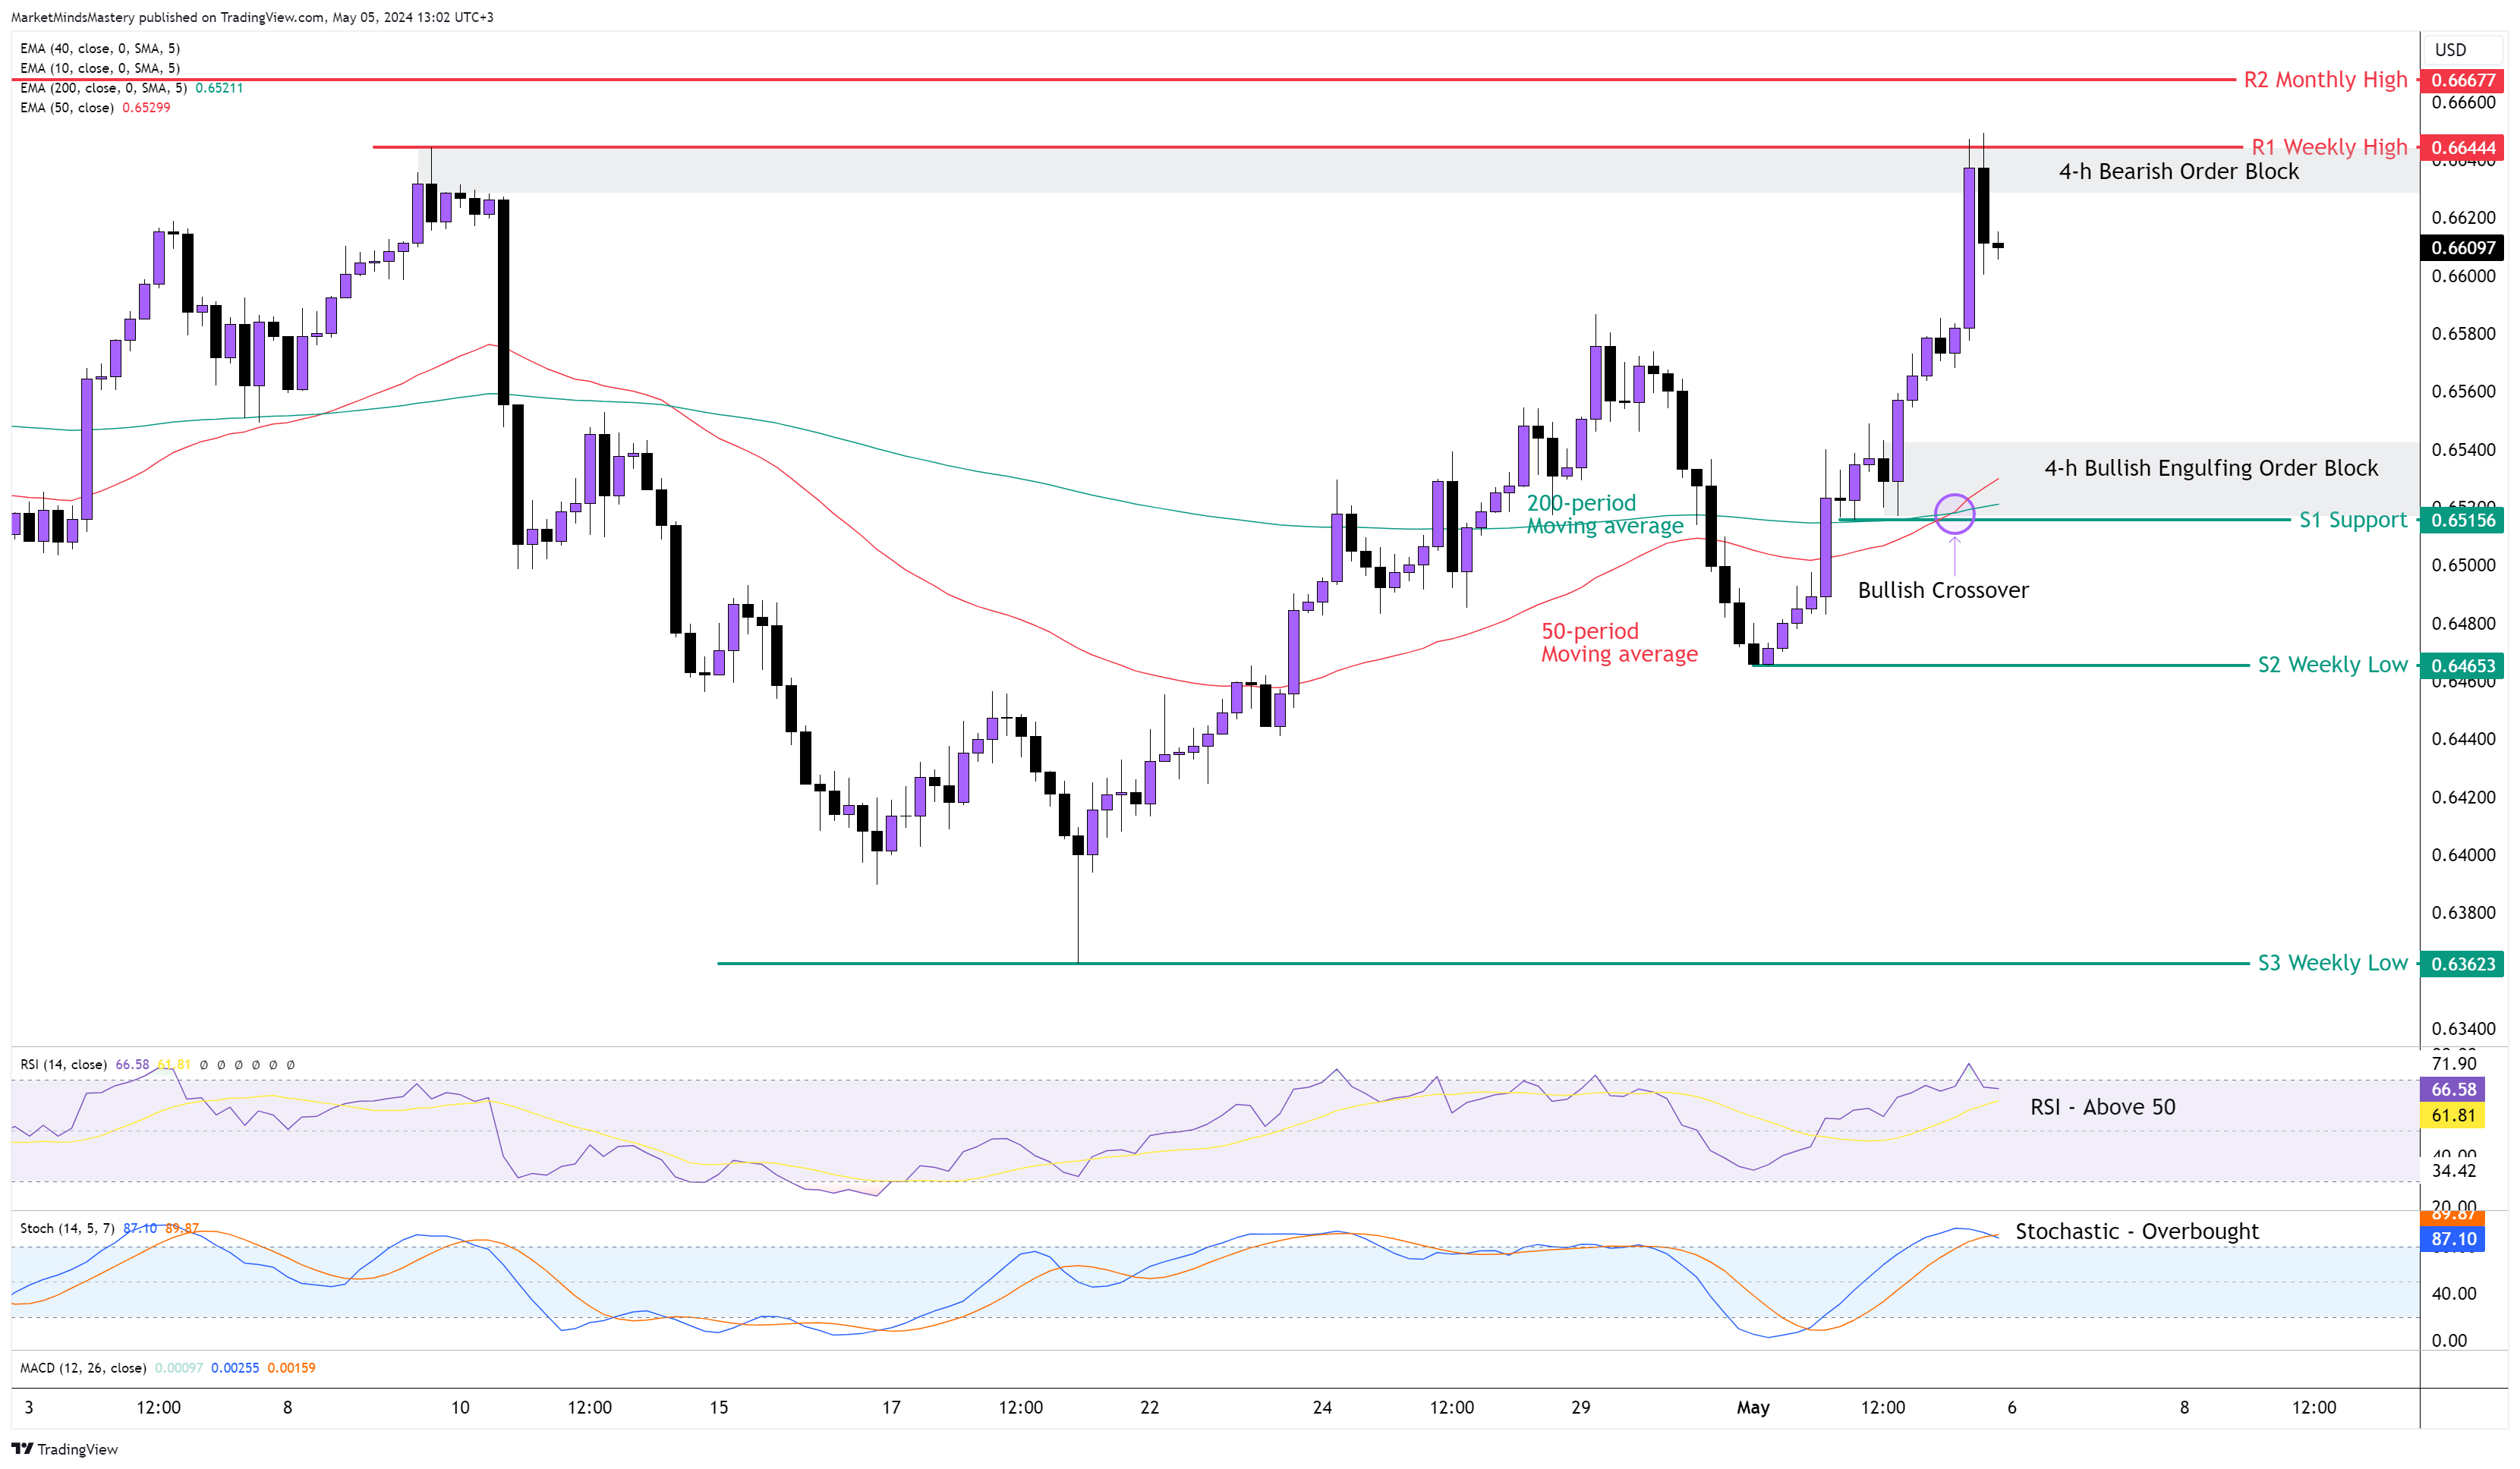
AUD USD 4H
Since the FED announced the interest rates in the US and after the FOMC minutes, the pair traded upwards, with the buy orders being noticeable as the bullish candles formed with long bodies. It is important to mention that on the 4-hour chart, the price didn't retrace any upward moves and went straight to the weekly resistance marked in the previous analysis. Currently, the 50-period crossed above the 200-period moving average indicates bullishness, the Stochastic is in an overbought condition, showing the buying order strength and the RSI is above 50, which is another bullish indication. The price ended in the 4-hour order Block and was rejected.
Starting Monday, if the price keeps trading below the 4-hour Bearish Engulfing Order Block and moves downwards, the Bullish Engulfing Order Block right above the first support, S1, around 0.65156 will be the area of interest as it consists of the 200-period moving average. If the price declines further, the S2 support will be around 0.64653, which is also the previous week’s low. On the other hand, if the price bounces off and moves upwards, the first resistance area, R1, is around 0.66444 (which already holds twice so far), which is the previous week's high. If the price breaks above the R1 and increases, it will lead to the next resistance level, R2, at a monthly high of around 0.66677.
USD JPY 4H
The noticeable weakness of the Japanese Yen we noticed in the previous analysis ended on Monday when the markets opened. The Bearish Engulfing candle at the Asian trading session signalled the start of the Yen’s recovery (the price in a single 4-hour candle dropped by around 550 pips). Also, on Wednesday, after the Interest rates and the FOMC in the US, the price dropped by approximately 400 pips. The MACD is under the zero line, which indicates bearishness. The RSI is below the midpoint of 50, which also has bearish implications. The 20-period crossed below the 50-period moving average indicates selling pressure, and the price trades around the lower band. We observe that the upper band points horizontally, which indicates a lack of bearish momentum. If the price keeps moving downwards, the first support area, S1, will be the previous week’s low (if the trading timeframe is lower than the 4-hour chart). If the price breaks and closes below the S1, the next support area, S2, is approximately 150.26. A close below this price level will signal the end of the current major uptrend.
On the other hand, if the price bounces off and moves upwards, the first static resistance, R1, is the recent swing high of around 156.288. If the price closes above it and keeps increasing, the next area of resistance, R2, is around 158. At this level, a 4-hour Bearish Engulfing Order Block formed, which hasn’t been tested yet.
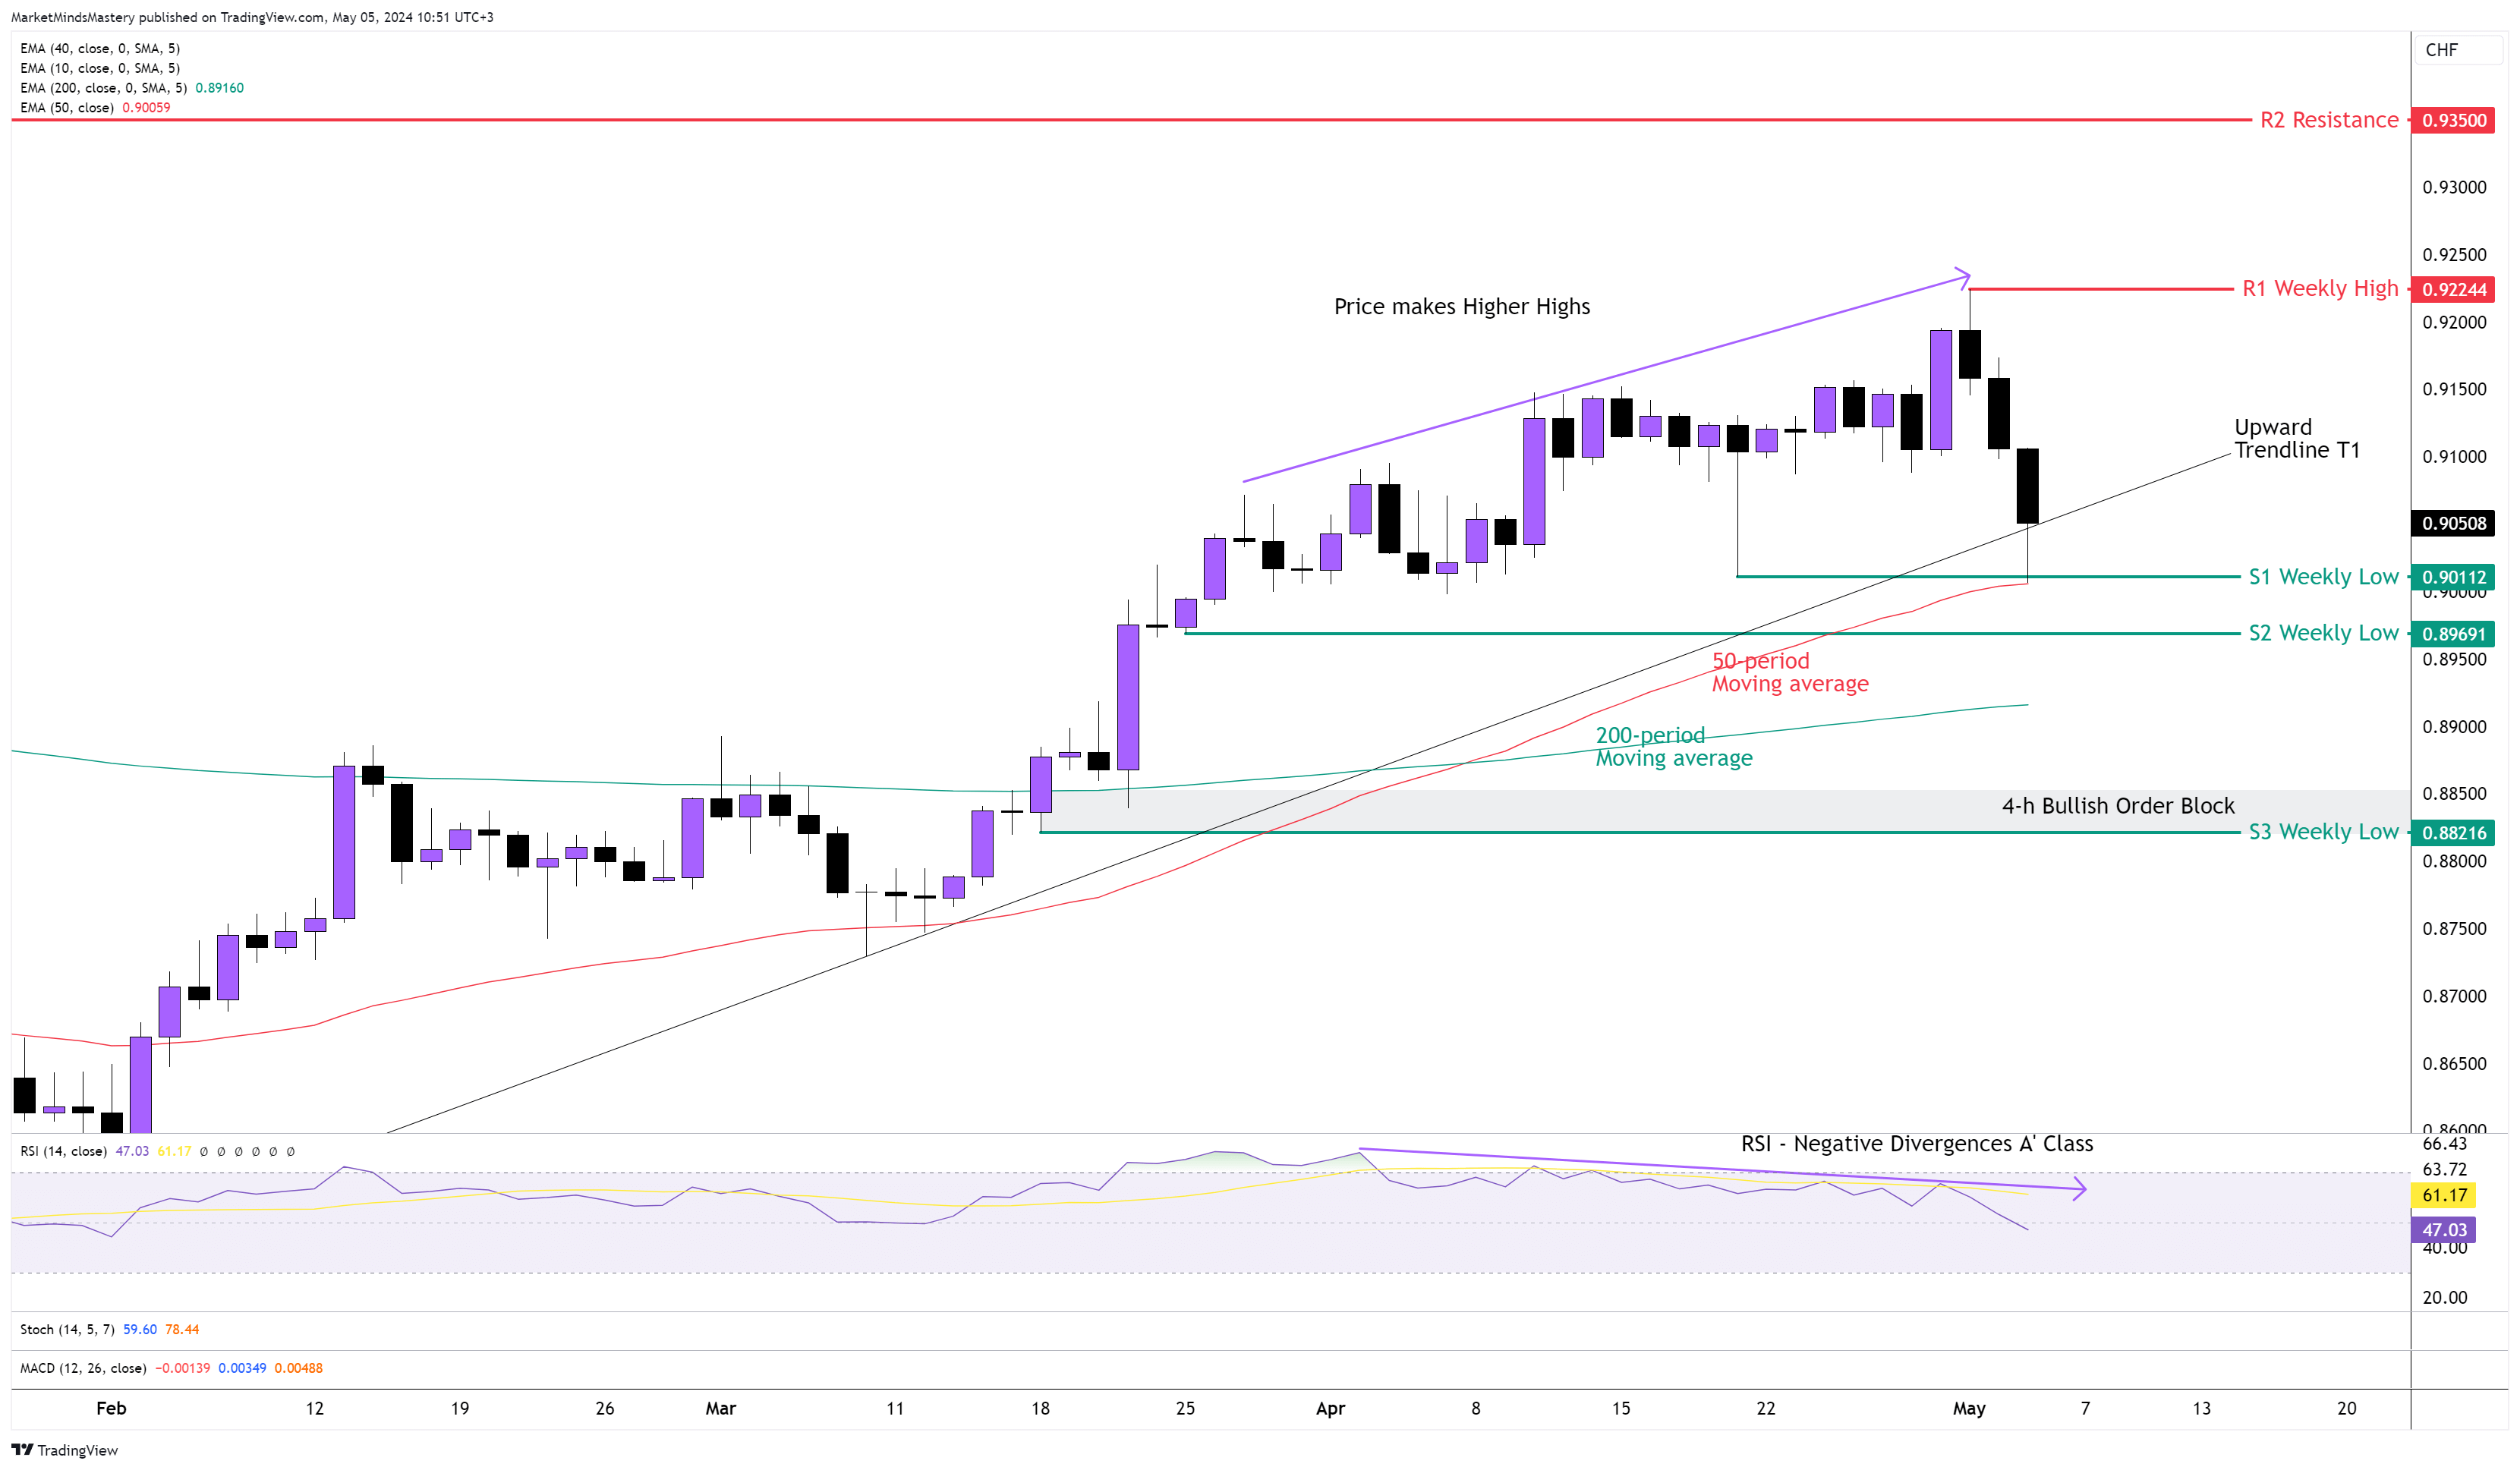
USD CHF 4H
A well-defined Bearish Engulfing candle marked the end of the previous week’s trading. In an attempt to resume the upward move on the Daily chart, the price was rejected by an old resistance around the 0.9200 level. This fueled the Negative Divergences on the RSI, as the oscillator could not follow the price, registering a higher high.
The 50-period is above the 200-period moving average, which has bullish implications. Also, the price makes higher highs and higher low formation, which also have a bullish impact. Additionally, the price rejected the Upward Trendline. The price is currently being retraced back to the 50-period moving average.
Starting Monday, if the price closes below the T1 trendline and the 50-period moving average, it will likely penetrate the S1 support around 0.9011. If it declines further, the S2 support is only 40 pips below. A penetration and a close under the S2 will end the uptrend. Until that happens, the market has bullish implications. Conversely, if the price stays in an uptrend, the first resistance, R1, is the area around 0.92244, which was the previous week’s highest price level. If it penetrates the R1, closes above it, and keeps increasing, the next resistance area, R2, will be 0.93500, attracting the trader’s attention.
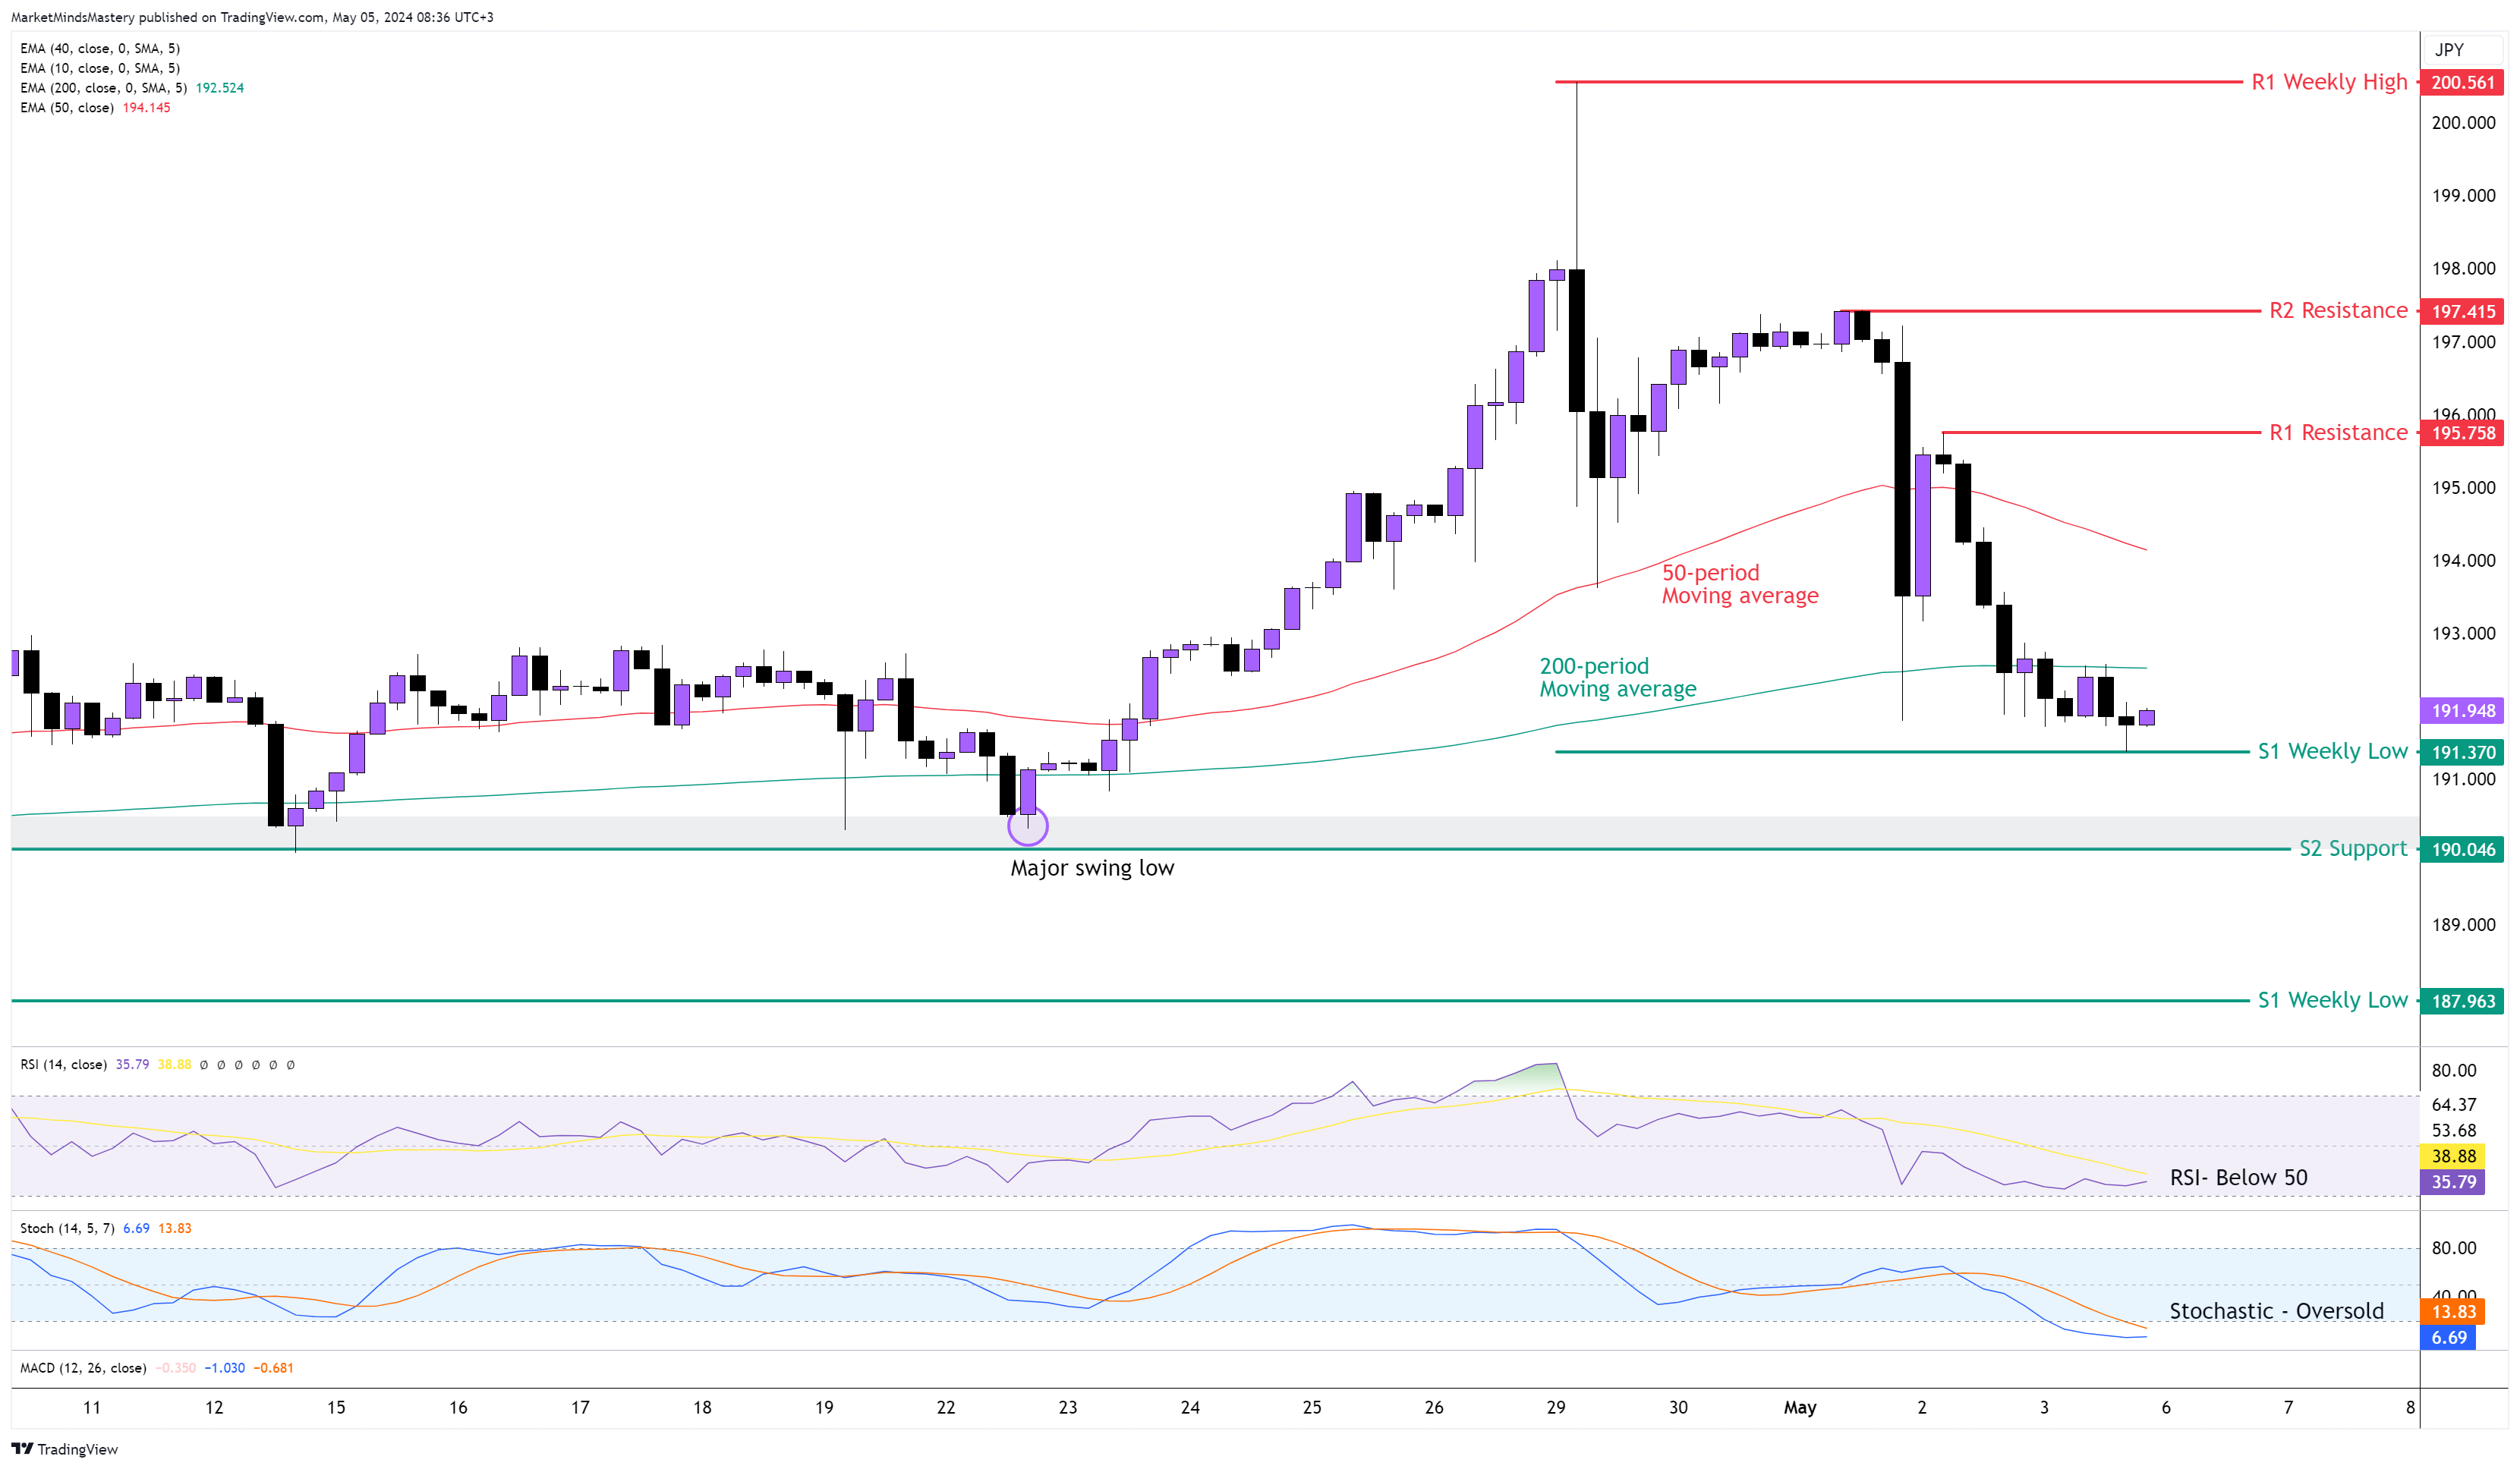
GBP JPY 4H
Following the price spike two weeks ago and the price reached the 200 level last week, the price retraced almost 100%, with an unusual 900 pips move. On the 4-hour chart, the price created a lower high and lower low formation without breaking the major swing low around the 190 level. The RSI oscillator is under 50, and the Stochastic is Oversold, which both have bearish implications. The lagging moving averages point upward, with the 50-period remaining above the 200-period. Last week, the price closed almost at the weekly low. Therefore, if the price continues to move downwards, the previous week’s low of around 191.36 will be the first support, S1. If the price penetrates the S1 and moves lower, the next support area will be the S2, around 190. This price area is critical because it will determine if the primary trend will become invalid.
On the other hand, if the price moves upwards, the R1 resistance is around 195.75. If the price keeps increasing, the next resistance, R2, is around 197.41. A break above the R2 will lead the price to the R3 resistance, approximately at the 200 level.
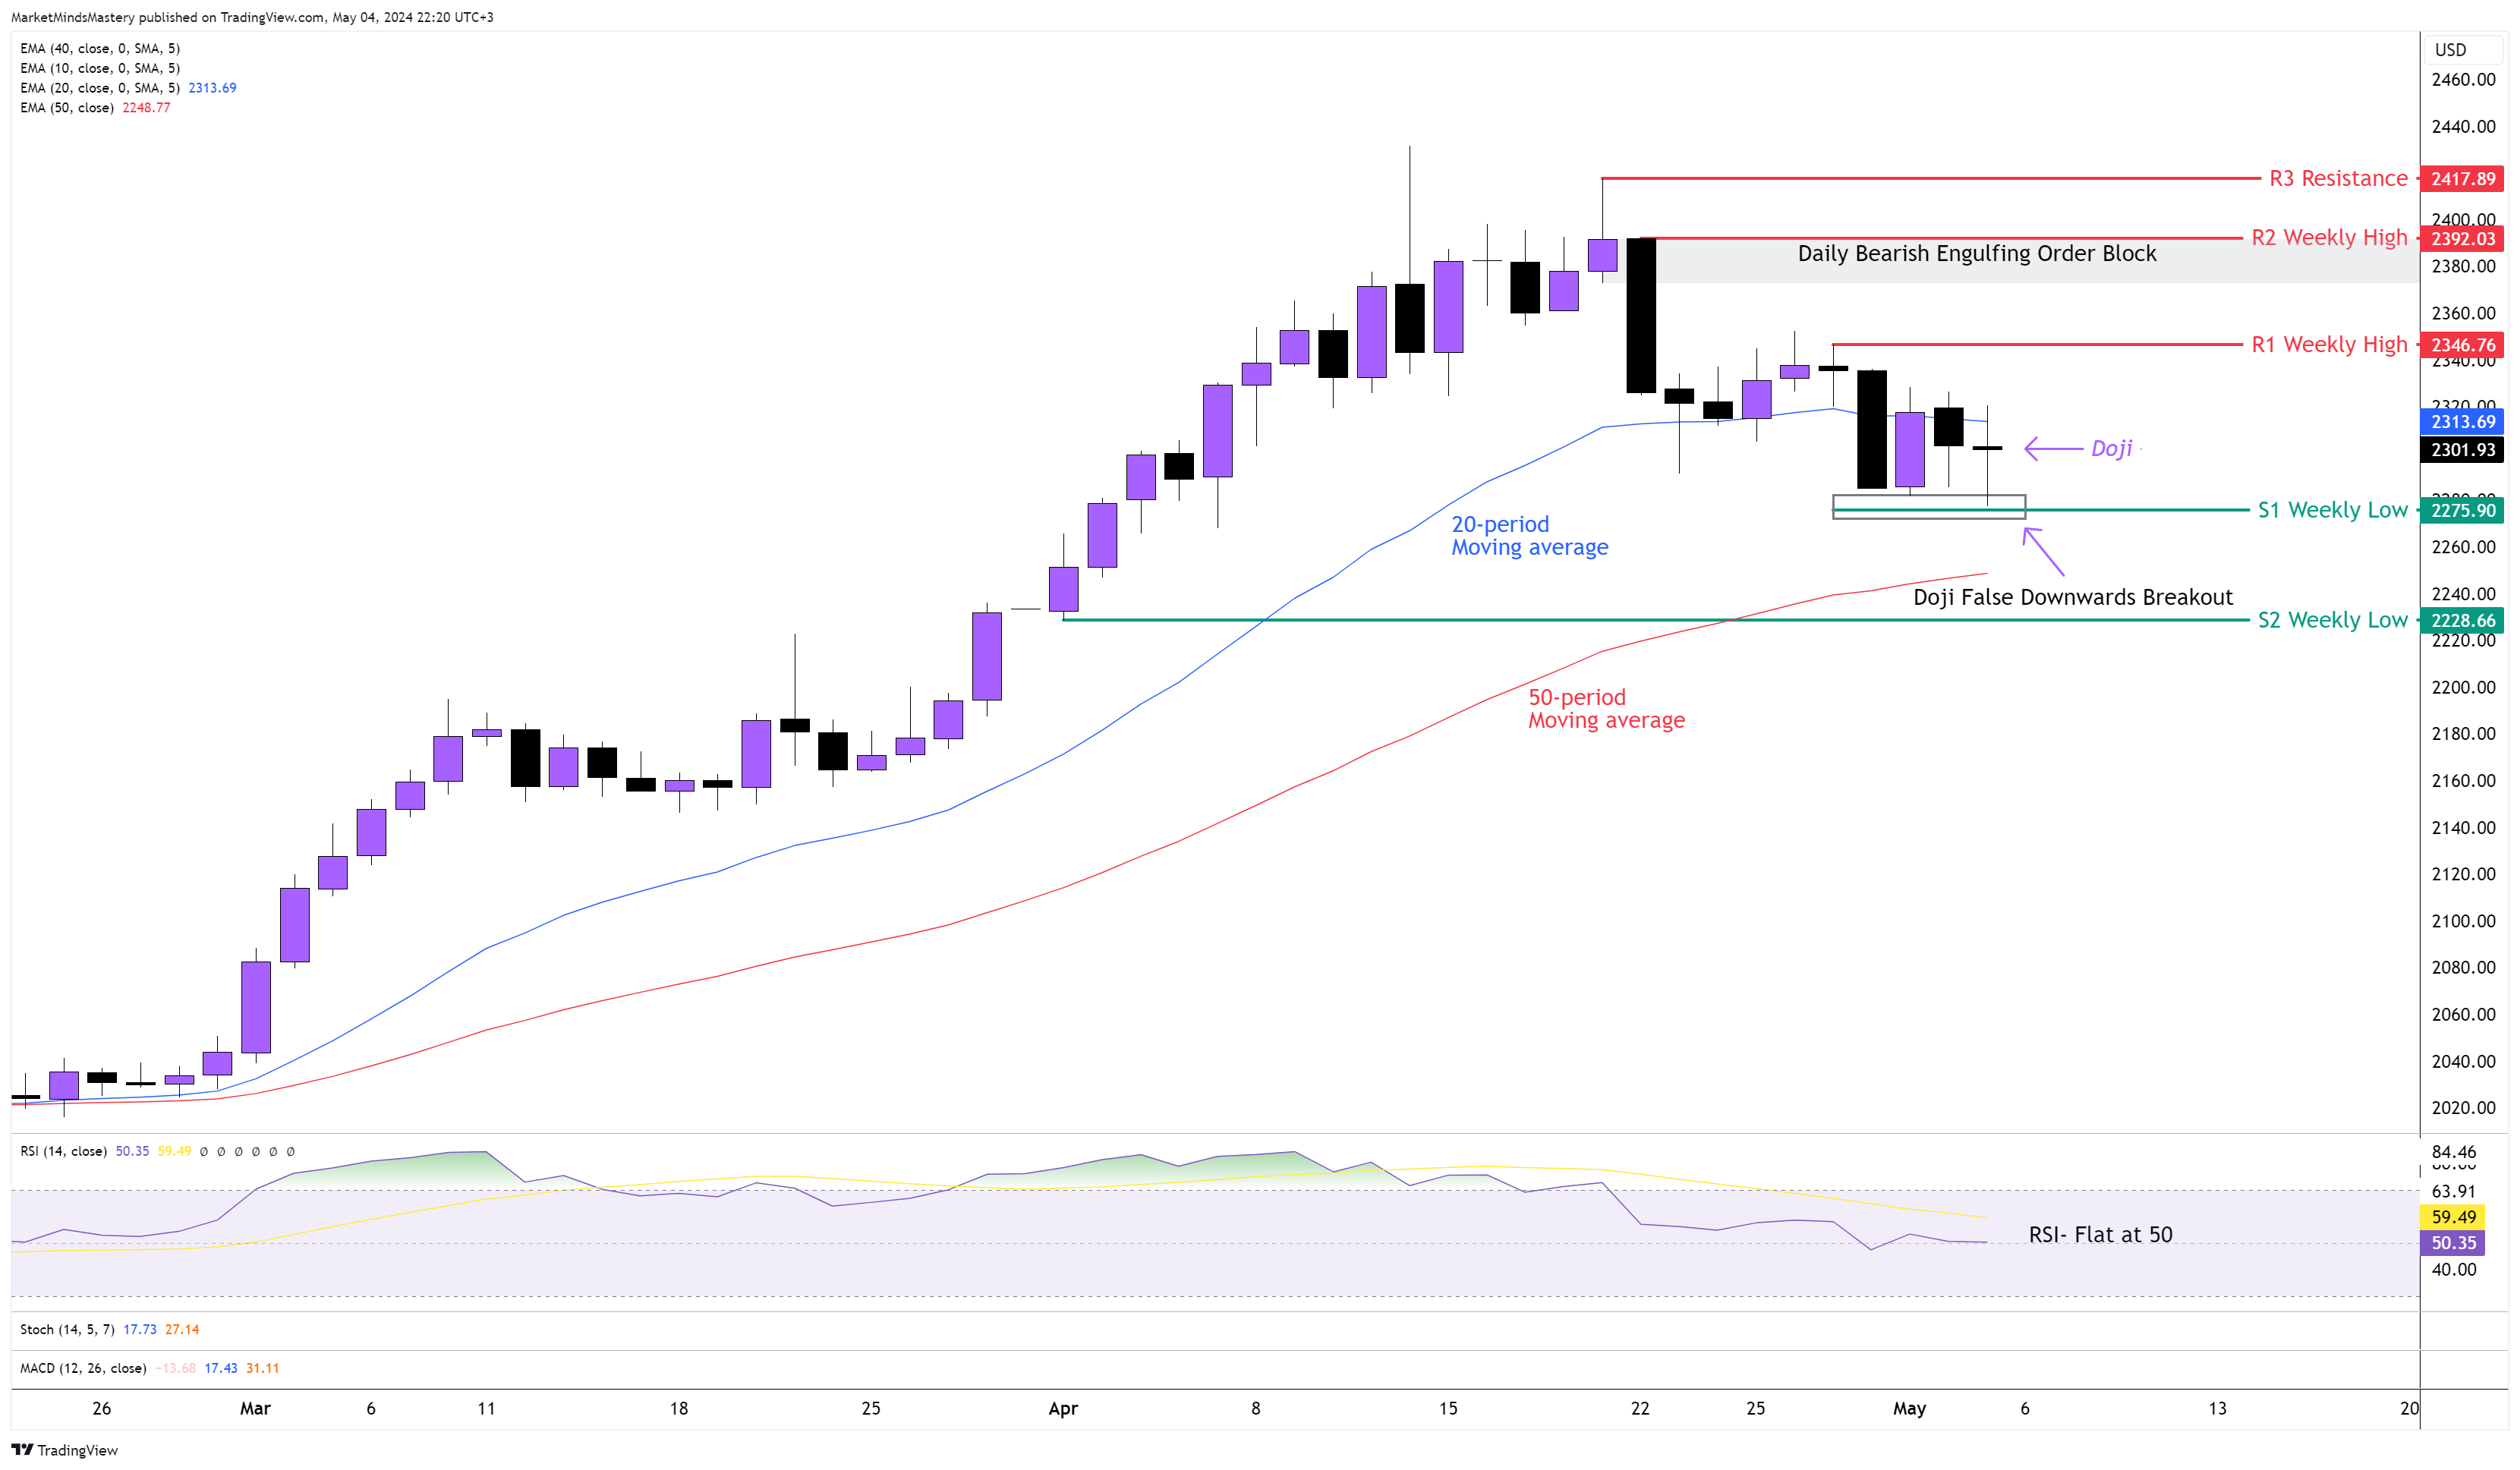
GOLD DAILY
This is an interesting chart based on the price action shown on the Daily chart. Last Tuesday, the price ended as a large Bearish Marubozu candle. Usually, moves like this occur due to a significant imbalance between buy and sell orders. After these moves occur, the market is expected to move directly, which didn’t happen in this case. The price was trading within the Bearish Marubozu candle, and last Friday, the Doji candle falsely broke the low of the Marubozu, marking the previous week’s low. Considering that the weekly chart is in an uptrend, this can be the retracement pattern ABCD, and the market may resume its uptrend.
The 20-period is above the 50-period, which has bullish implications. The RSI Oscillator is flat around 50, indicating a directionless market. The price is still in an uptrend on the Daily chart, as no significant low point has been violated. Hence, starting Monday, if the price moves upwards, the first resistance, R1, is the previous week's high, around $2346. A break above it finds the next resistance, R2, slidly below the $2400. Based on the chart, this is a significant level, as it was the starting point of the corrective phase, which left behind a Bearish Engulfing Order Block. Opposively, if the price declines, the previous week’s low will act as the S1 support. If the market trades under the S1, it will find the S2 support, around $2228. At the same level, the 50-period moving average is currently trading.
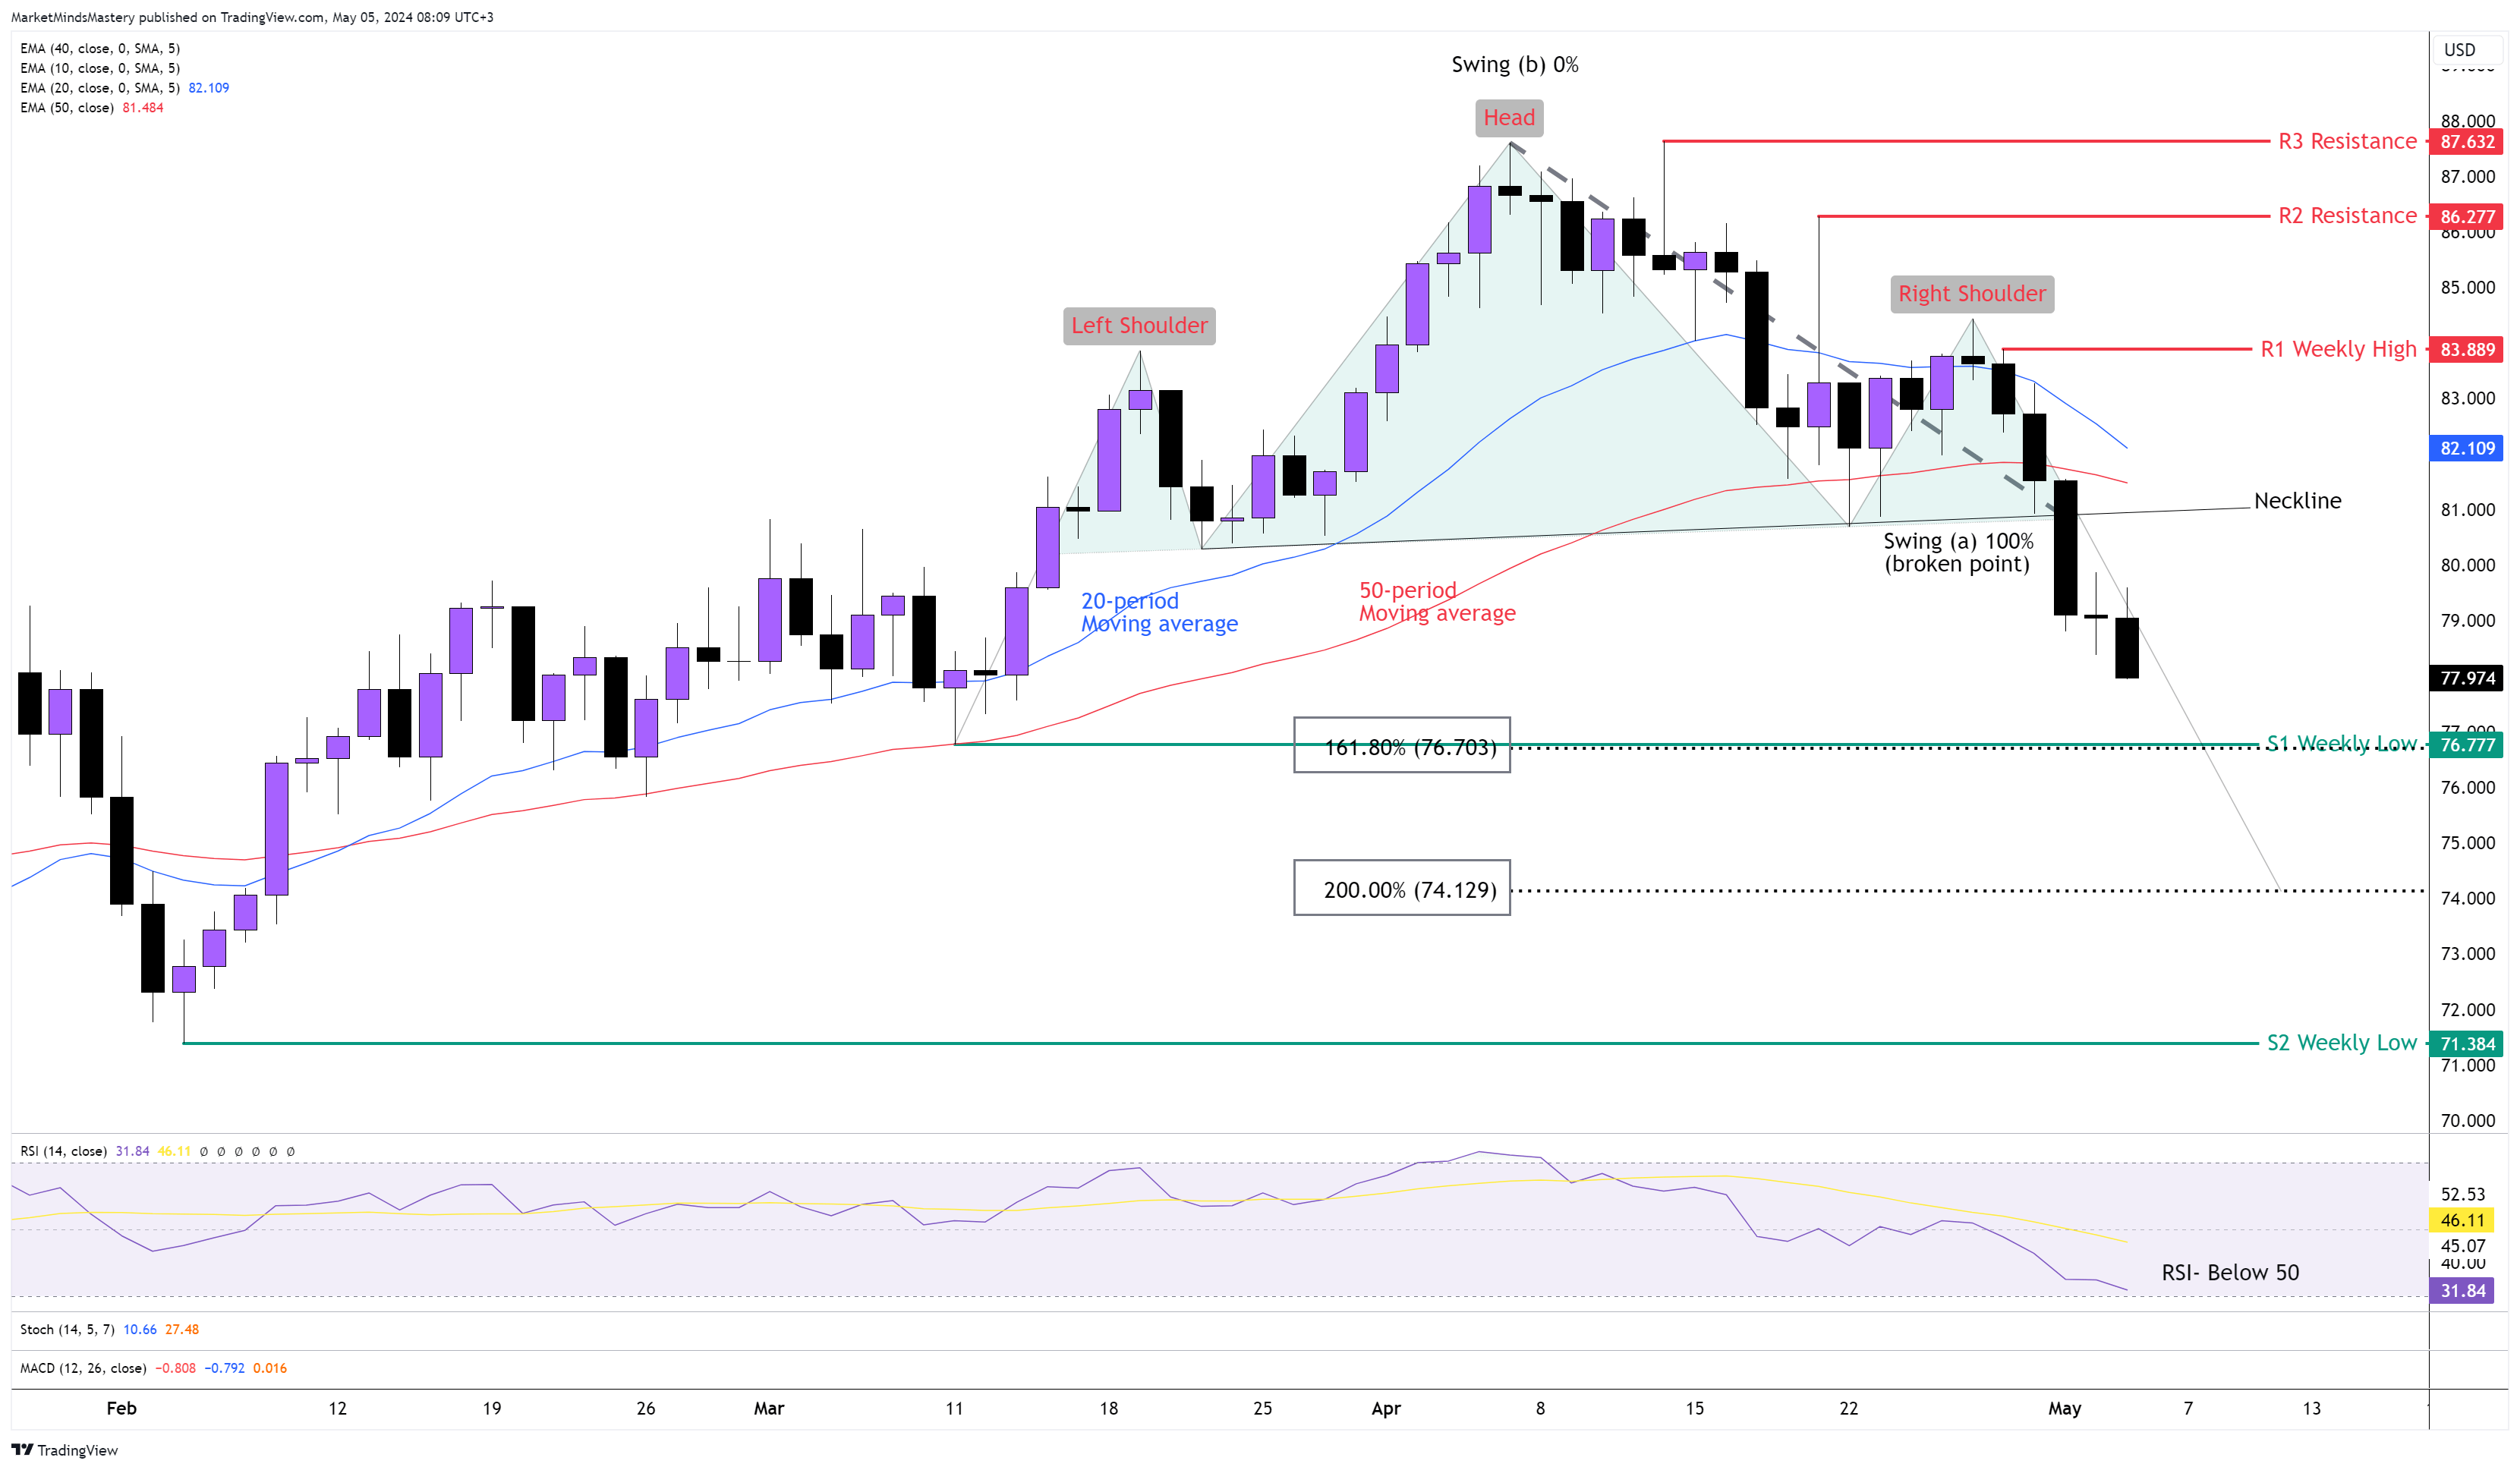
US OIL DAILY
One of the most prominent reversal patterns in the market is well-known to almost every trader, the H&S (Head and Shoulders). It is the only Bearish reversal pattern that takes the longest to build, usually 1-3 months, and it is considered a major reversal when it follows an uptrend. The broken neckline indicates the selling pressure in the market, and most of the time (not always), the price will return to the broken swing (a) before continuing to decline more. The RSI is almost at its oversold area, indicating bearishness. The 20-period is still above the 50-period moving average, indicating bullishness. However, the moving averages are lagging indicators.
If the H&S pattern won’t fail and the price declines, the first and minimum target is the 200% Fibonacci Extension, which, in this case, we measure from the broken neckline point (swing a) to the Head (swing b). The trades must consider that before the minimum estimated target is around $74, there is the S1 support of around $76.77, which consists of 161.8% of the Fibonacci number, which can attract market orders. If the price moves upwards and penetrates the neckline, the first resistance, R1, is around $83.88, which is the previous week’s high. If the price penetrates the R1, it means the H&S pattern failed. A further move to the upside finds the R2 and R3 resistance areas around $86.27 and $87.62, respectively.
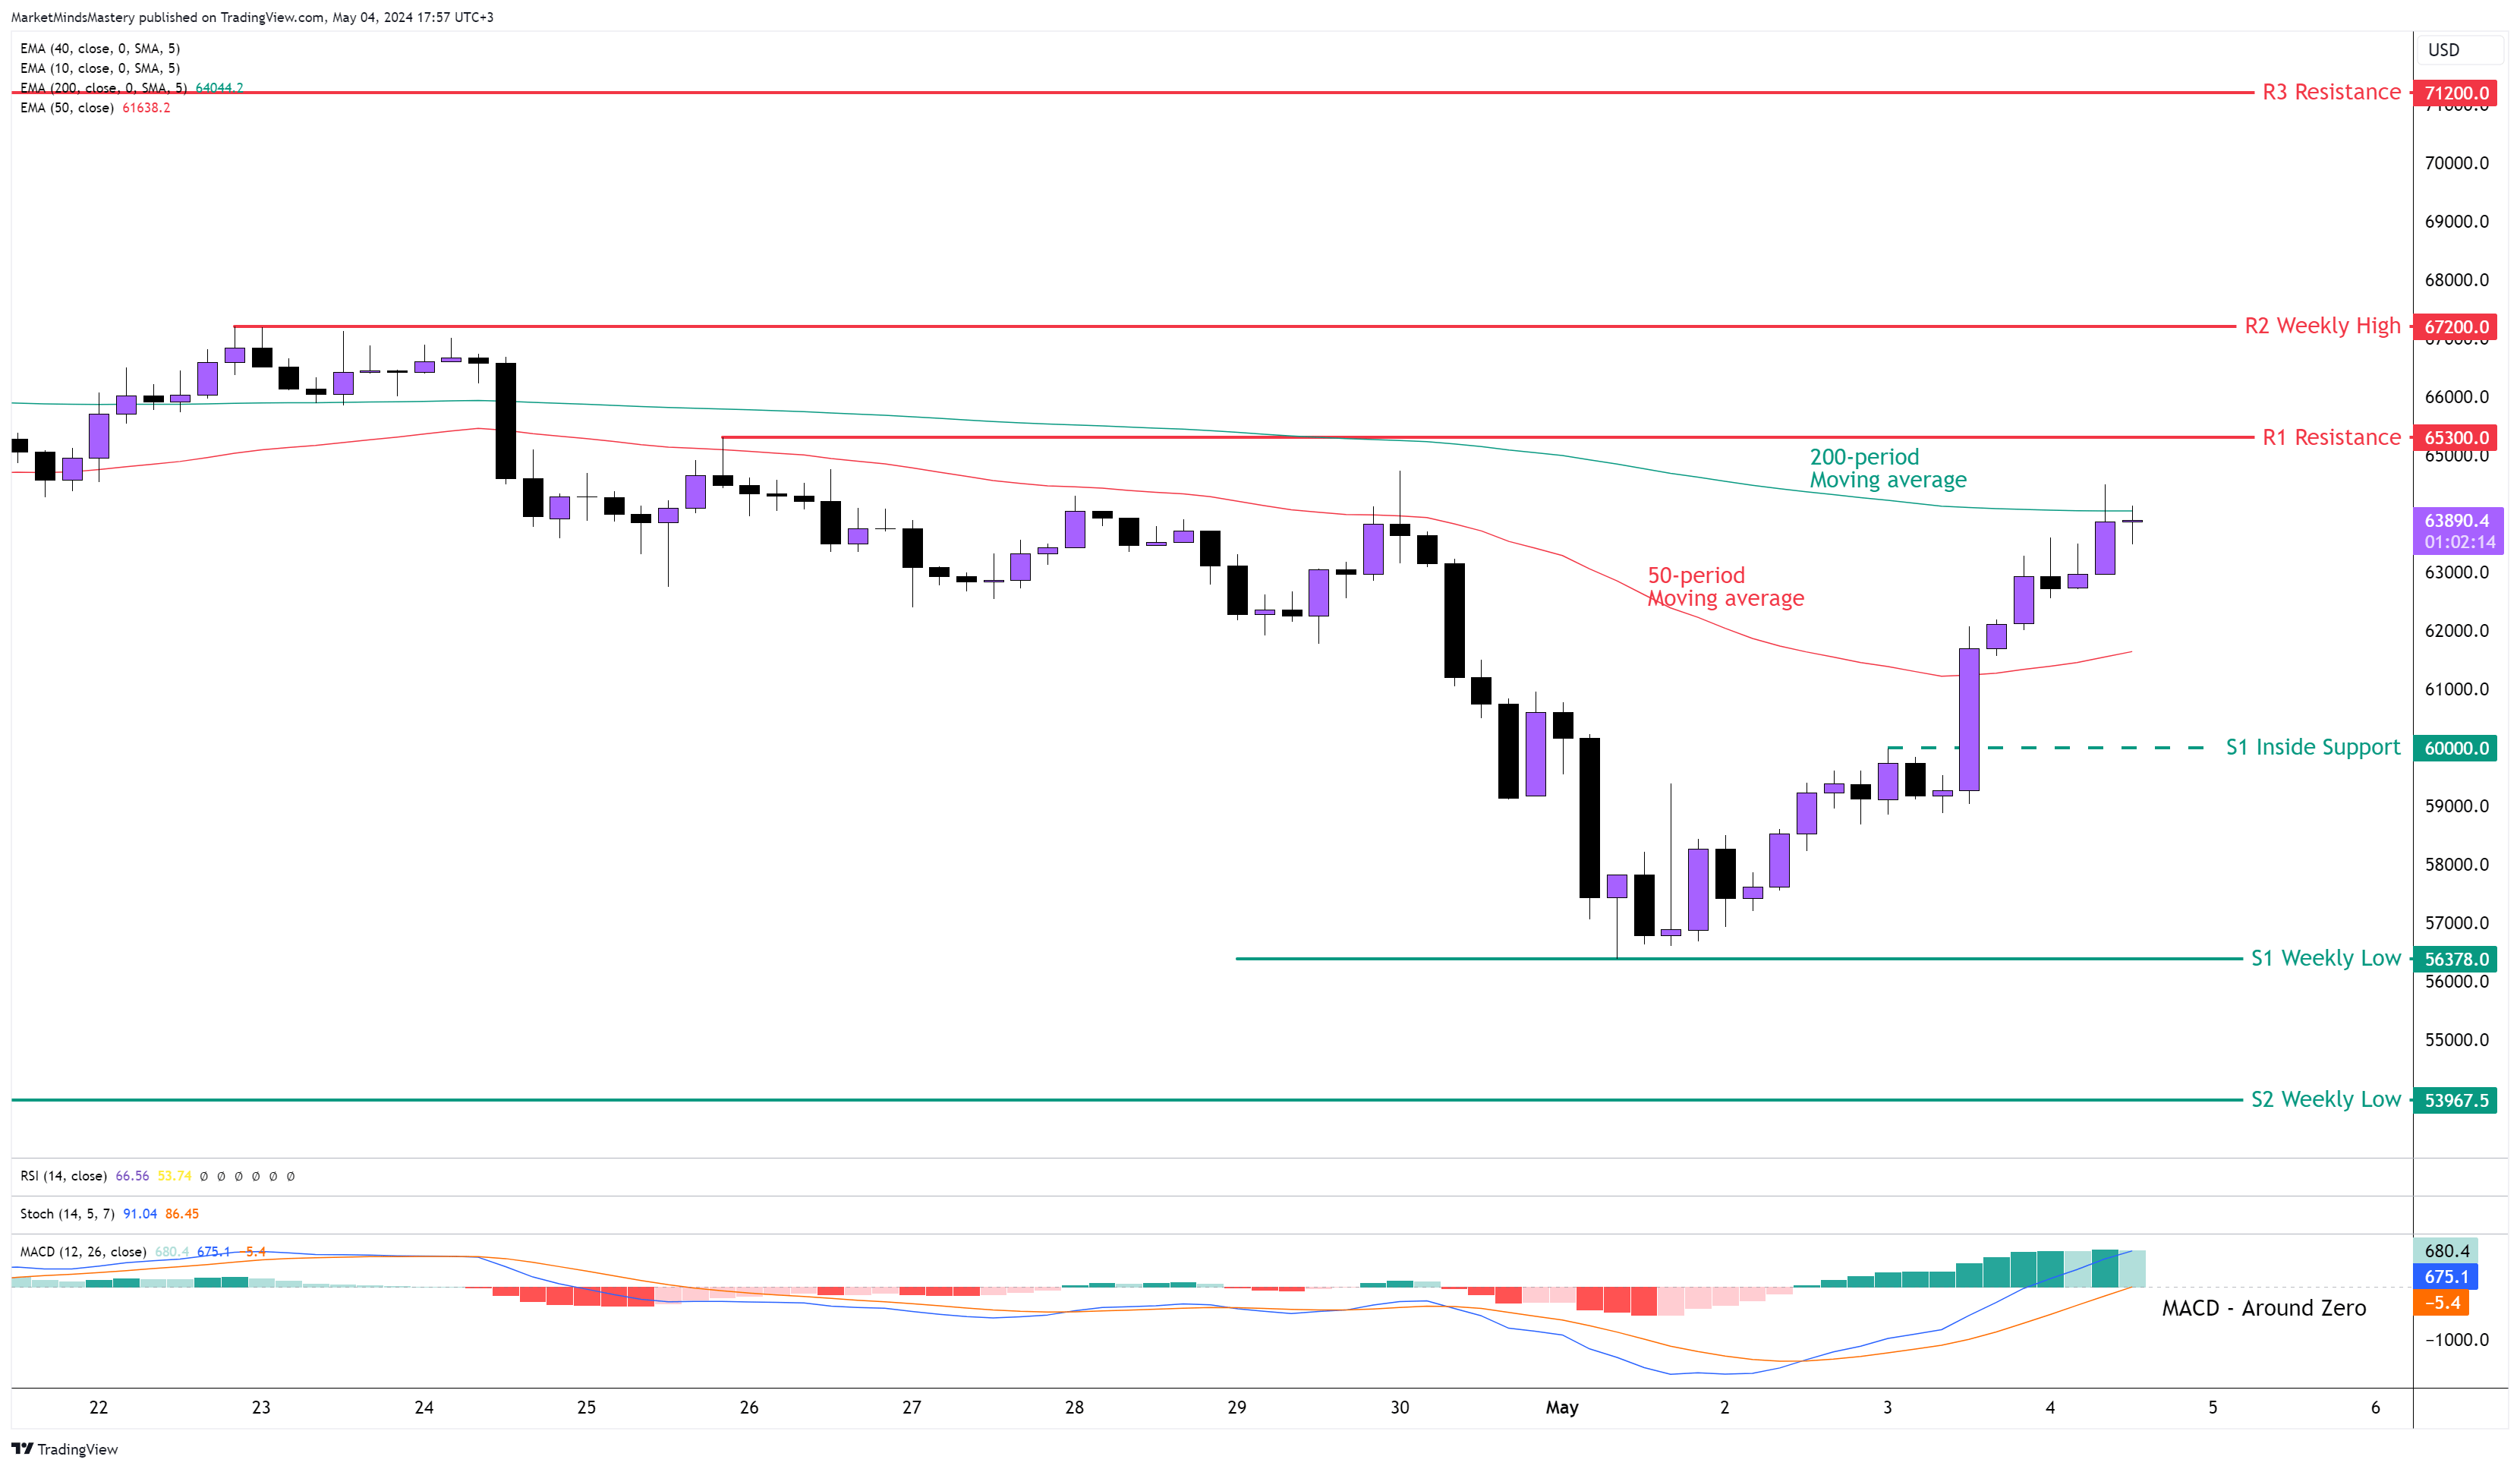
BTC USD 4H
Even though Bitcoin was selling off from the beginning of the previous week, as we expected, due to the 4-hour downtrend, the price found support around $56300, bounced-ff and moved upwards since last Wednesday.
The price is now trading around the 200-period moving average. The 50-period is still under the 200-period, which indicates bearishness. The MACD is around the zero line, followed by a rising histogram indicating rising prices.
If the price continues to move upwards and surpasses the dynamic 200-period moving average, the first resistance area, R1, is around $65300. As previously, this level attracted a lot of attention. It might repeat similar behaviour now. If the price penetrates the R1 and keeps moving upward to the next resistance, R2 will be around $67200.
The price can also move downwards. If this happens, the first support, S1, is the area of $60000. A round number is a number that traders and investors will probably look to use to place limit orders. If the price closes below the S1 and keeps moving downwards, the next support area, S2, is around $56378, the lowest price level the price traded the previous week.
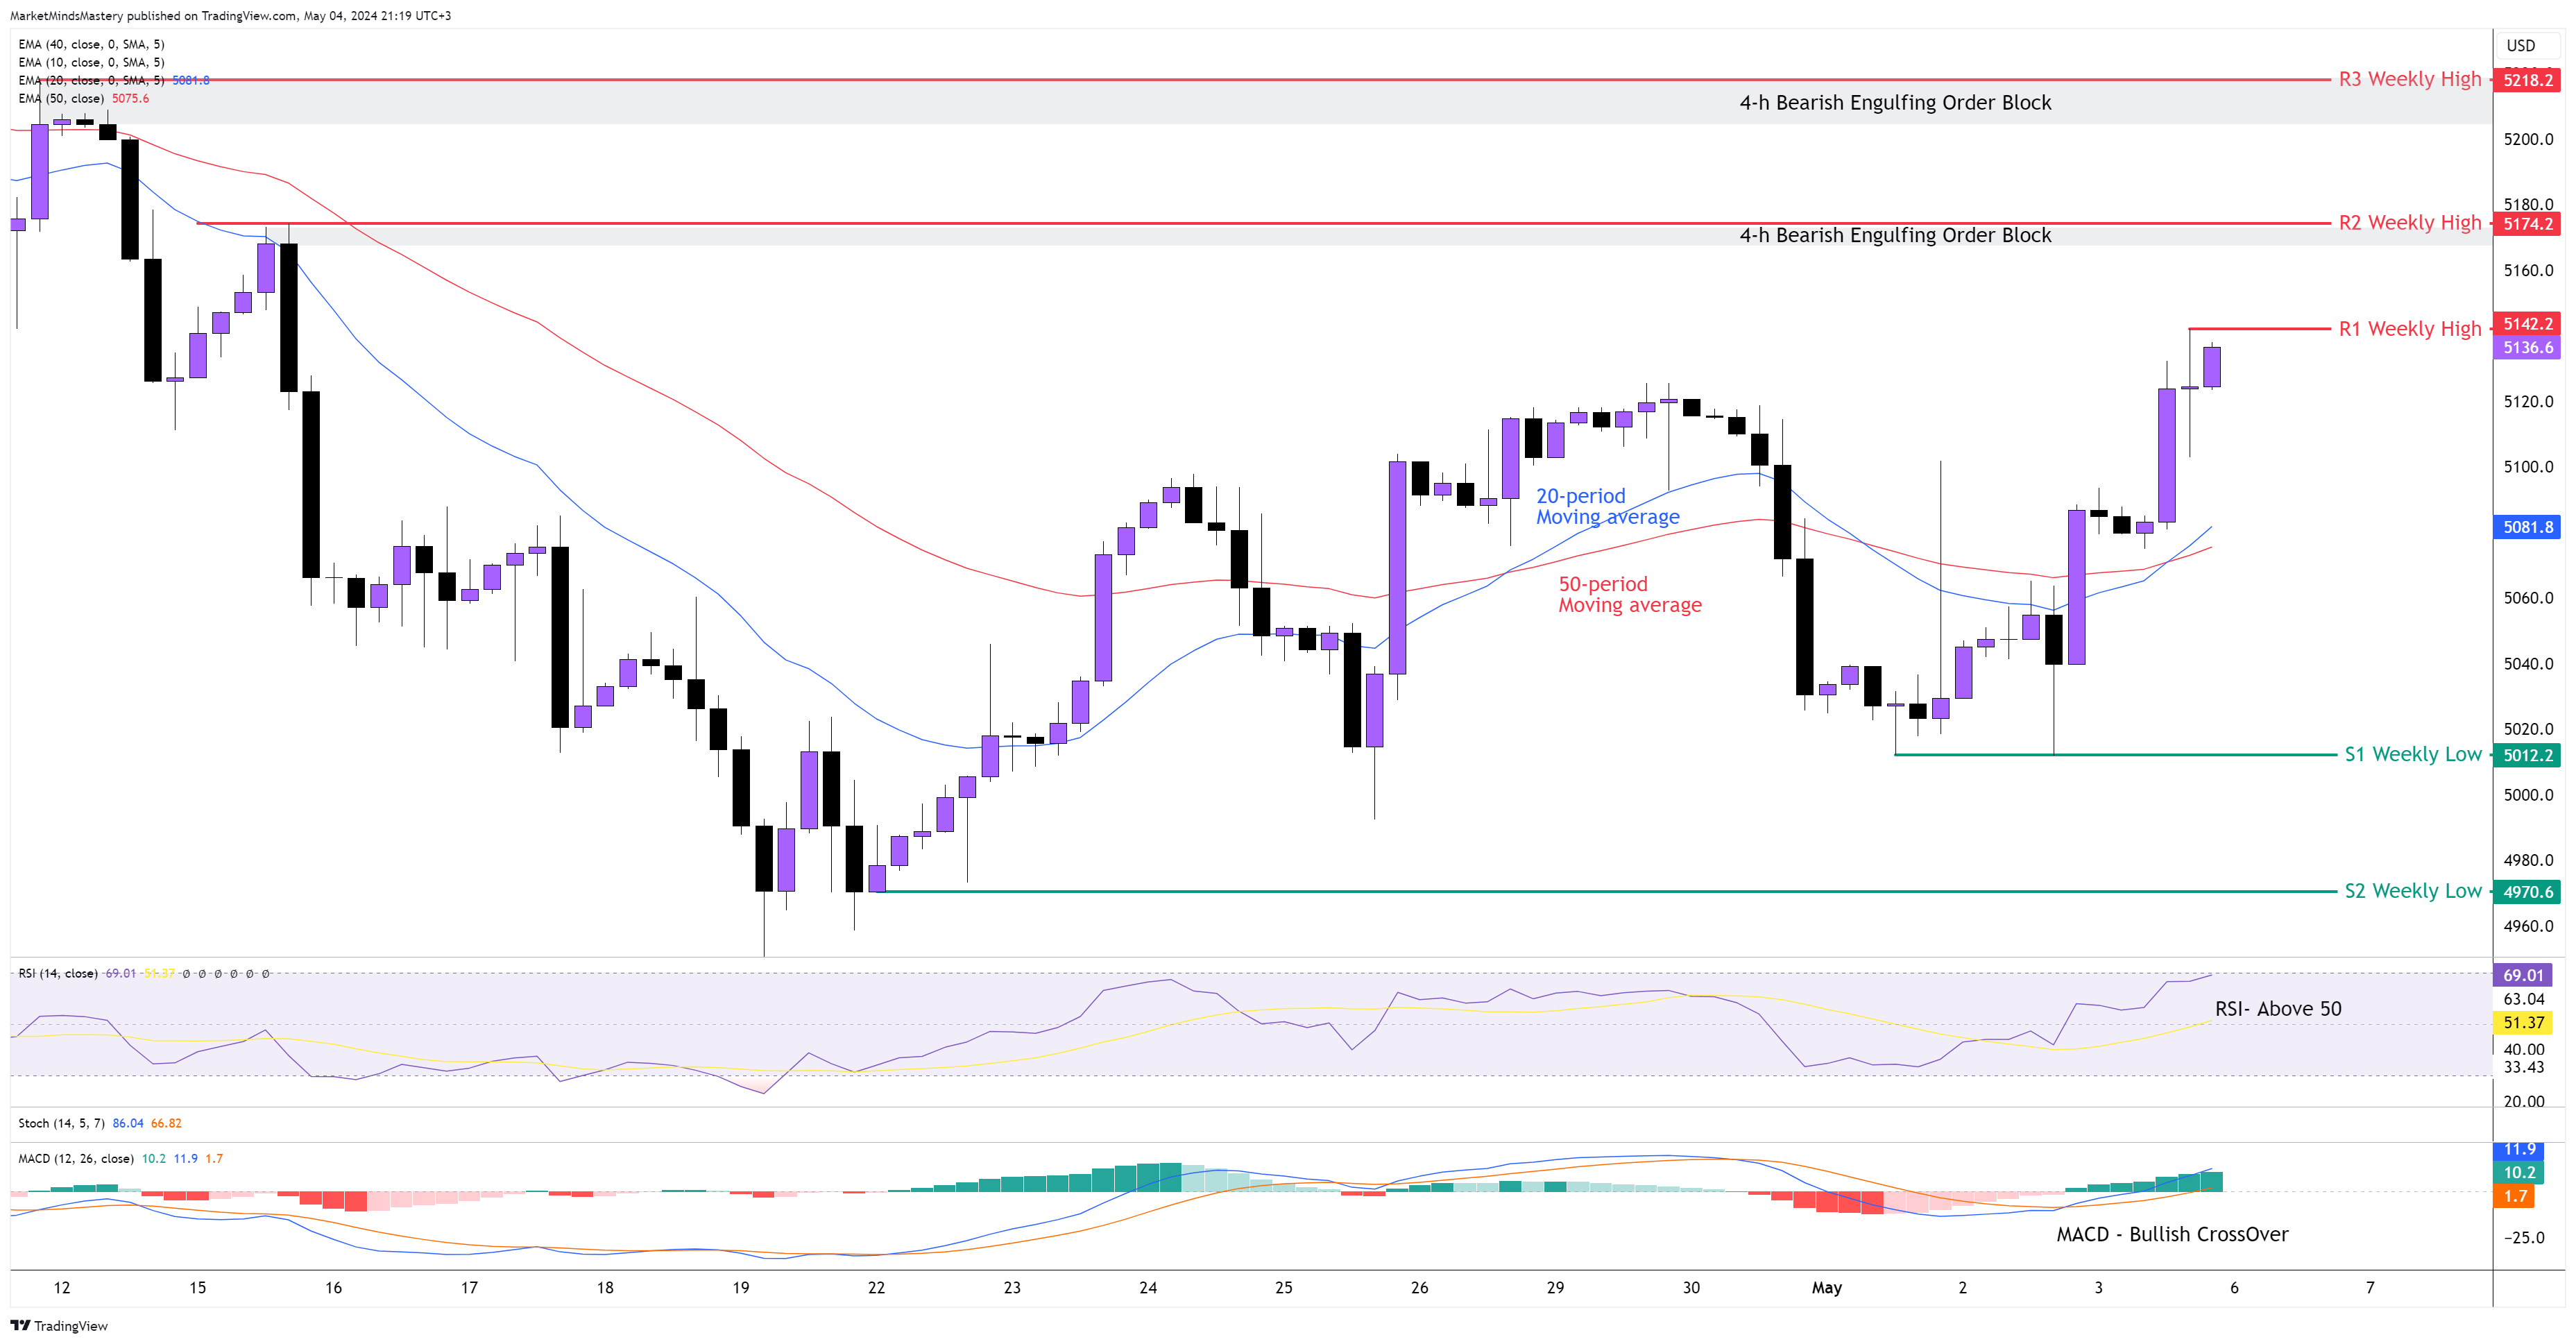
SP 500, 4H
Following the primary trend of the weekly chart, the SP500 created a failure swing low last Monday, followed by a new market structure of higher highs and higher lows during the week. Now, the 4-hour chart is in alignment with the weekly direction. Although the weekly price action didn’t show a significant upward move, it indicates that a second wave of retracement may occur.
The 20-period crossed above the 50-period moving average, which has bullish implications. Also, the RSI is above 50, and the MACD created a Bullish Crossover below the zero line.
The well-defined price action consists of long bullsh candles, indicating that the buy orders are significantly more than the sell orders.
If the price continues to increase, the first resistance area, R1, is the previous week’s high, approximately $5142. If the price moves above the R1, the next resistance area, R2, is around $5174, defined by a Bearish Engulfing Order Block. If the price declines and moves lower, the first support area, S1, is the previous week’s low, around $5021, and the next support area, S2, is approximately $4970, an old weekly low price.
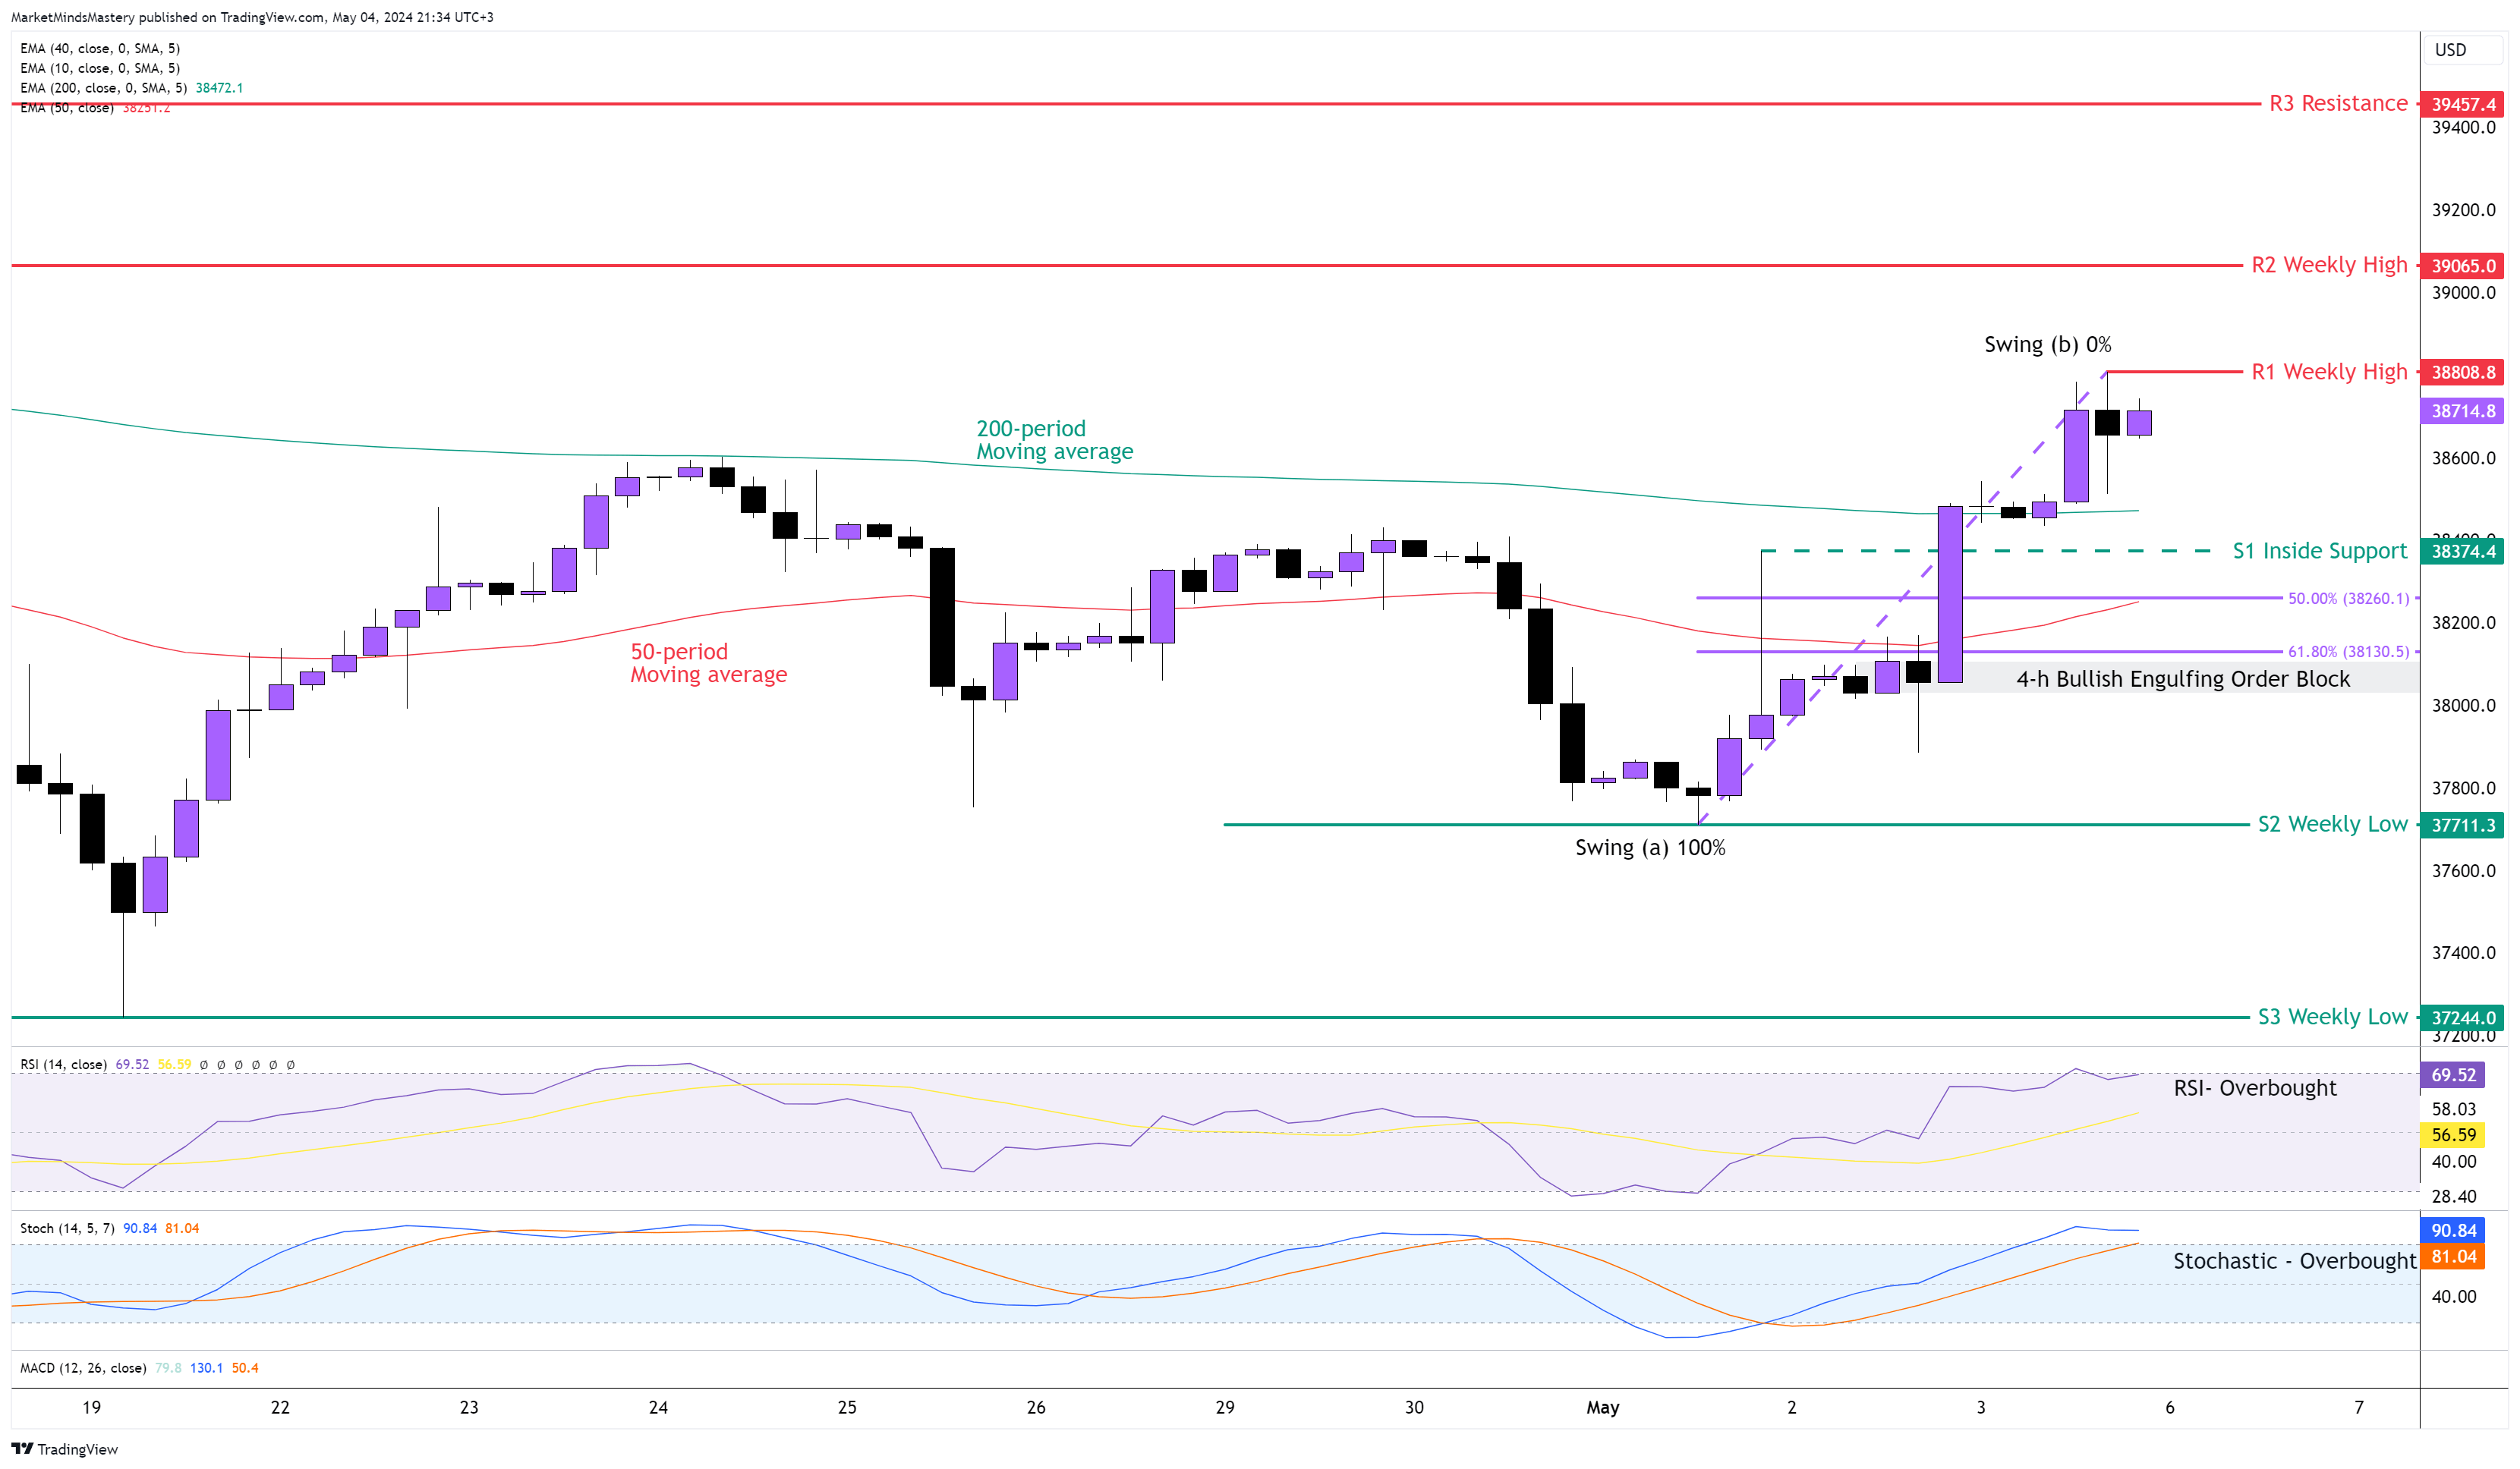
US 30, 4H
The weekly chart created a Bullish Engulfing candle with a long lower wick, indicating that the buy orders overtook the market. The positive divergence we explained in the previous week's analysis caused the price to create a new direction with higher highs and lows. The price is trading above the 200-period moving average, which is a bullish indication. The 50-period hasn’t crossed above the 200-period, which contradicts the bullish bias. However, the RSI and Stochastic oscillators are both in overbough conditions.
Measuring the recent upward move, there is a 61.8% Fibonacci level around the 4-hour Bullish Engulfing Order Block. This indicated that if the price is traded at that price level of 38130, it might attract a lot of orders due to this confluence.
If the price moves upwards and surpasses the previous week’s high, which is the R1 resistance, around 38808, it can reach the R2 resistance area, which is another weekly high, around 39065. We observe that both the R1 and R2 are nearby round numbers. If the price declines, the first area of support, S1, is inside support of the 4-hour chart at around 38374. If the price keeps lowering, the second static support, S2, is the previous week’s low, around 37711.
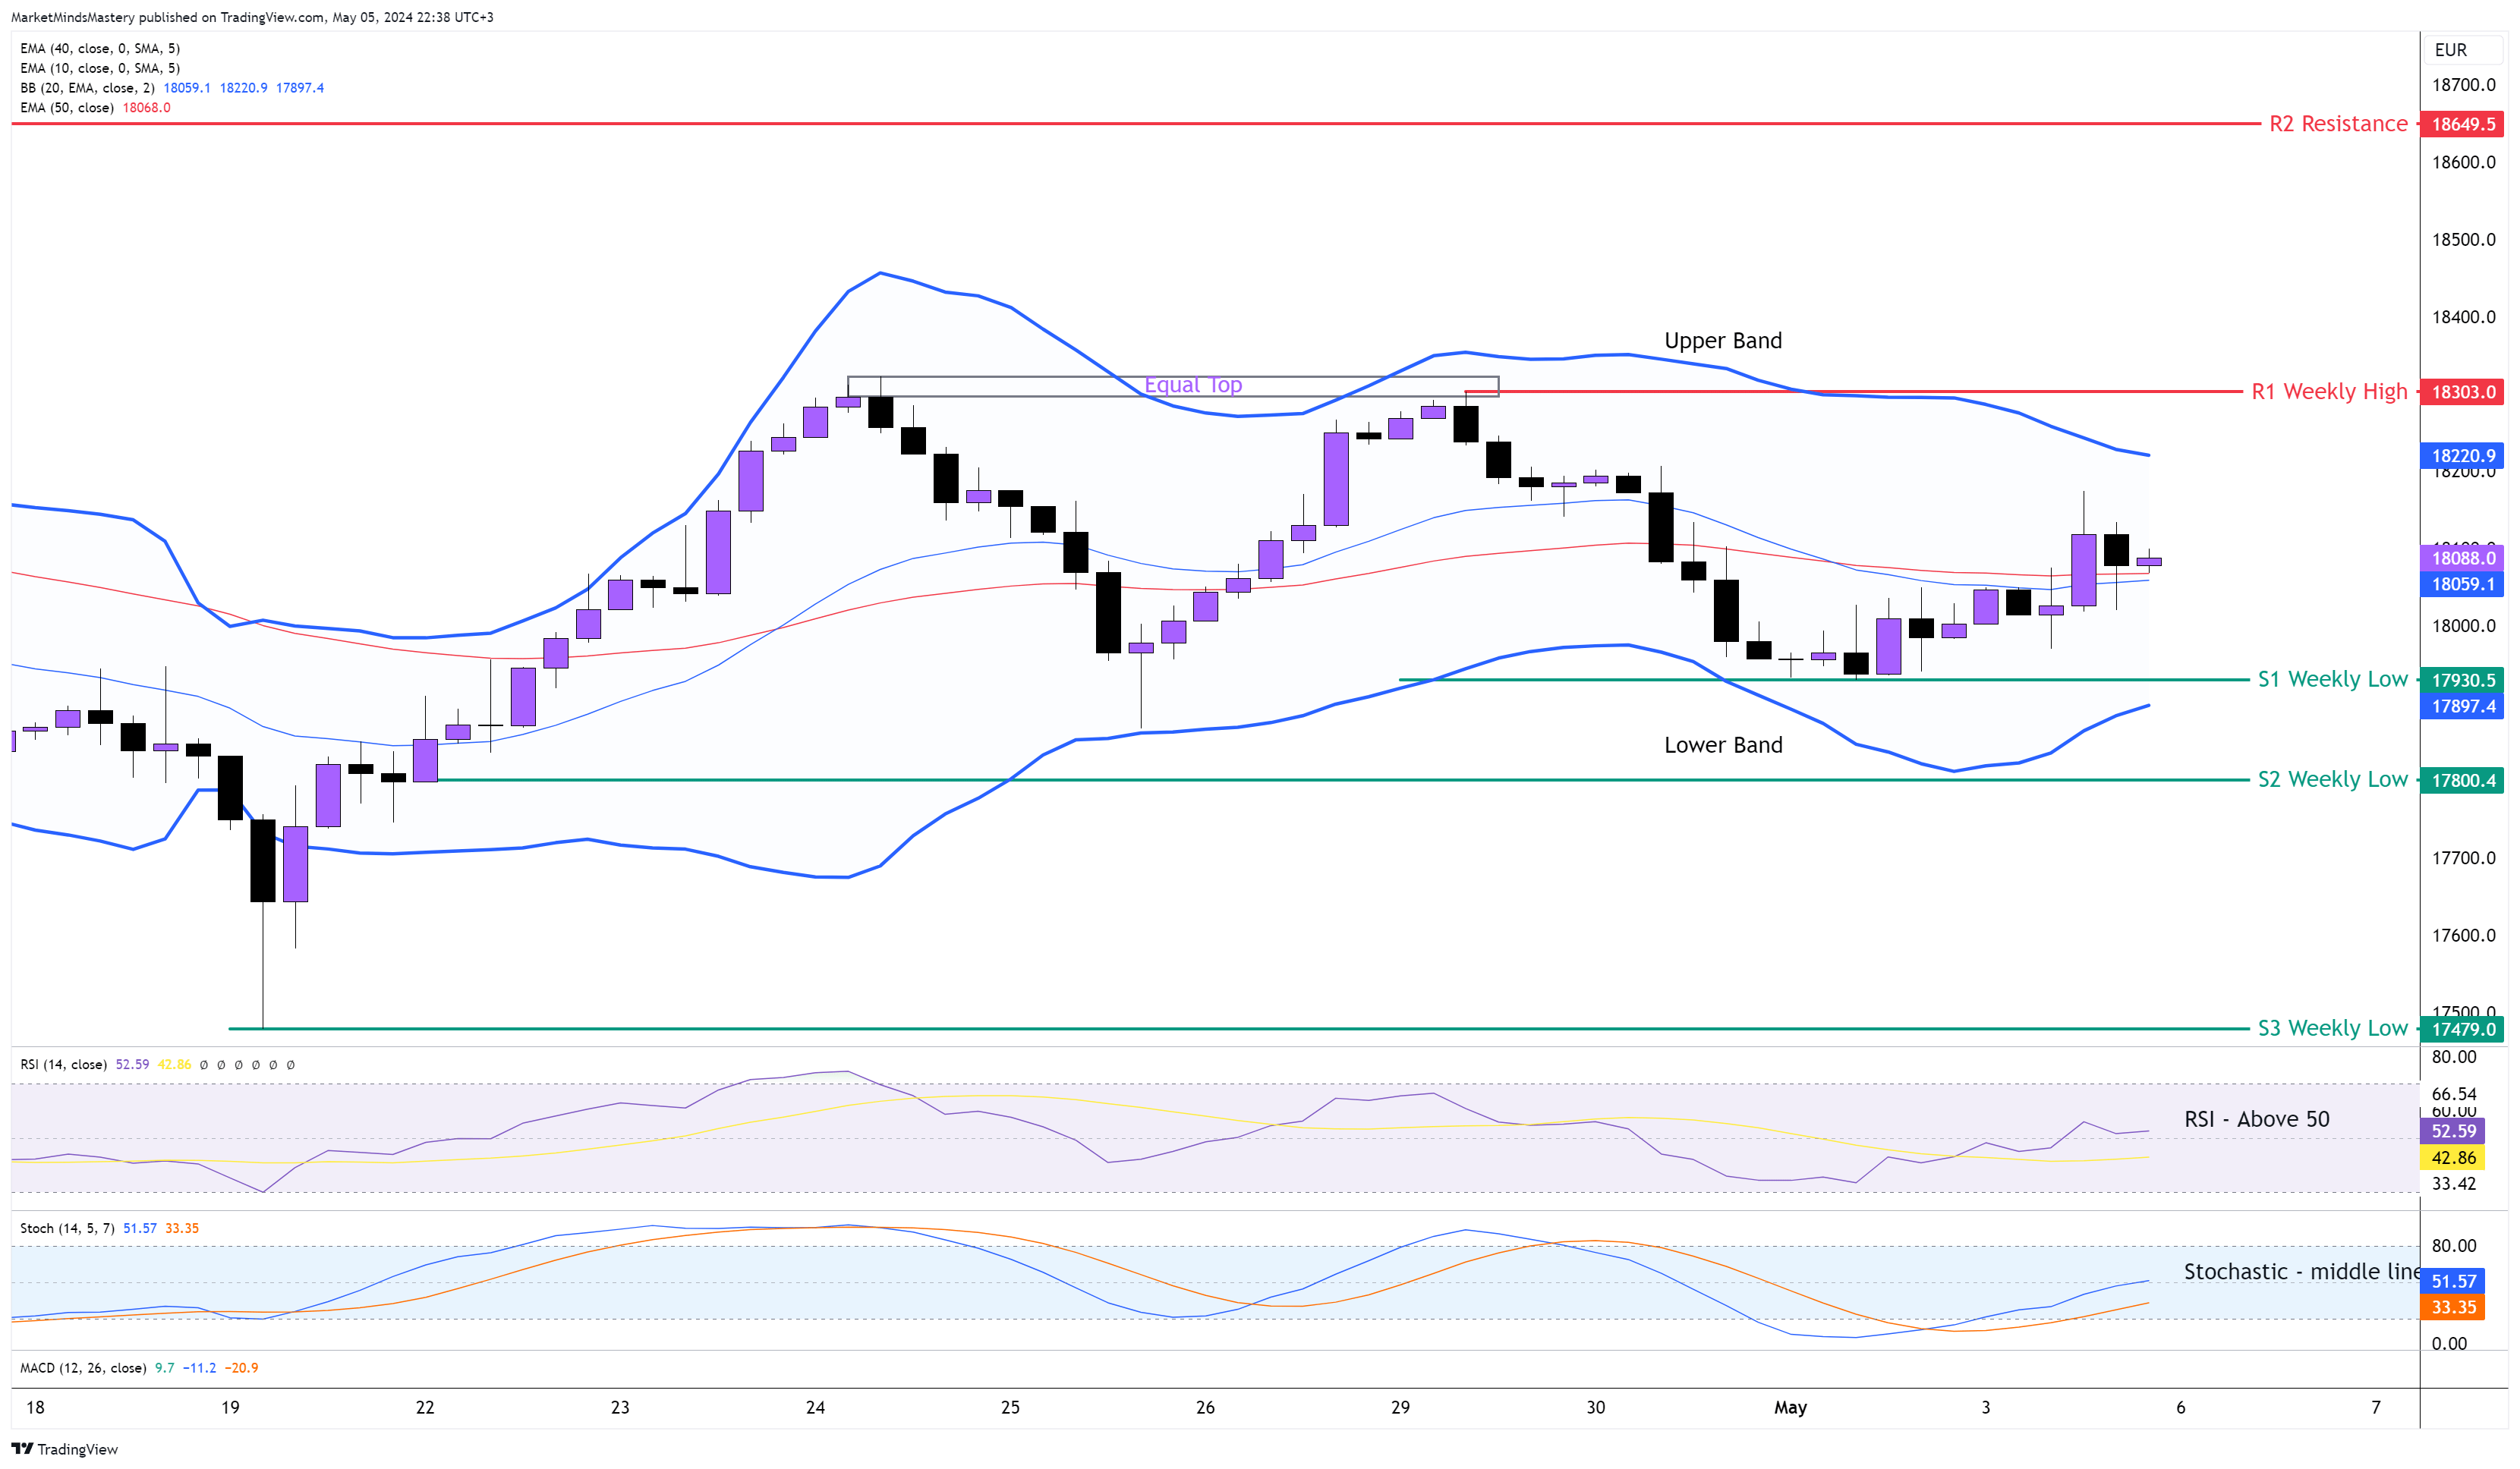
GER 30, 4H
The last week it ended with an inside candle based on the weekly chart. Based on the trend concept, the price should move away from the support with strong momentum after a successful bounce off a support area. In his case, the price didn’t follow. Although the primary trend points upwards, the 4-hour chart trades in a trading range. This is because the market makes equal highs and lows. The upper and the lower bands converge, the Bollinger Band moving average and the 50-period moving average are flat. Both the RSI and Stochastic Oscillators are around their middle line, indicating a trendless market.
If the price moves upwards, the first resistance area, R1, is the previous week’s high, around 18303. If it breaks above the R1 and keeps increasing, the next resistance area, R2, is around 18649. On the other hand, if the price declines, the previous week’s low will become the S1 support area around 17930. The following support area, S2, is just under the S1, around 17800, which also is a weekly low price.
👉 Click here to check our Challenges
👉 Don’t miss our Free Live Webinars
👉Join us on Discord
Risk Disclosure:
The Trading Pit offers only demo accounts to all users within the Challenges and Signal Provider Agreements (Scaling Plan). All assets and trading activities are purely virtual. Please note that we do not offer CFD (Contract for Difference) challenges to residents of Canada and the United States. All content and information on this website is for informational purposes only and should not be interpreted as financial advice. Also, remember that results achieved in the past are no guarantee of future results. It is essential to understand the risks associated with trading. If you are unsure, always consult an independent financial advisor.