The Trading Pit Week Ahead Market Outlook (February 19 – February 25)
A short week of significant news is this week ahead. A positive CPI number favoured the US dollar last week, and the Greenback appreciated. On the other hand, the Japanese Yen reported a much lower GDP. Therefore, the USDJPY moved upwards, and the uptrend continued. Starting Monday, the banks in the US will remain closed due to Presidents’ Day. Similarly, the Banks will be closed in Canada due to the Family Day bank holiday.
The RBA (Reserve Bank of Australia) Minutes of the Monetary policy meetings will be reported on Tuesday. We expected to understand how the board members see the growth of Australia and if they will give us some clues about what they plan to do with the Interest Rates next month. The only numeric metric significant event for the day will be Canada's CPI (Consumer Price Index). Currently, the CPI number is at 3.4% and, based on the forecast, is expected to drop to 3.2%. For a CPI number to decline by 0.2% is significant. Suppose the actual number deviates from the forecast. In that case, we predict a significant intraday price fluctuation in the CAD Futures and all Canadian Dollar currency pairs, especially the USD/CAD as per the technical picture.
On Wednesday, all market participants, traders and investors will focus on the only major event of the day, the FOMC Minutes. This event takes place in the US, and it is the single relevant event in which the members discussed whether their Interest Rates will be changed or not in the US. Enormous volatility usually accompanies the FOMC minutes every month. If the USD appreciates and the market follows through, there is a high possibility for the USDJPY uptrend to continue. Also, if the Canadian dollar performs poorly, the USDCAD will be a pair to watch closely.
On Thursday, in Japan, Banks will be closed due to The Emperor's Birthday bank holiday. With the London session kicking in, the Services PMI, Manufacturing PMI and Composite PMI(Purchase Manufacture Index) will be reported in Germany and the same three events in the Eurozone. In total, six events will be reported. All six events are estimated to remain below 50, per the consensus. In a nutshell, the number 50 serves as a benchmark. A reported number above 50 is considered bullish for the currency. A number below 50 is considered bearish. Approximately an hour later, the same events- Services PMI, Manufacturing PMI and Composite PMI will be reported in the UK. The Manufacturing and Composite PMI are expected to remain below 50, and the Services PMI is anticipated to exceed 50. The last significant events for the day will come from the US and will be the S&P Global Services and Manufacturing PMI. As per the consensus, both are expected to report above benchmark 50. As we have experienced in the last few years, since 2021, the markets haven't created directional movies because of any outcome of these events. Usually, volatility increases slightly around these events, which is more noticeable on the intraday charts in the lower time frames.
AUDUSD Daily

Following the CPI outcome last Tuesday, the price bounced off S1 support, around 0.64525 and moved upwards for three consecutive days. Last Friday, it reached the 20-period moving average, and the R1 resistance was approximately 0.6550. The RSI shows positive or bullish divergences, and its value is still below 50, which is a bearish indication. The price maintains its lower highs and lower lows, which is also a bearish indication.
If the price declines from the R1 resistance and moves downwards, the first support is the S1, which was recently tested. If the price breaks and closes below the S1, the next support, S2, is approximately the level 0.63606.
On the 4H time frame, a bullish engulfing block was founded by a bullish engulfing candle.
Oppositely, if the price penetrates the R1 and the 20-period MA and moves upwards, the next area of resistance, R2, is approximately 0.66246. Around this level, a Daily block was founded. This also consists of the 50-period and the 200-period moving averages, which usually act as a dynamic resistance.
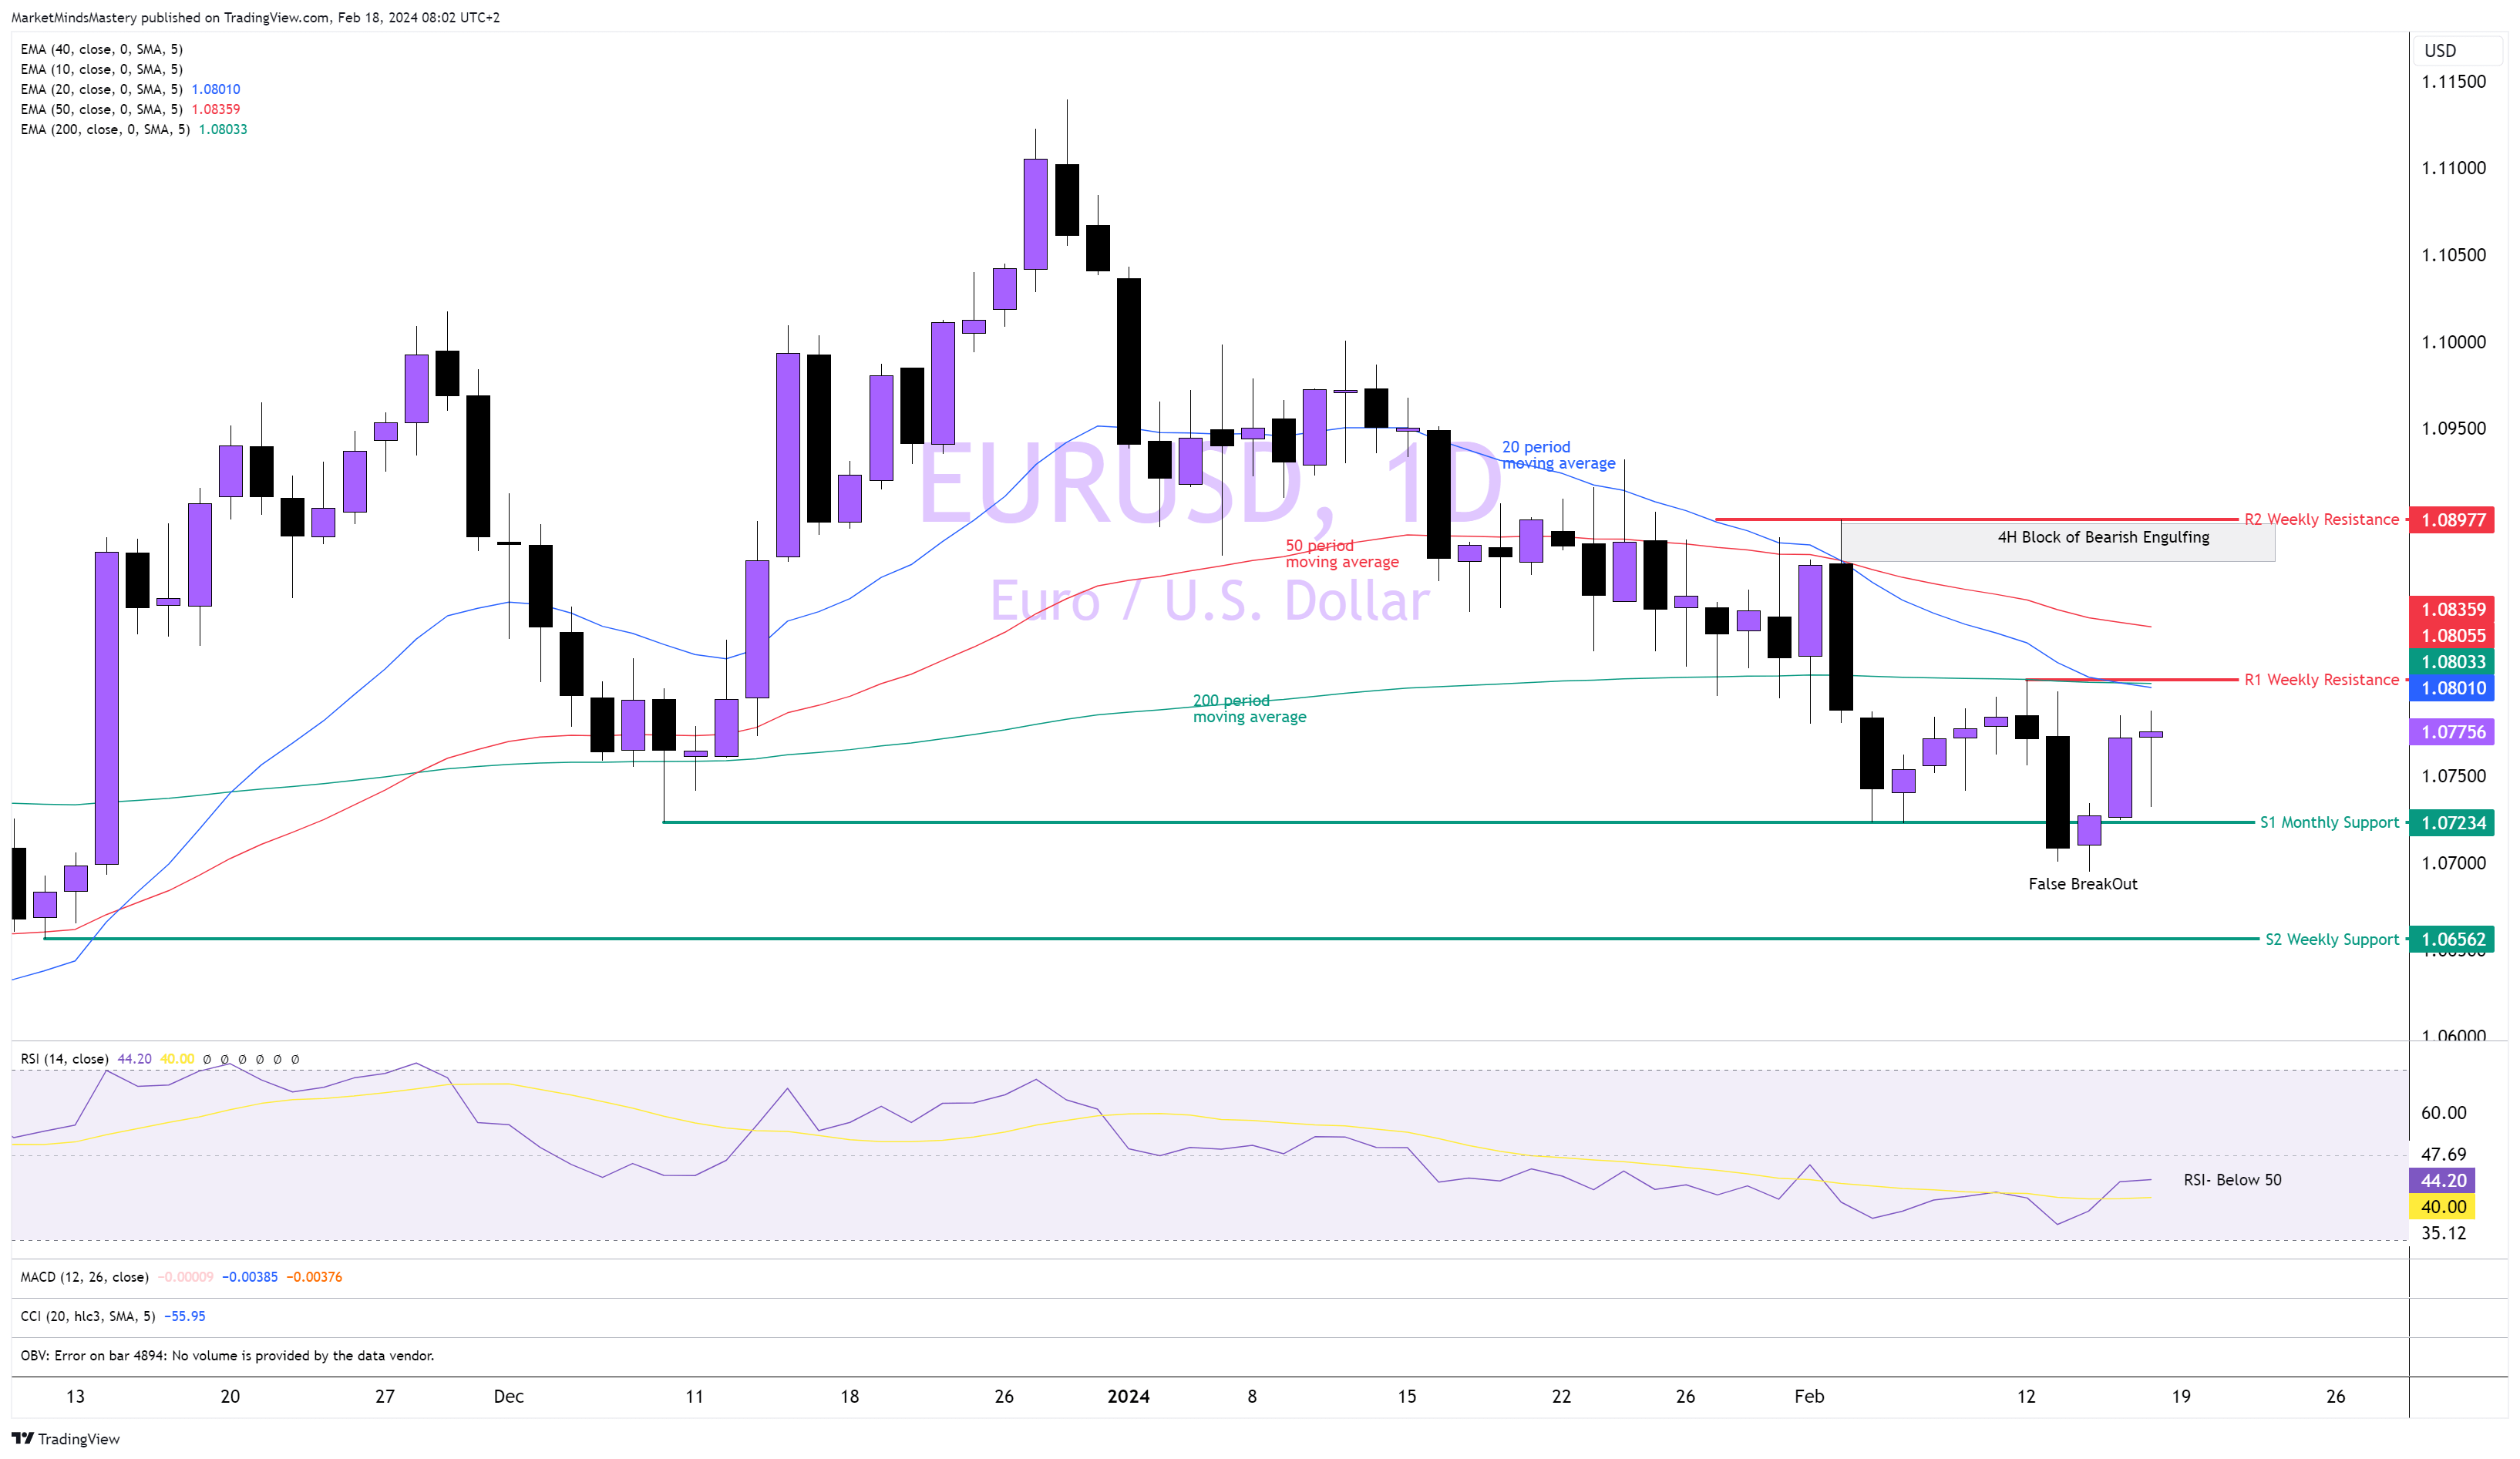
EURUSD, Daily
Following the bearish engulfing candle printed last Monday, the price moved lower the next day due to the market reaction after the CPI was announced in the US. A temporary boost occurred on the US dollar that didn't last long, as since last Wednesday, the market bounced off, and the price moved upwards. The market is trending downwards as the price makes lower highs and lower lows. The price is trading below all three moving averages, which is a bearish indication. The RSI is below 50, which is also a bearish indication. If the price reverses and shifts to the downside, the first support area, S1, is approximately 1.07234.
If it penetrates it and moves lower, the next support, S2, is the area of 1.06562.
Conversely, if the price moves upwards, the first resistance, R1, is around 1.08055. That level also consists of the 20-period and 200-period moving averages, adding weight to the R1 weekly resistance. A penetration and a move above the R1 meet the R2 weekly resistance of around 1.08977.
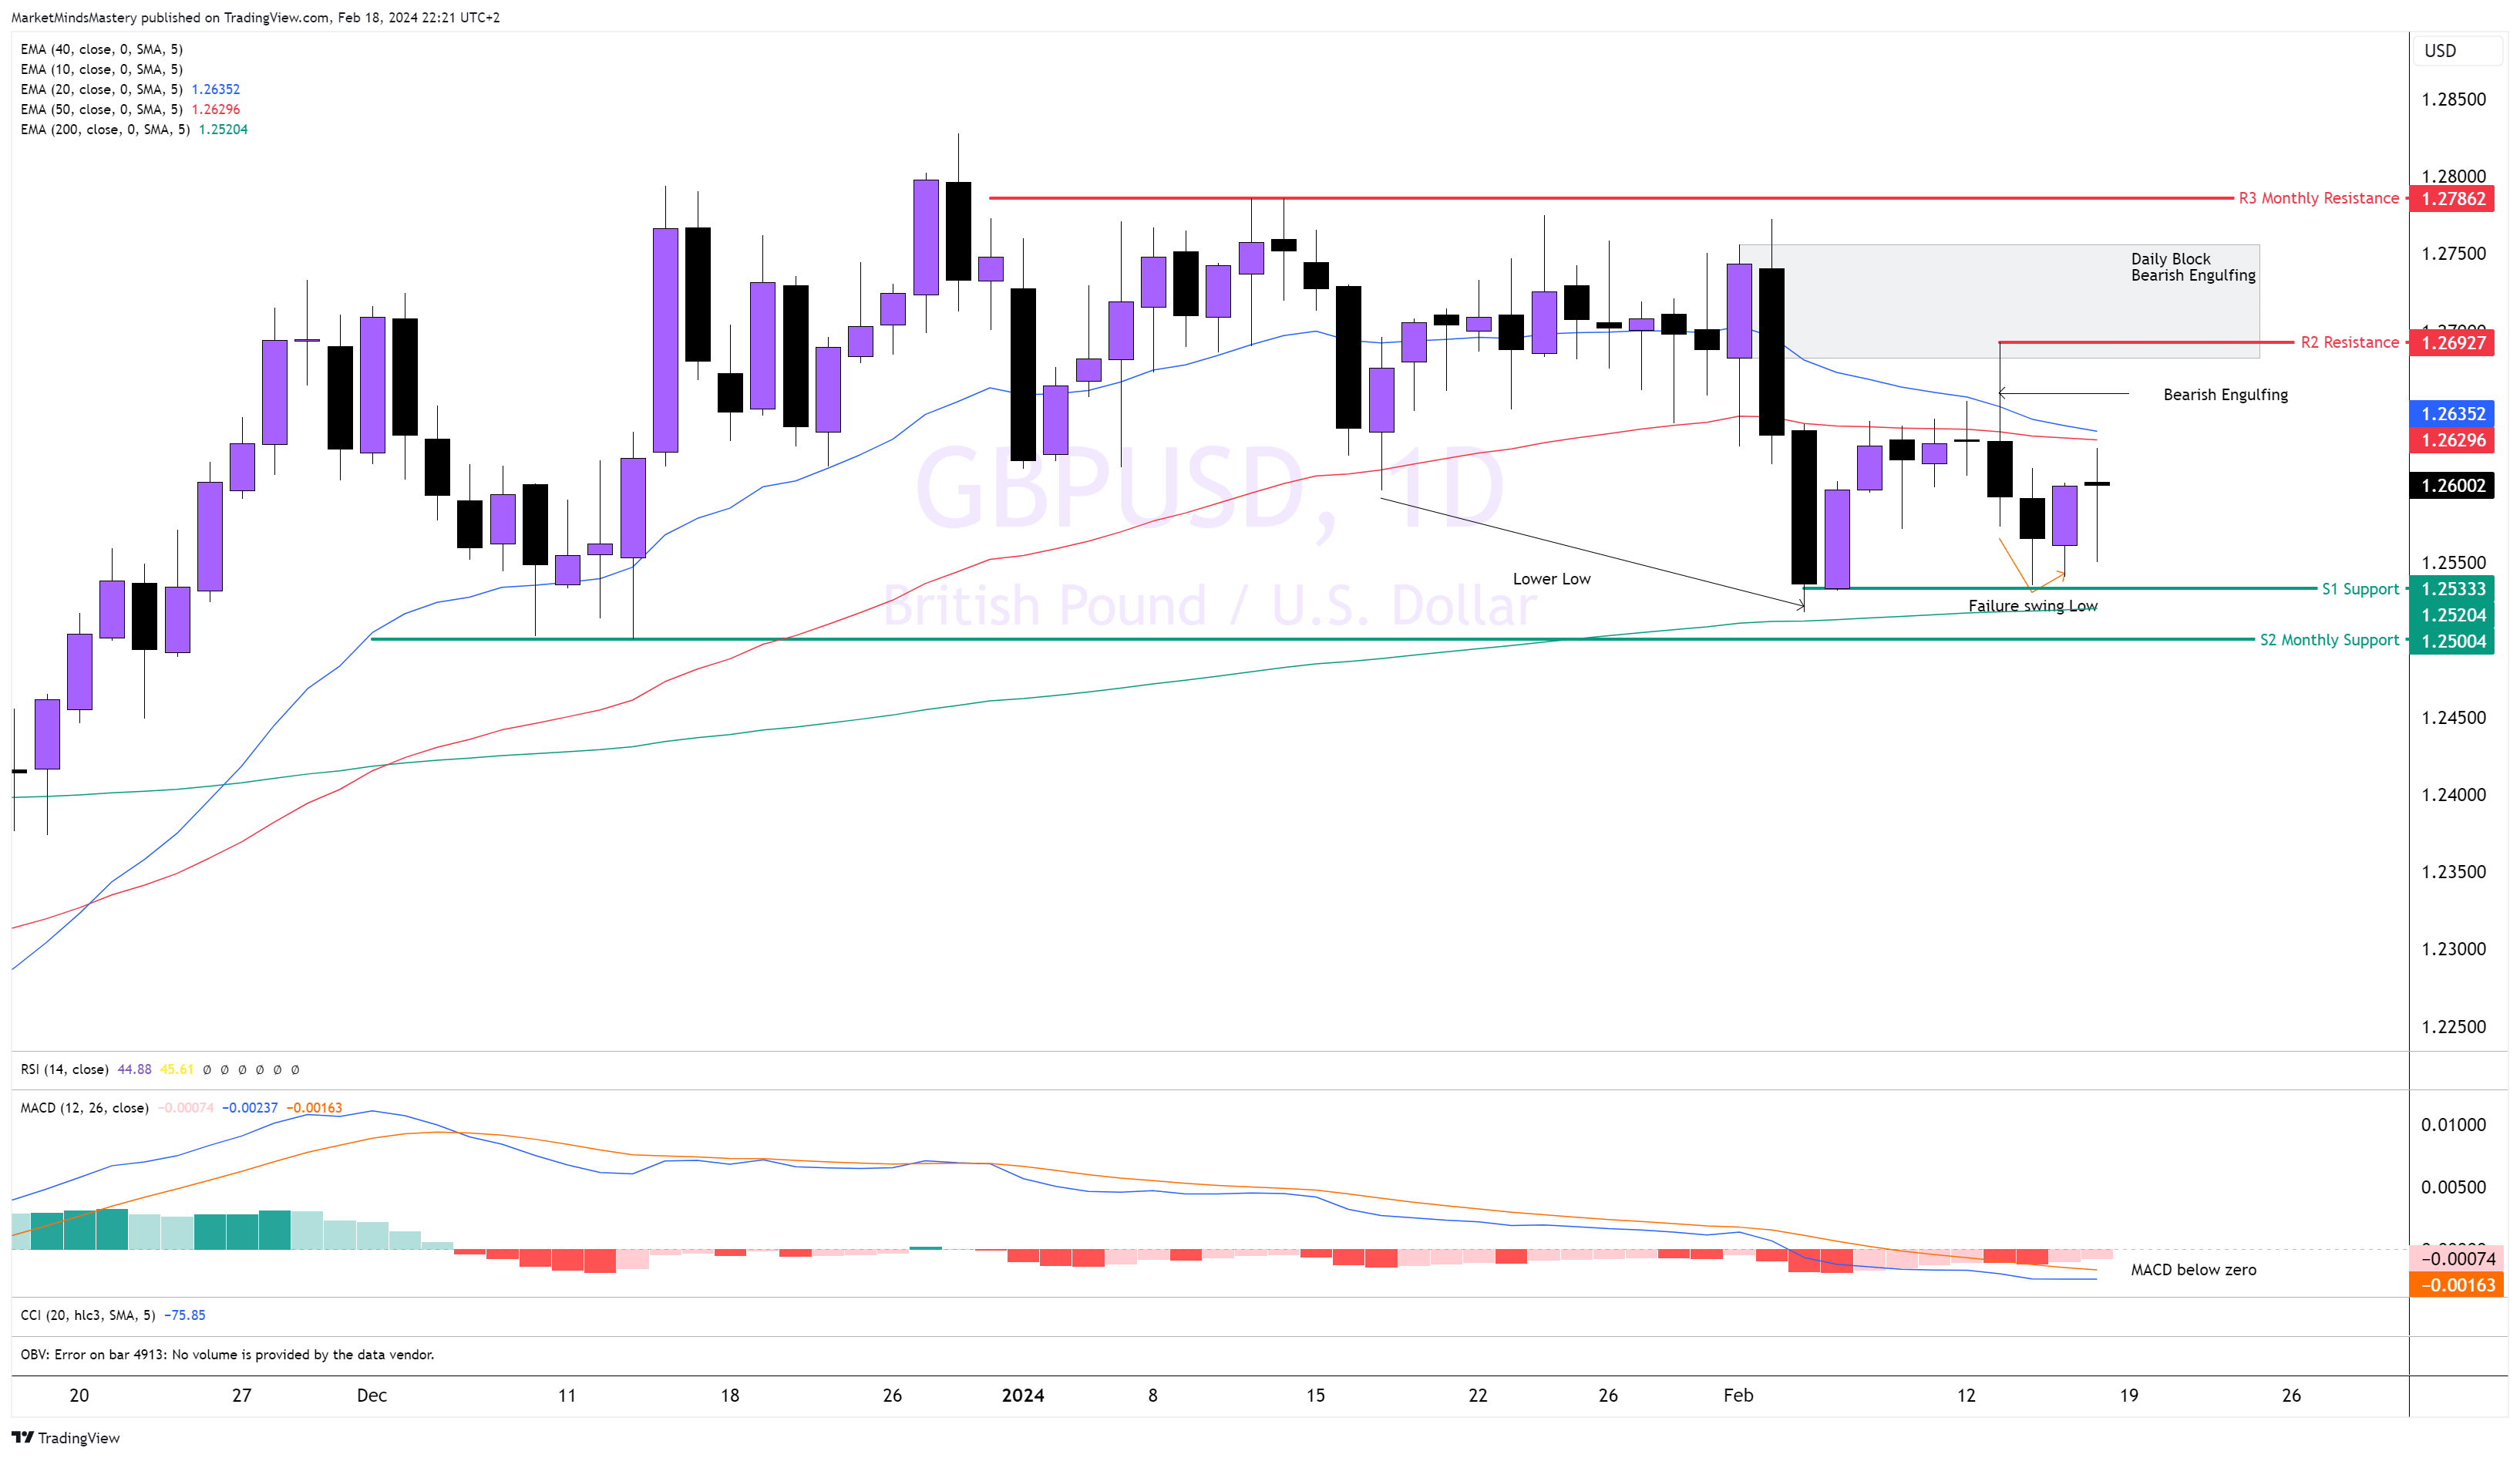
GBPUSD, Daily
The price on the daily chart is trading within a consolidation phase, or, in other words, the market is not trending, as there are no consecutive series of highs and lows. An attempt of the price to create a low, lower than the 1.2530, failed last week, and a failure swing was created. The MACD is below zero, and this is a bearish indication. However, the 20-period is above the 50-period moving average, which is bullish.
If the price moves upwards, the first dynamic resistance area is the 20-period and 50-period moving averages. If the price penetrates the moving averages, the next resistance is static, R2, and it is the high of the bearish engulfing printed during the CPI news last Tuesday, approximately 1.26927. A move higher than that can find the next resistance, R3, around the 1.27862 level. Opposivly, if the price moves lower, the S1 support is around 1.25333. Only 10 pips below is the 200-period moving average and can act as a dynamic support.
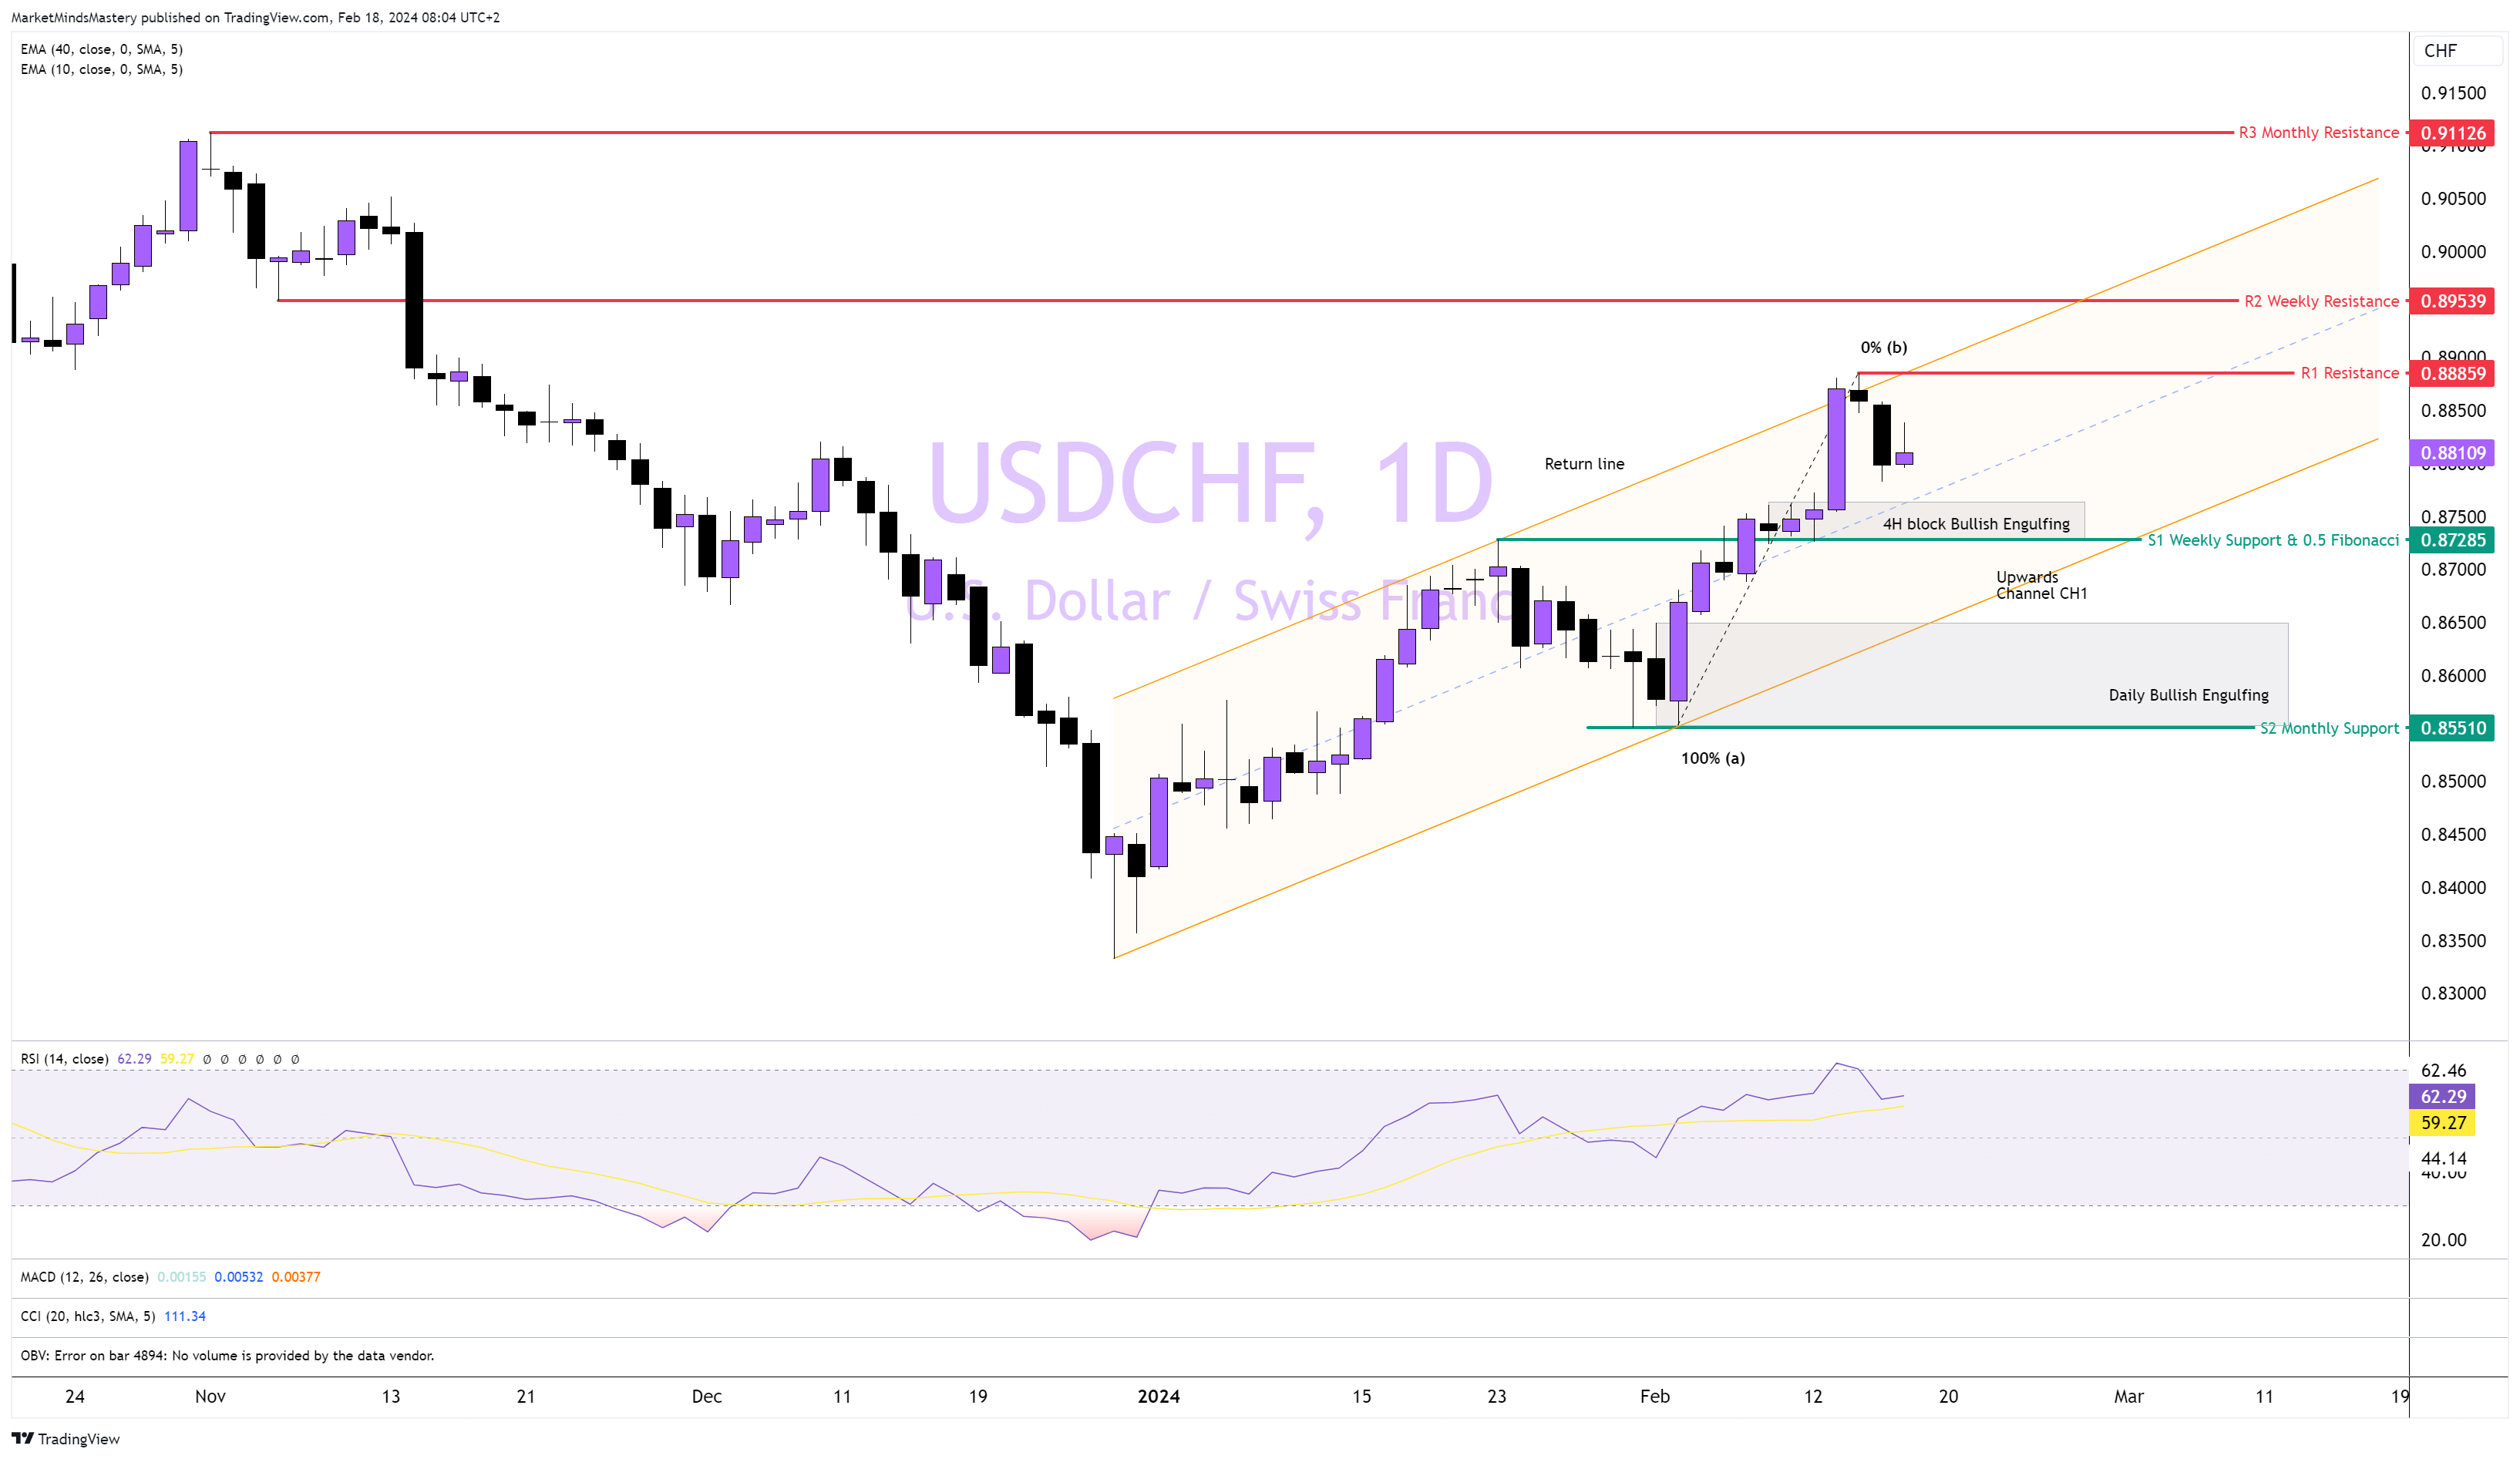
USDCHF Daily
The weakness of the Swiss Franc over the last few weeks helped the price create a series of higher highs and higher lows, pointing to an uptrend. The price is trading within an upward channel of CH1. The upper part of the channel (return line) was tested last week, and the price entered a correction phase. If the price decreases, the first area of support, S1, is a weekly level consisting of a 0.5 Fibonacci level from point (a) to (b), as shown on the chart. Also, around that area, a 4H block was founded. If the price afterwards declines further, the upward channel can act as a support for the price. If the price penetrates the CH1 and moves lower, the next support area, S2, is a monthly low of around 0.85510.
If the price moves upwards, the most recent swing high around 0.88859 is the first R1 resistance. If the price breaks and moves higher, the next resistance, R2, is approximately 0.89539.
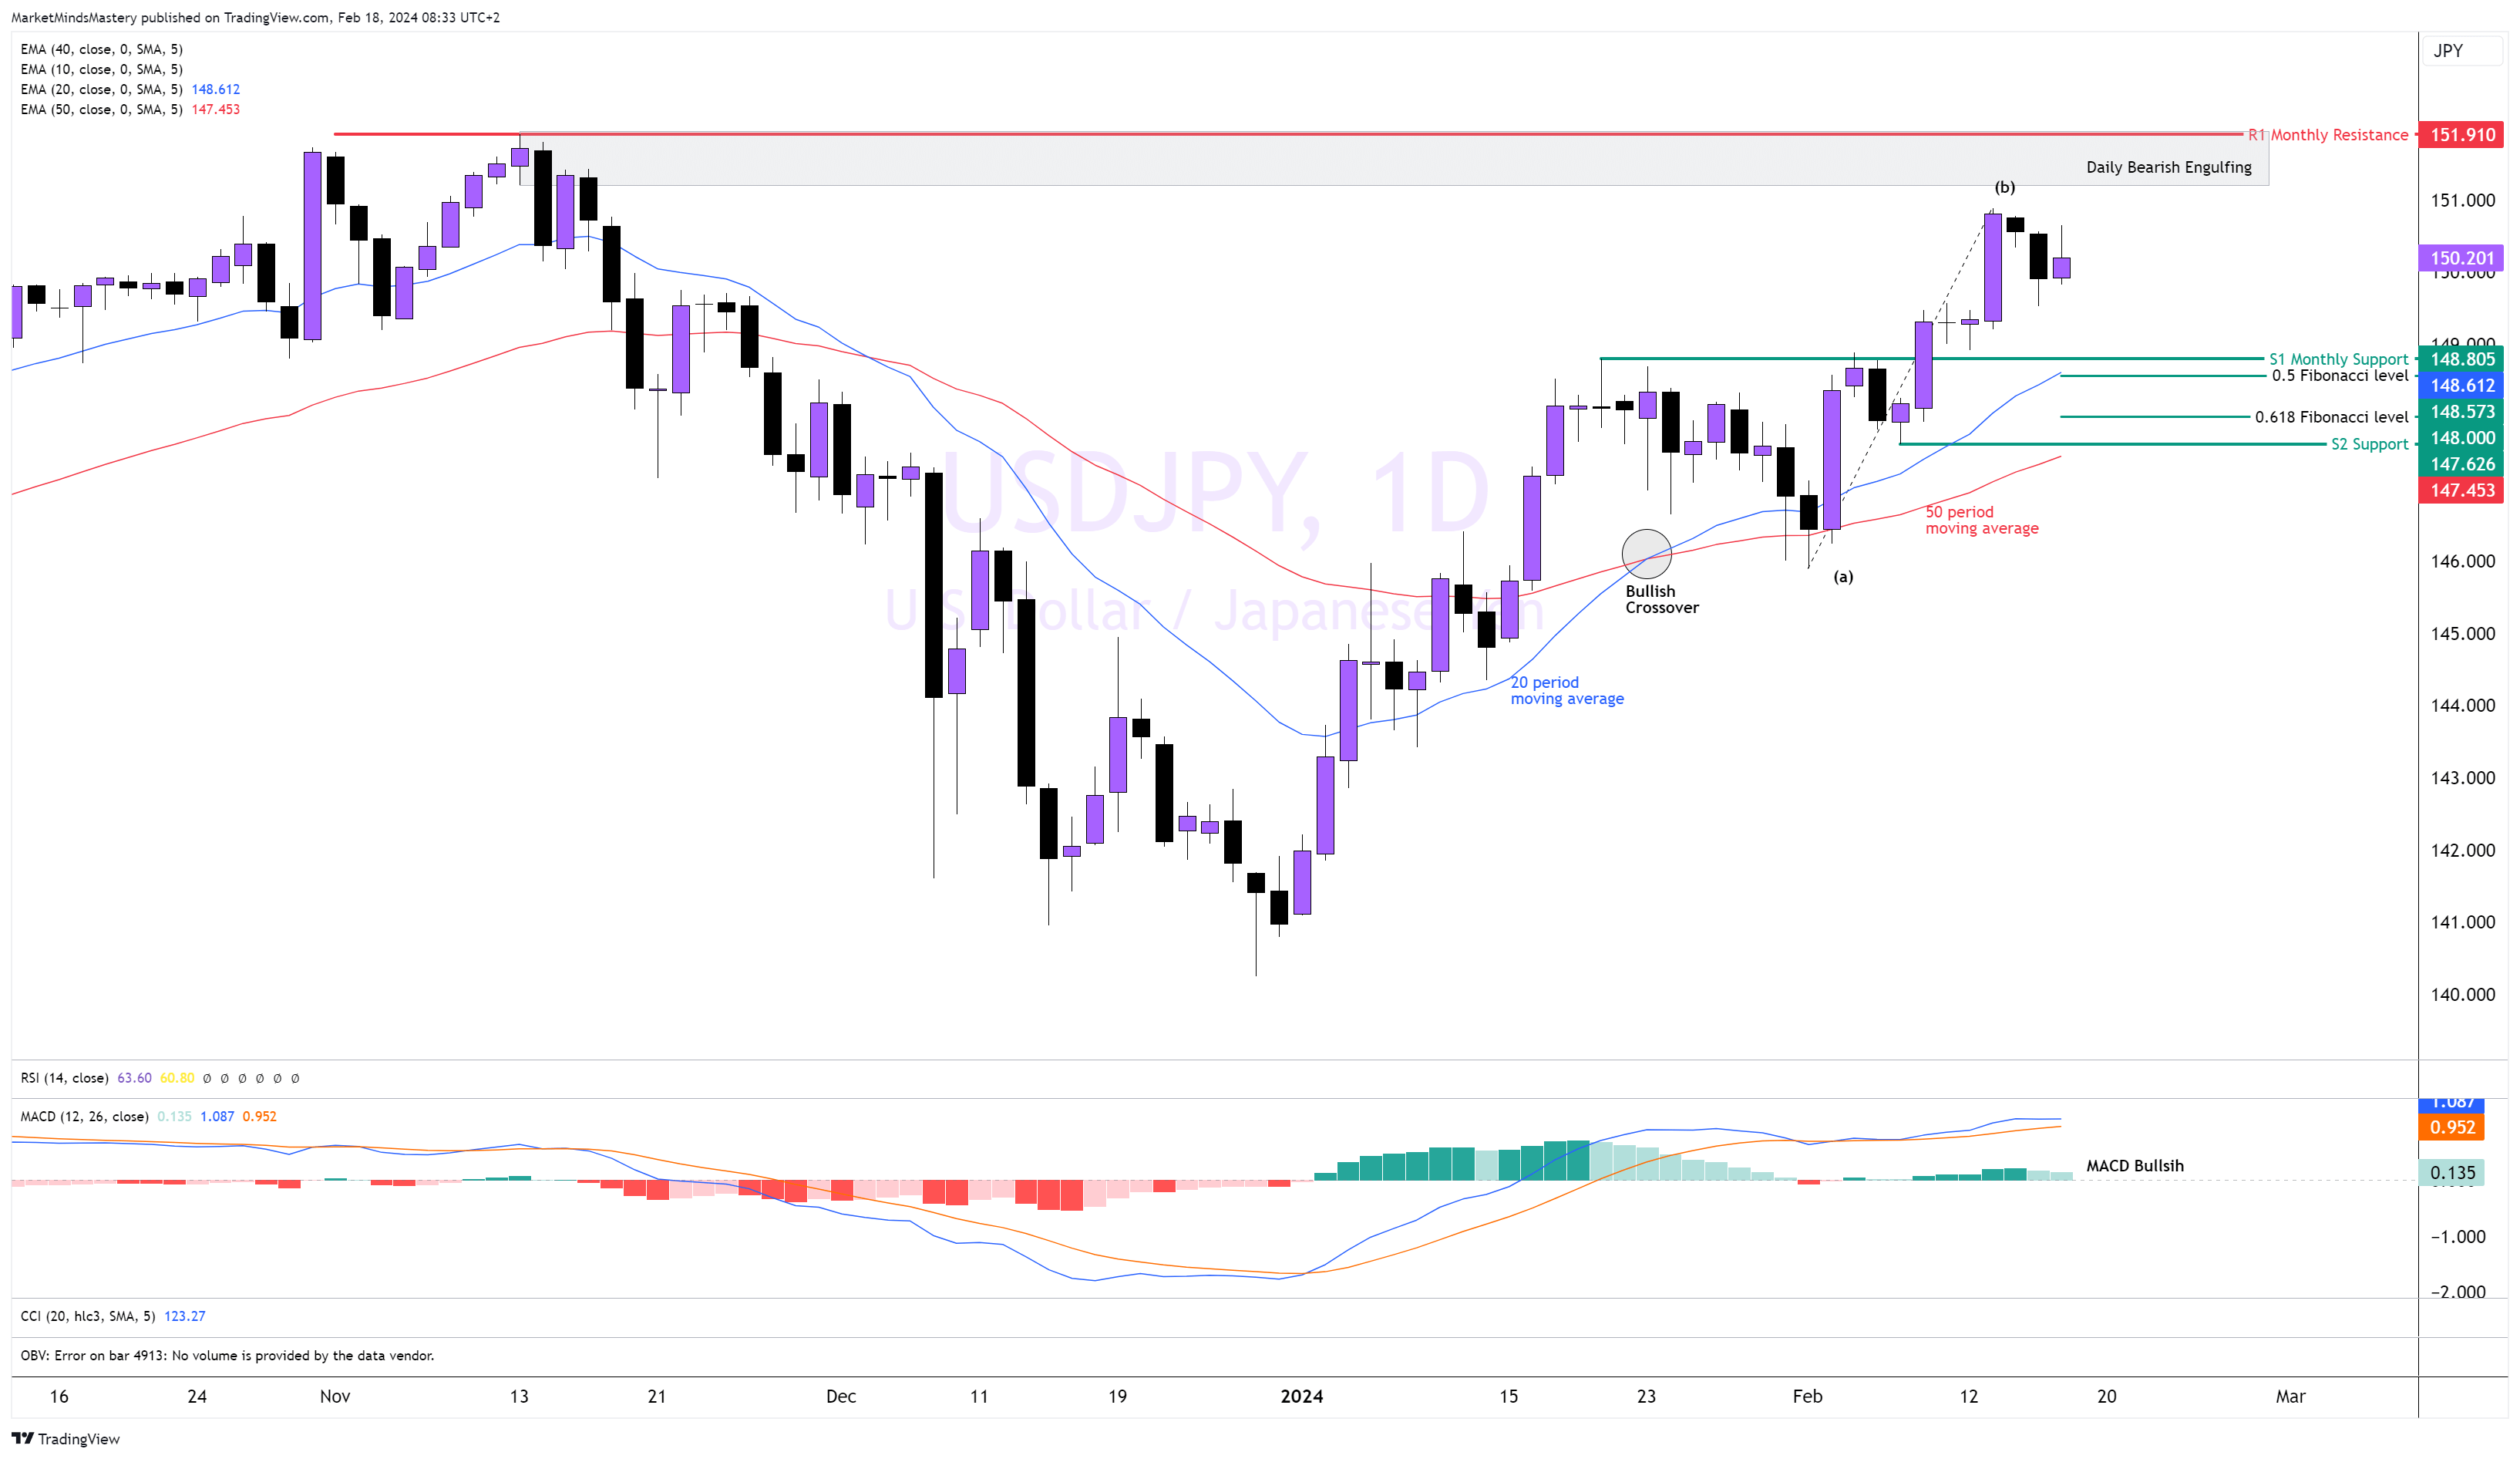
USDJPY Daily
The price on the Daily chart is moving upwards as per the series of higher highs and higher lows and as the bullish cross that occurred since the last month. The MACD is above the zero line, and the MACD line is above the Signal line, which are bullish indications. As the price is in an uptrend, we can use the Fibonacci retracement tool to mark possible areas of support. Currently, the price has entered a correction phase, and if it continues moving lower, the first area of support, S1, is a monthly support of around 148.80. This level is close to the 0.5 level of the Fibonacci number. If the price penetrates it and moves lower, the next support area is around 147.62. The Fibonacci Golden number 0.618 is around the 148 price level. The 20 and 50-period moving averages can act as dynamic support. If the price bounces off and moves higher, the first resistance area, R1, is the last month’s high, around 151.91.
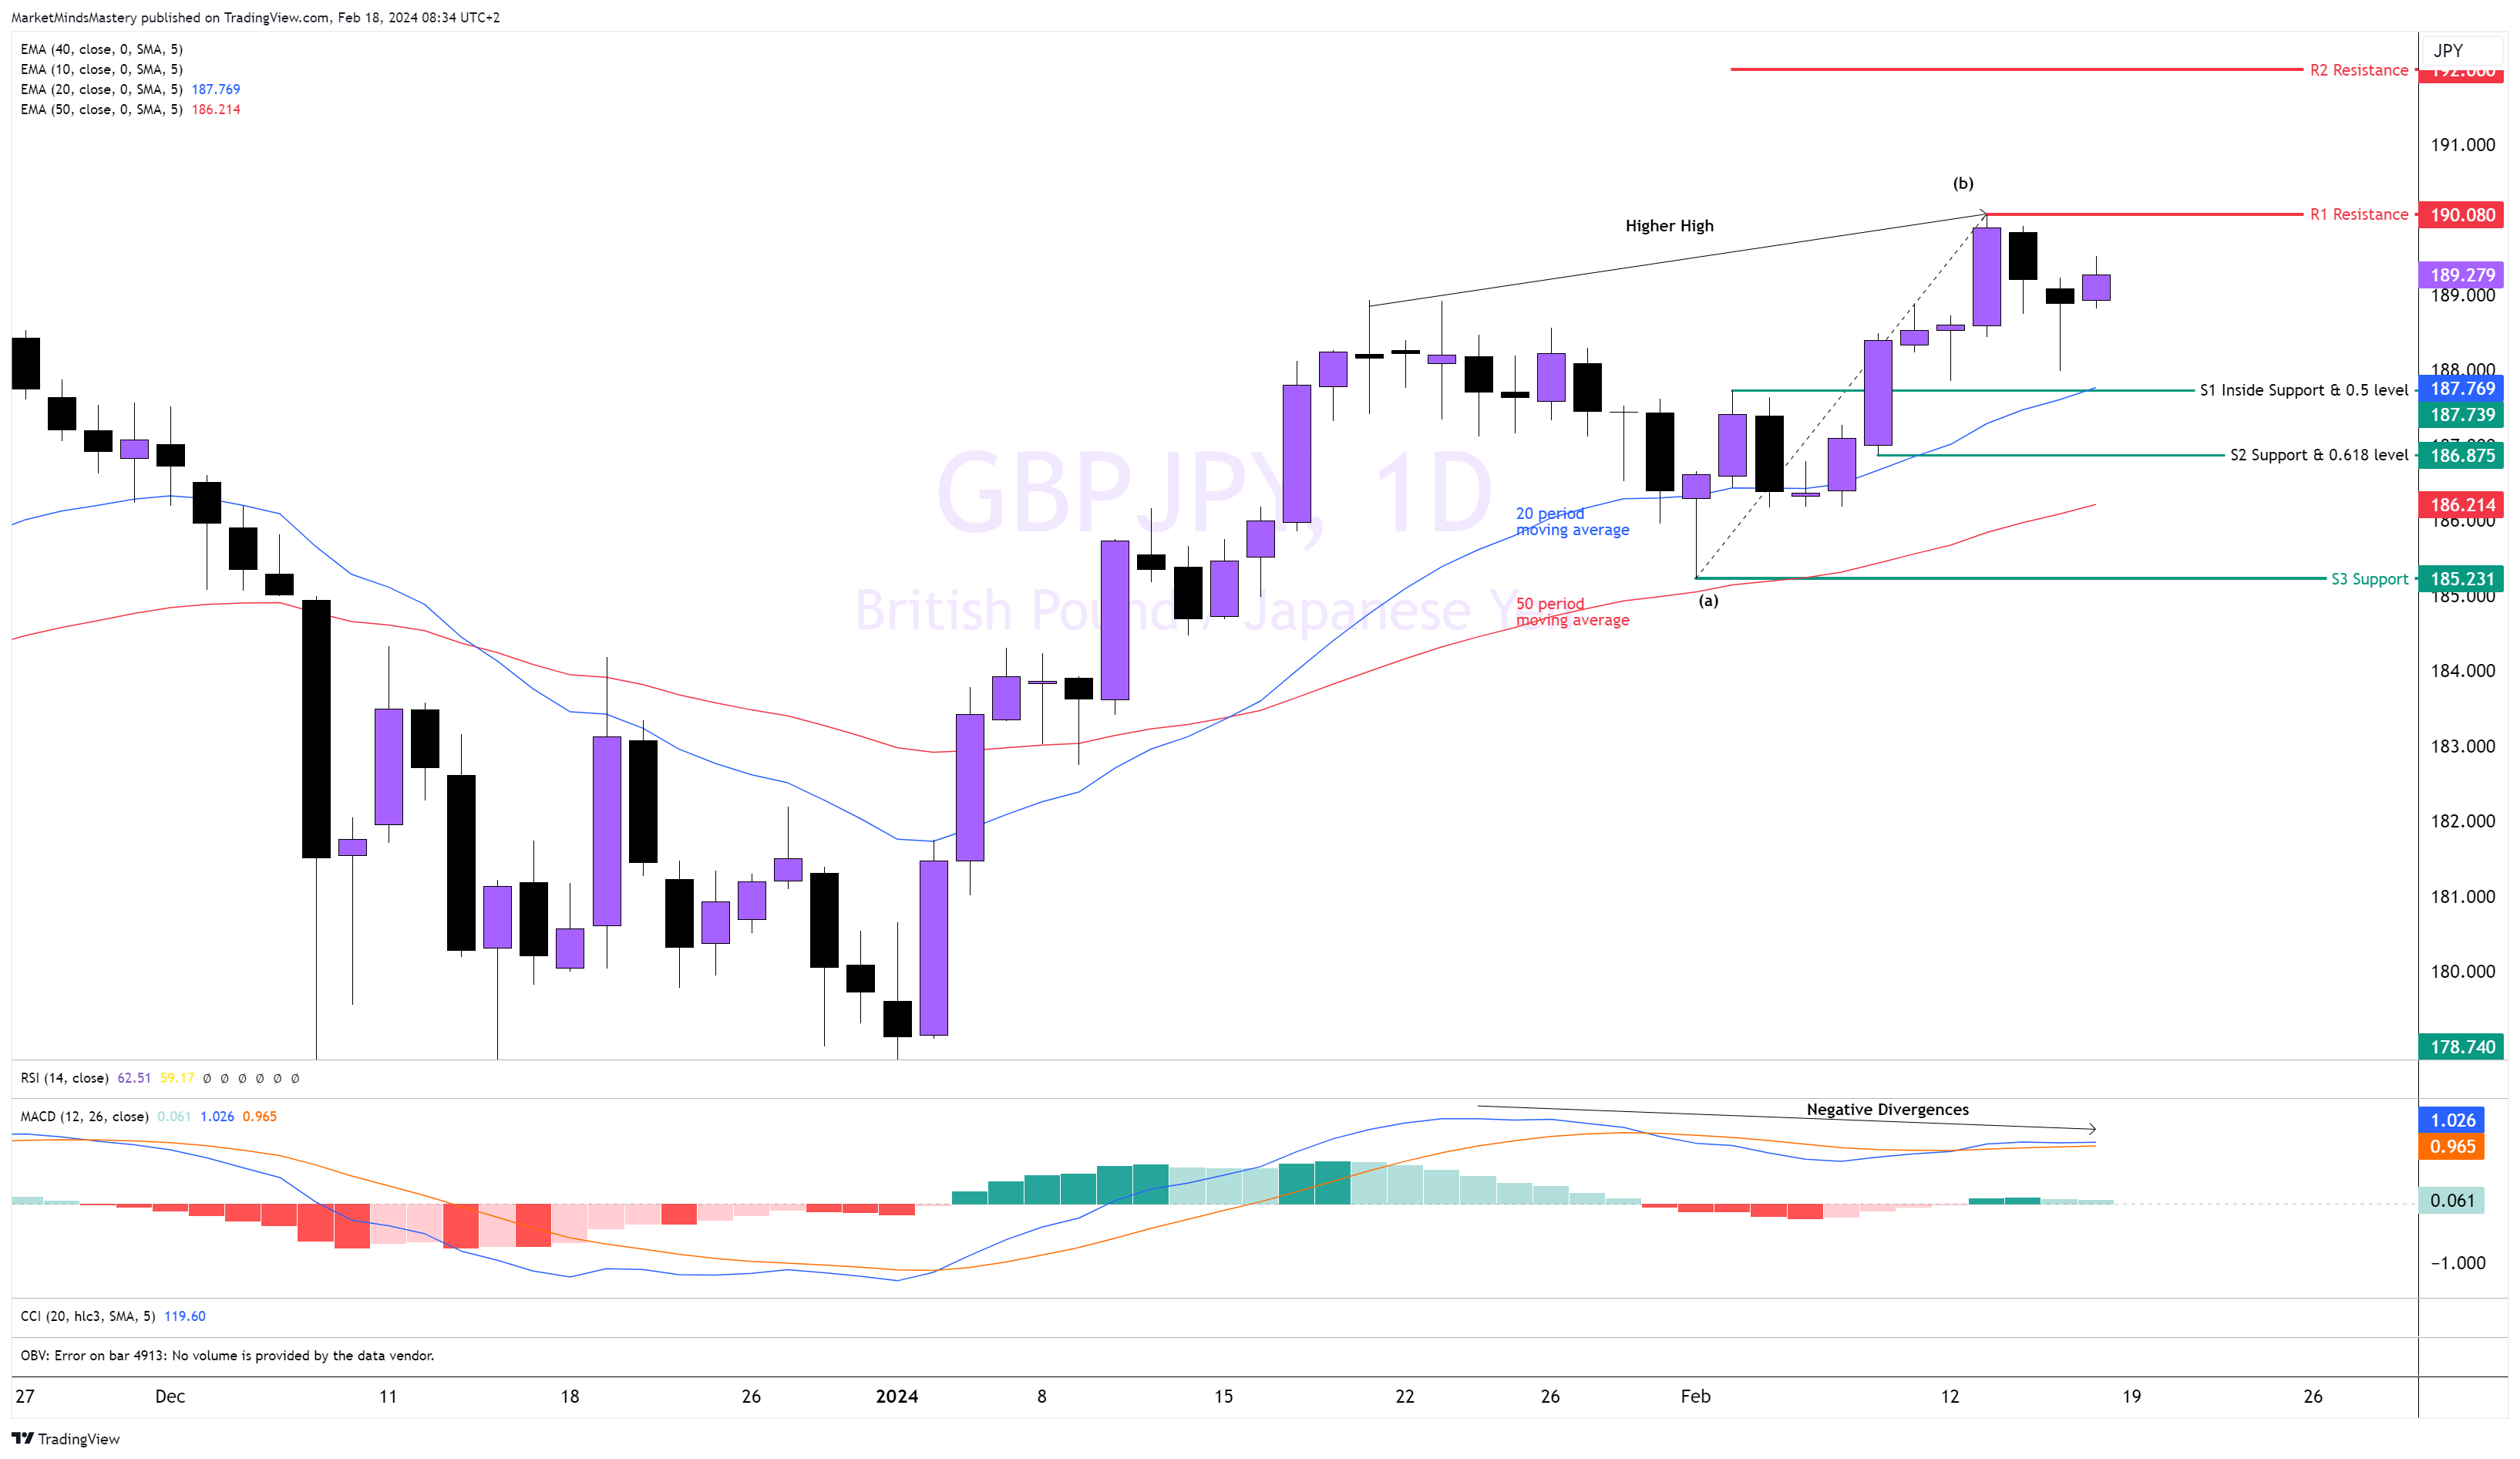
GBPJPY Daily
The price created a higher high, and the MACD didn’t follow through, producing a lower high. This disagreement shows a lack of momentum on the last upward move. If the price continues increasing, the first resistance area, R1, becomes the most recent swing high, around the 190 price level. If the price decisively penetrates the R1 and closes above it, the next resistance area, R2, is around 192. If the price declines and moves lower, the first area of support, S1, is also inside support, as per the chart around 187.739, consisting of the Fibonacci retracement of 50% from the swing point at (a) to point (b). If the price continues moving lower, the next support, S2, is approximately the 186.87 level, consisting of the Fibonacci Golder ratio of 61.8%.
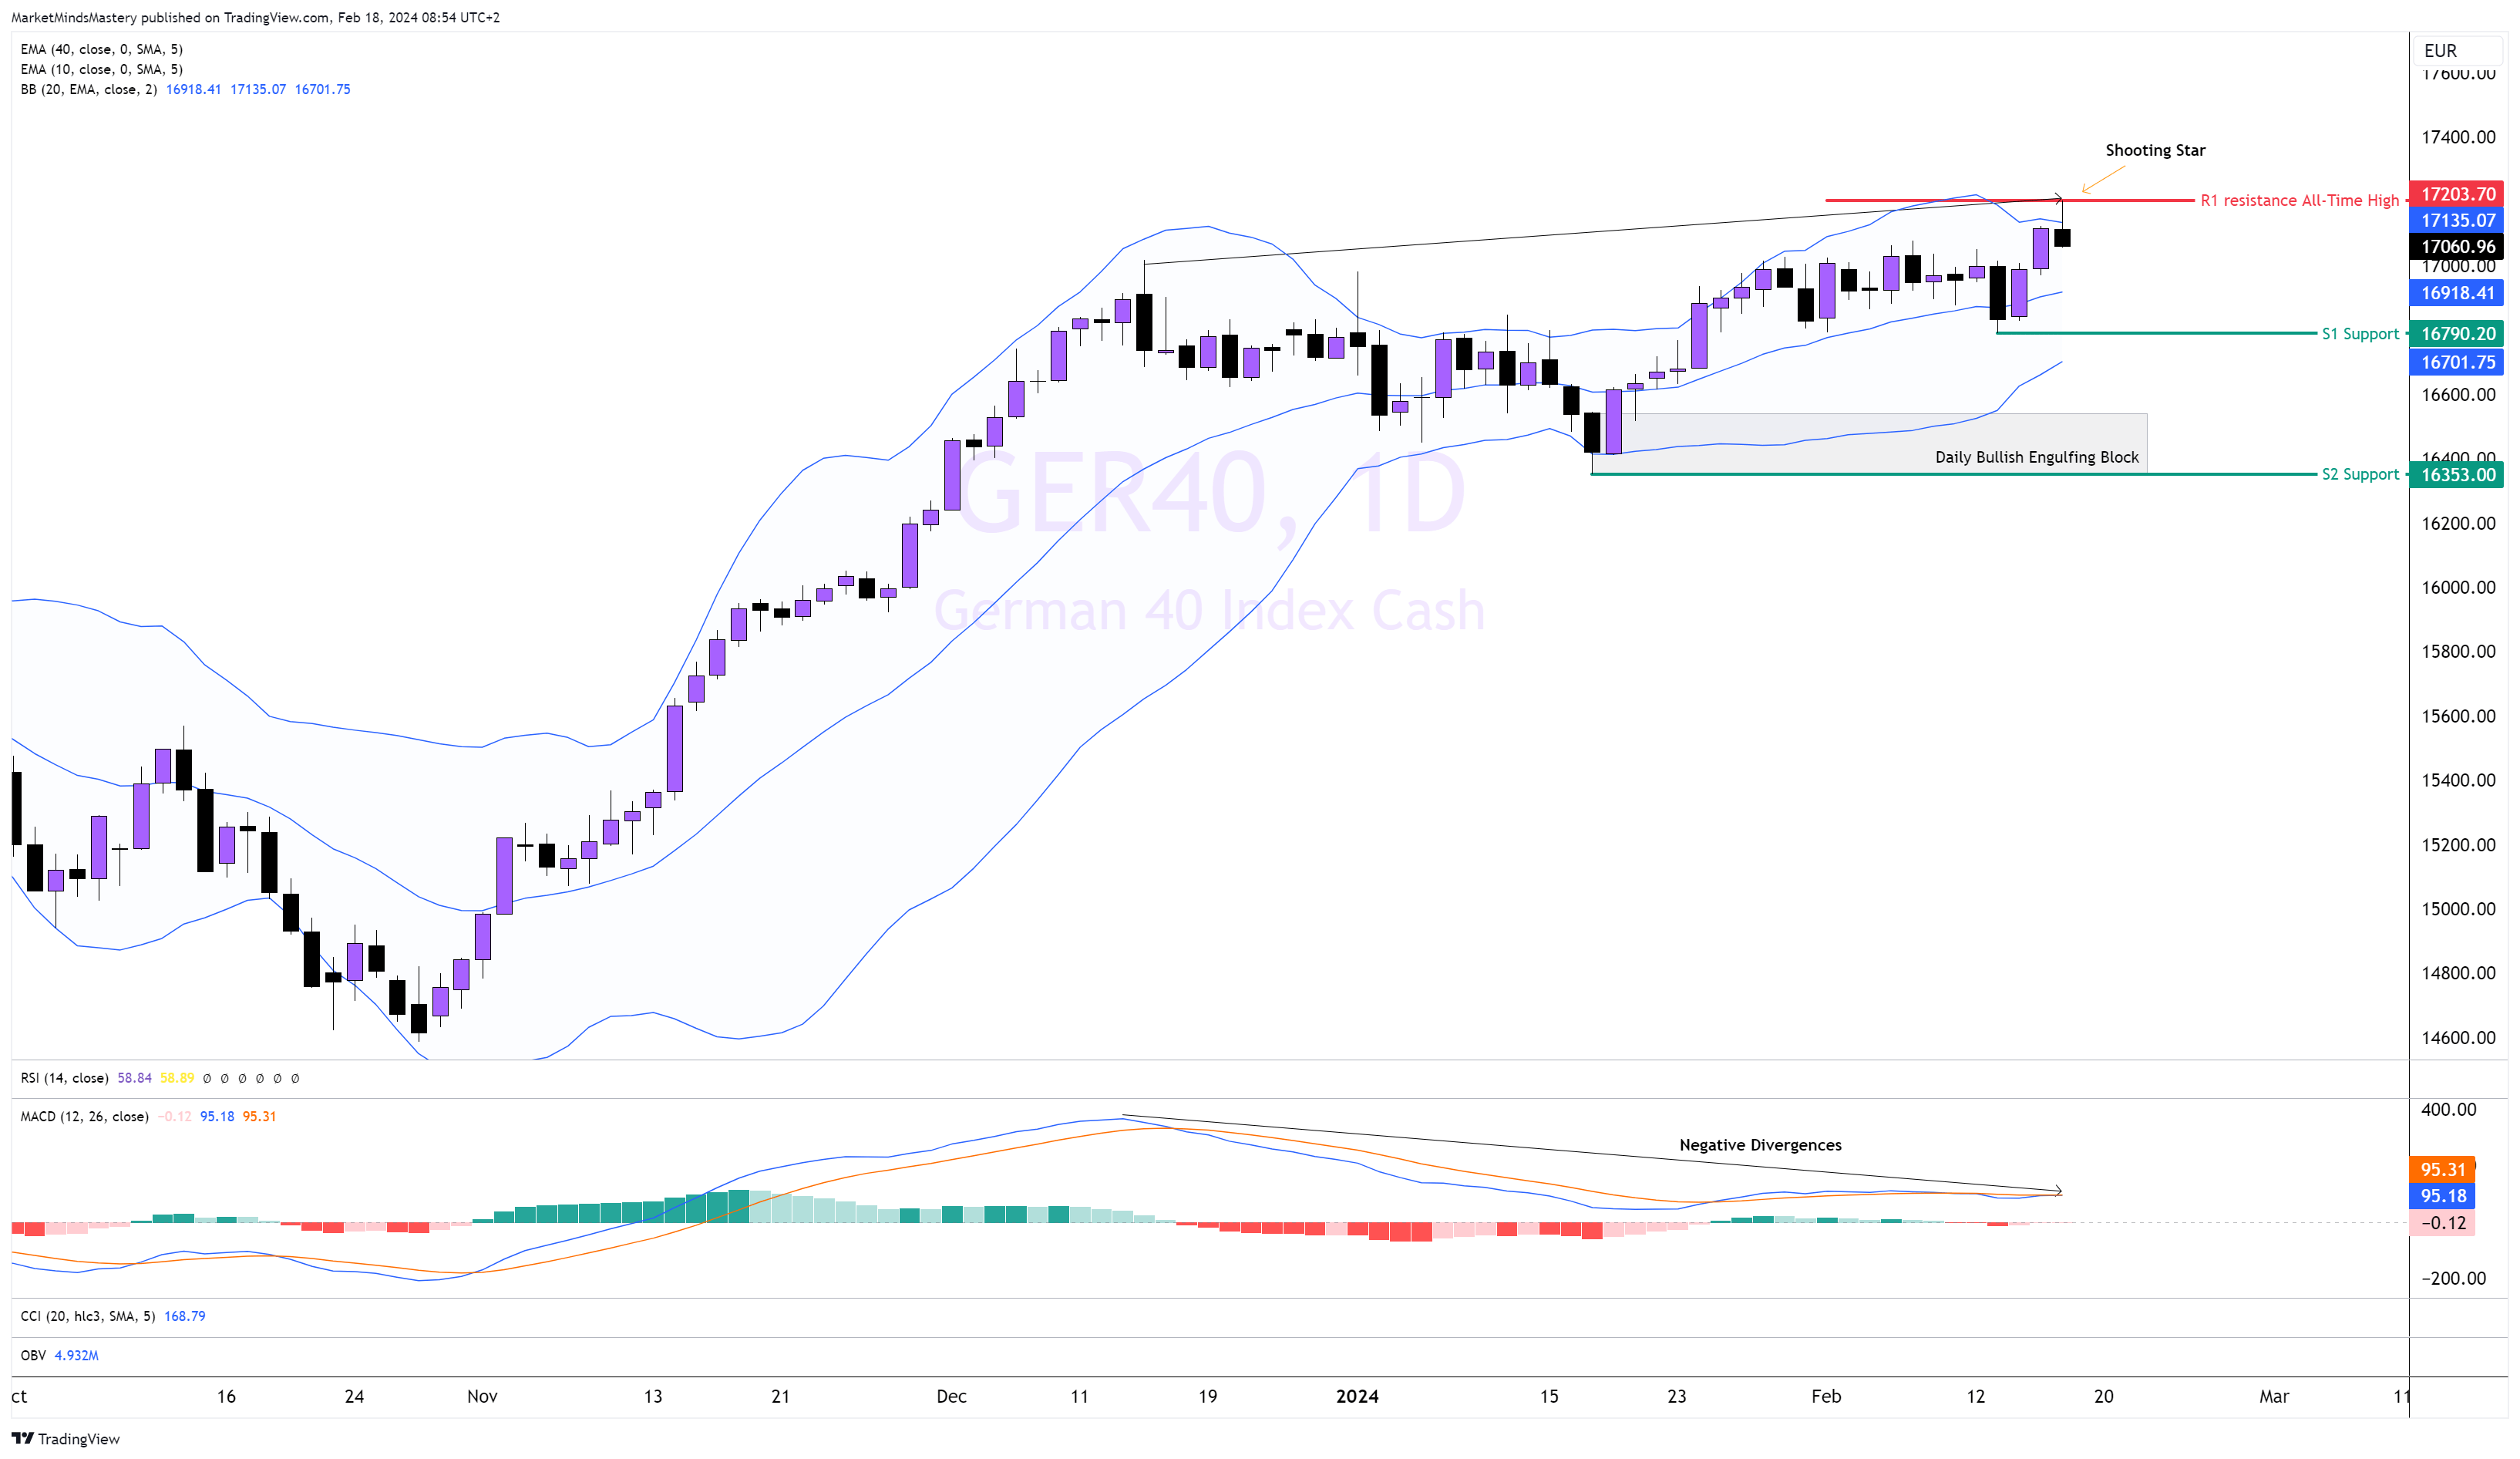
GER40, Daily
Following the price consolidation, the GER40 bounced off the 20-period moving average last week and pushed upwards, registering a new all-time high price of around 17200. It ended last week with a shooting star reversal candle last Friday. Both the upper and lower bands are contracting, indicating weakness in the price to rally. The long-term bearish divergences on the MACD are still valid. If the price declines and moves lower, the first support S1 is found to be around the 16790 area. A penetration and move below can see the following support S2 approximately at the region of 16353. This is the lowest price level that the price traded in the past and formed a bullish engulfing block on the daily chart.
Conversely, if the price moves upwards, the all-time-high price can act as the R1 resistance.
A break and move above it can find the price creating a new all-time high. A round number like the 17400 and 17500 can be expected to become the new resistances.
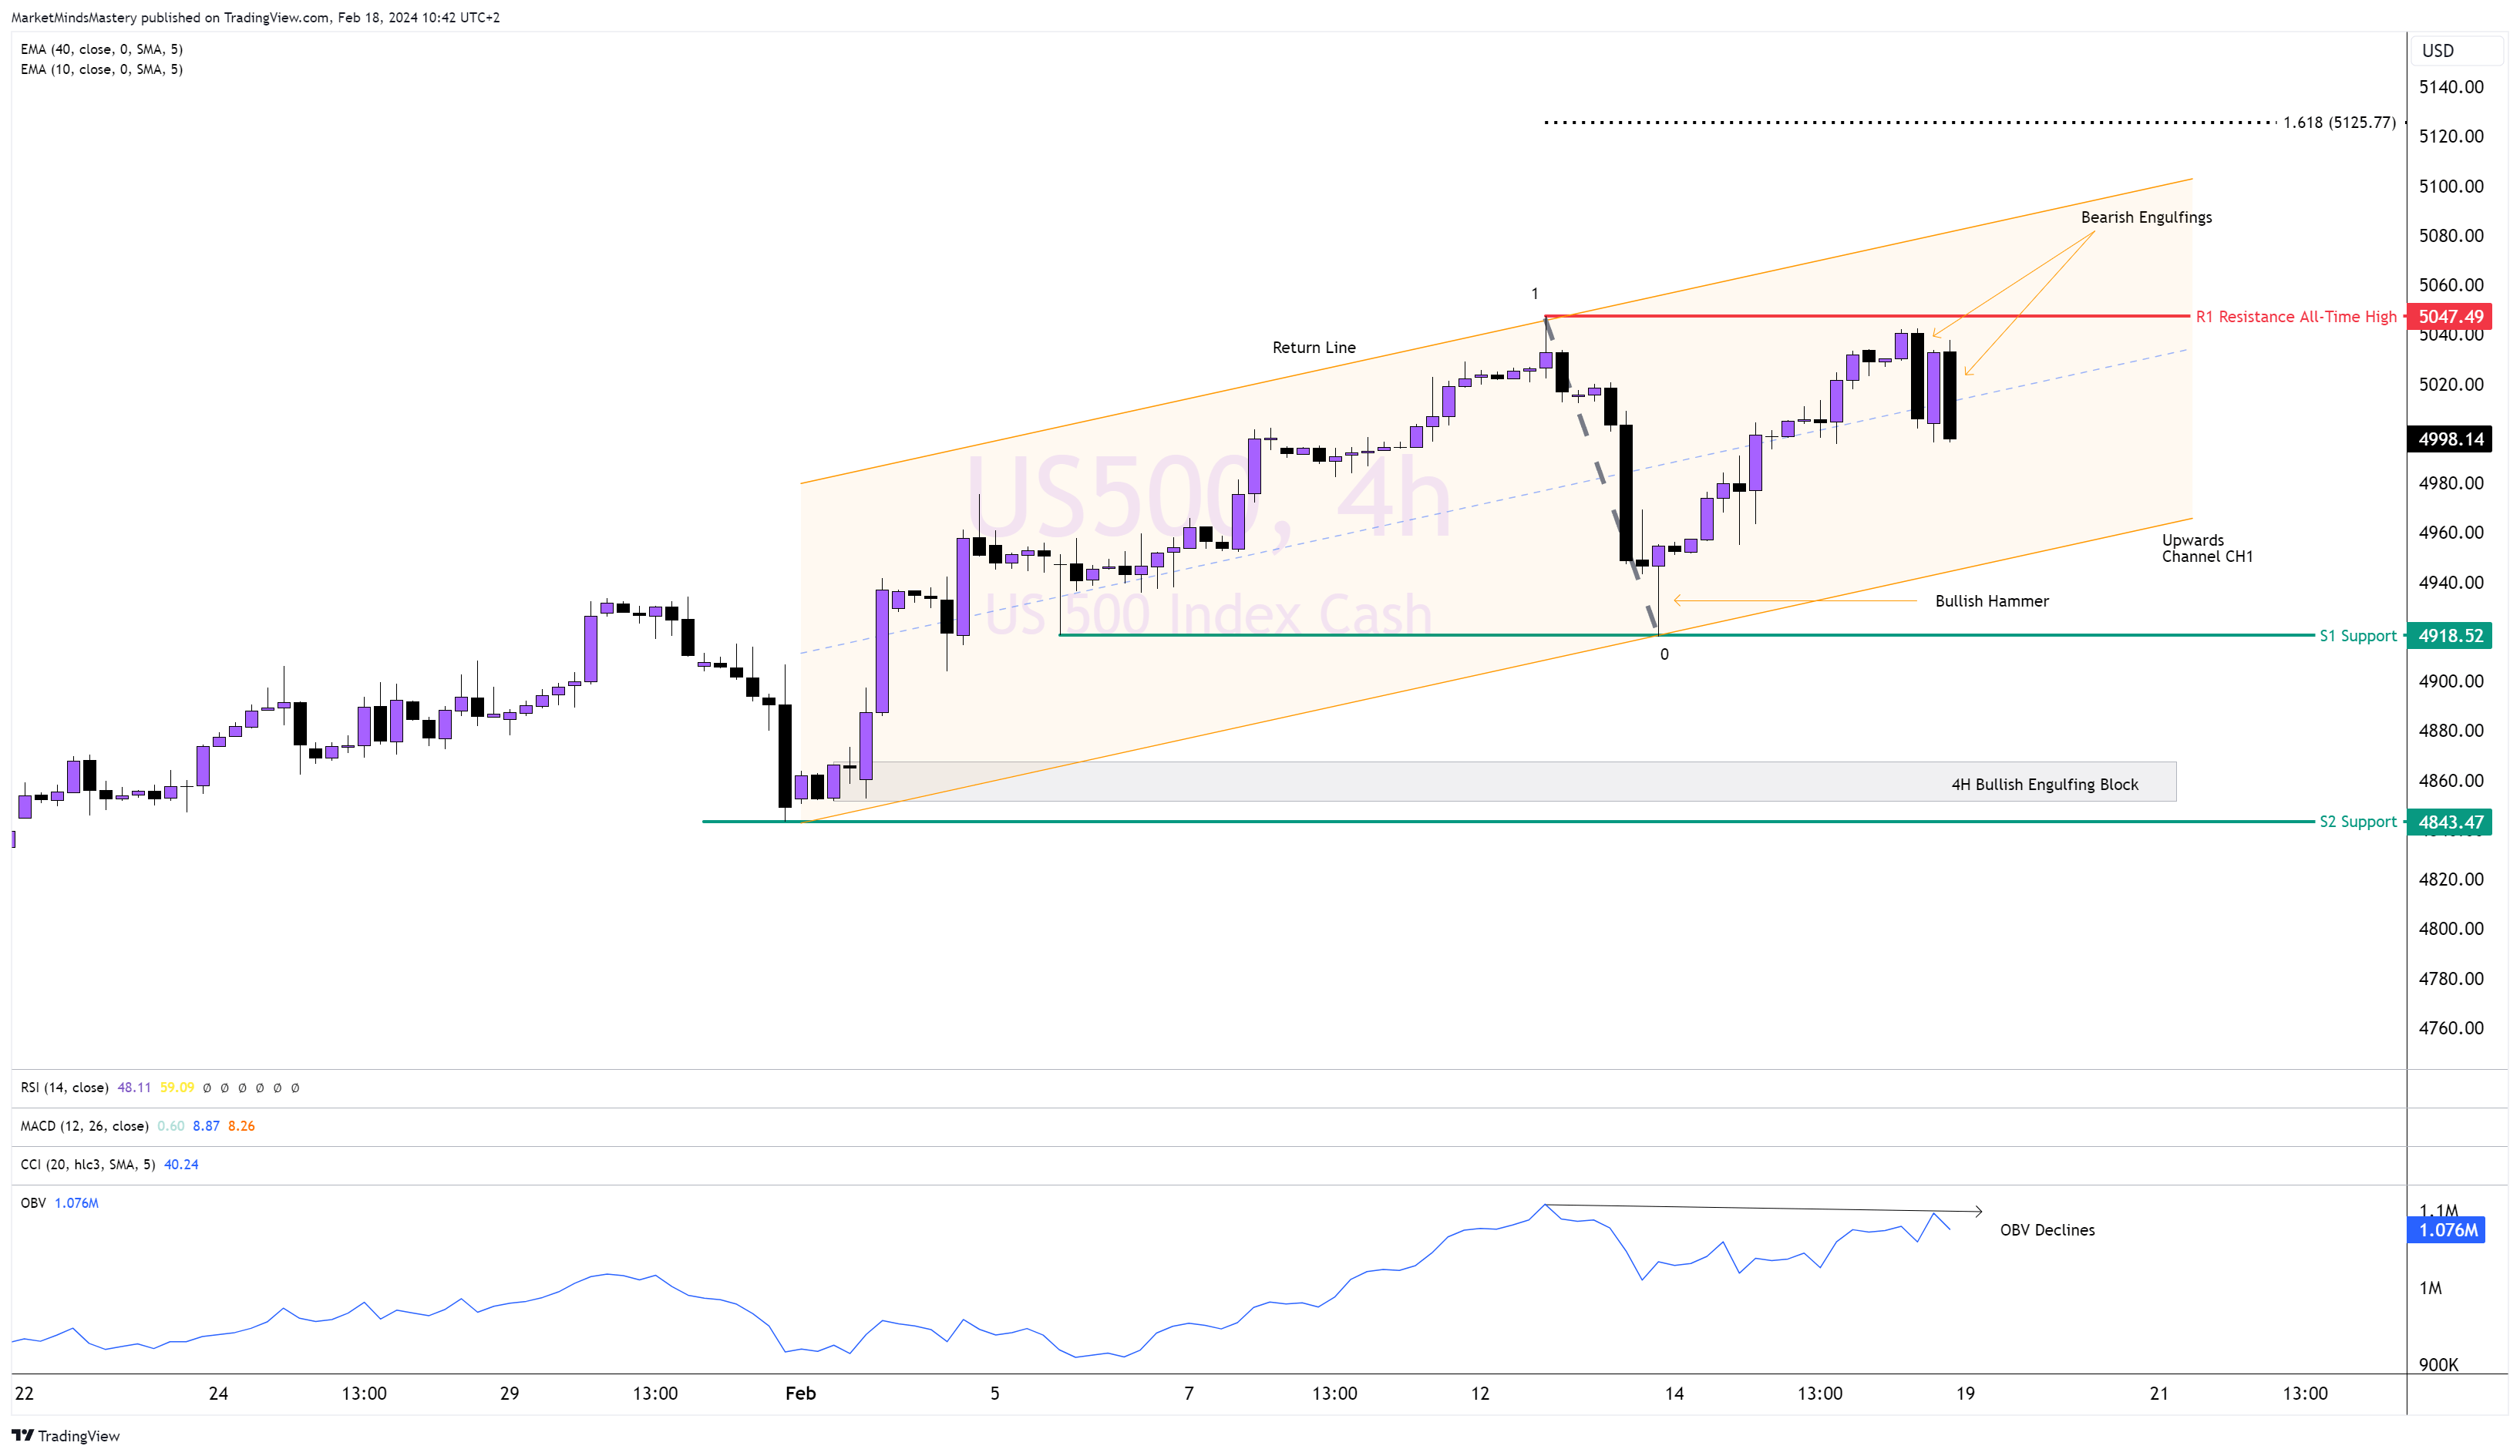
SP500, 4H
Following the long-term uptrend, last week's price created a new all-time high, above the 5000 level and then retraced backwards. The price then found support at the S1 around the 4918 and bounced off. Therefore, an upward channel, CH1, is created—the price has since tried to make a new high and failed just below the R1 resistance. The price declined, and two bearish engulfings with long bodies were printed. At the same time, the On Balance Volume indicator declined, which is a bearish indication. If the price moves lower, the upward trendline of channel CH1 can act as support. The following static support, S1, is approximately the 4918 level. If the price keeps declining and moves below the S1, the next area of support, S2, is around 4843. At this level, as shown on the chart, multiple bullish engulfing blocks were created by the price, making this level significant for the time being.
On the other hand, if the price moves upwards, the R1 resistance around the 5047 area can act as the first obstacle for the price to move higher. Moving above the R1 will create a new all-time high, and we can mark the 1.618 Fibonacci extension and the next area of resistance at around 5125.
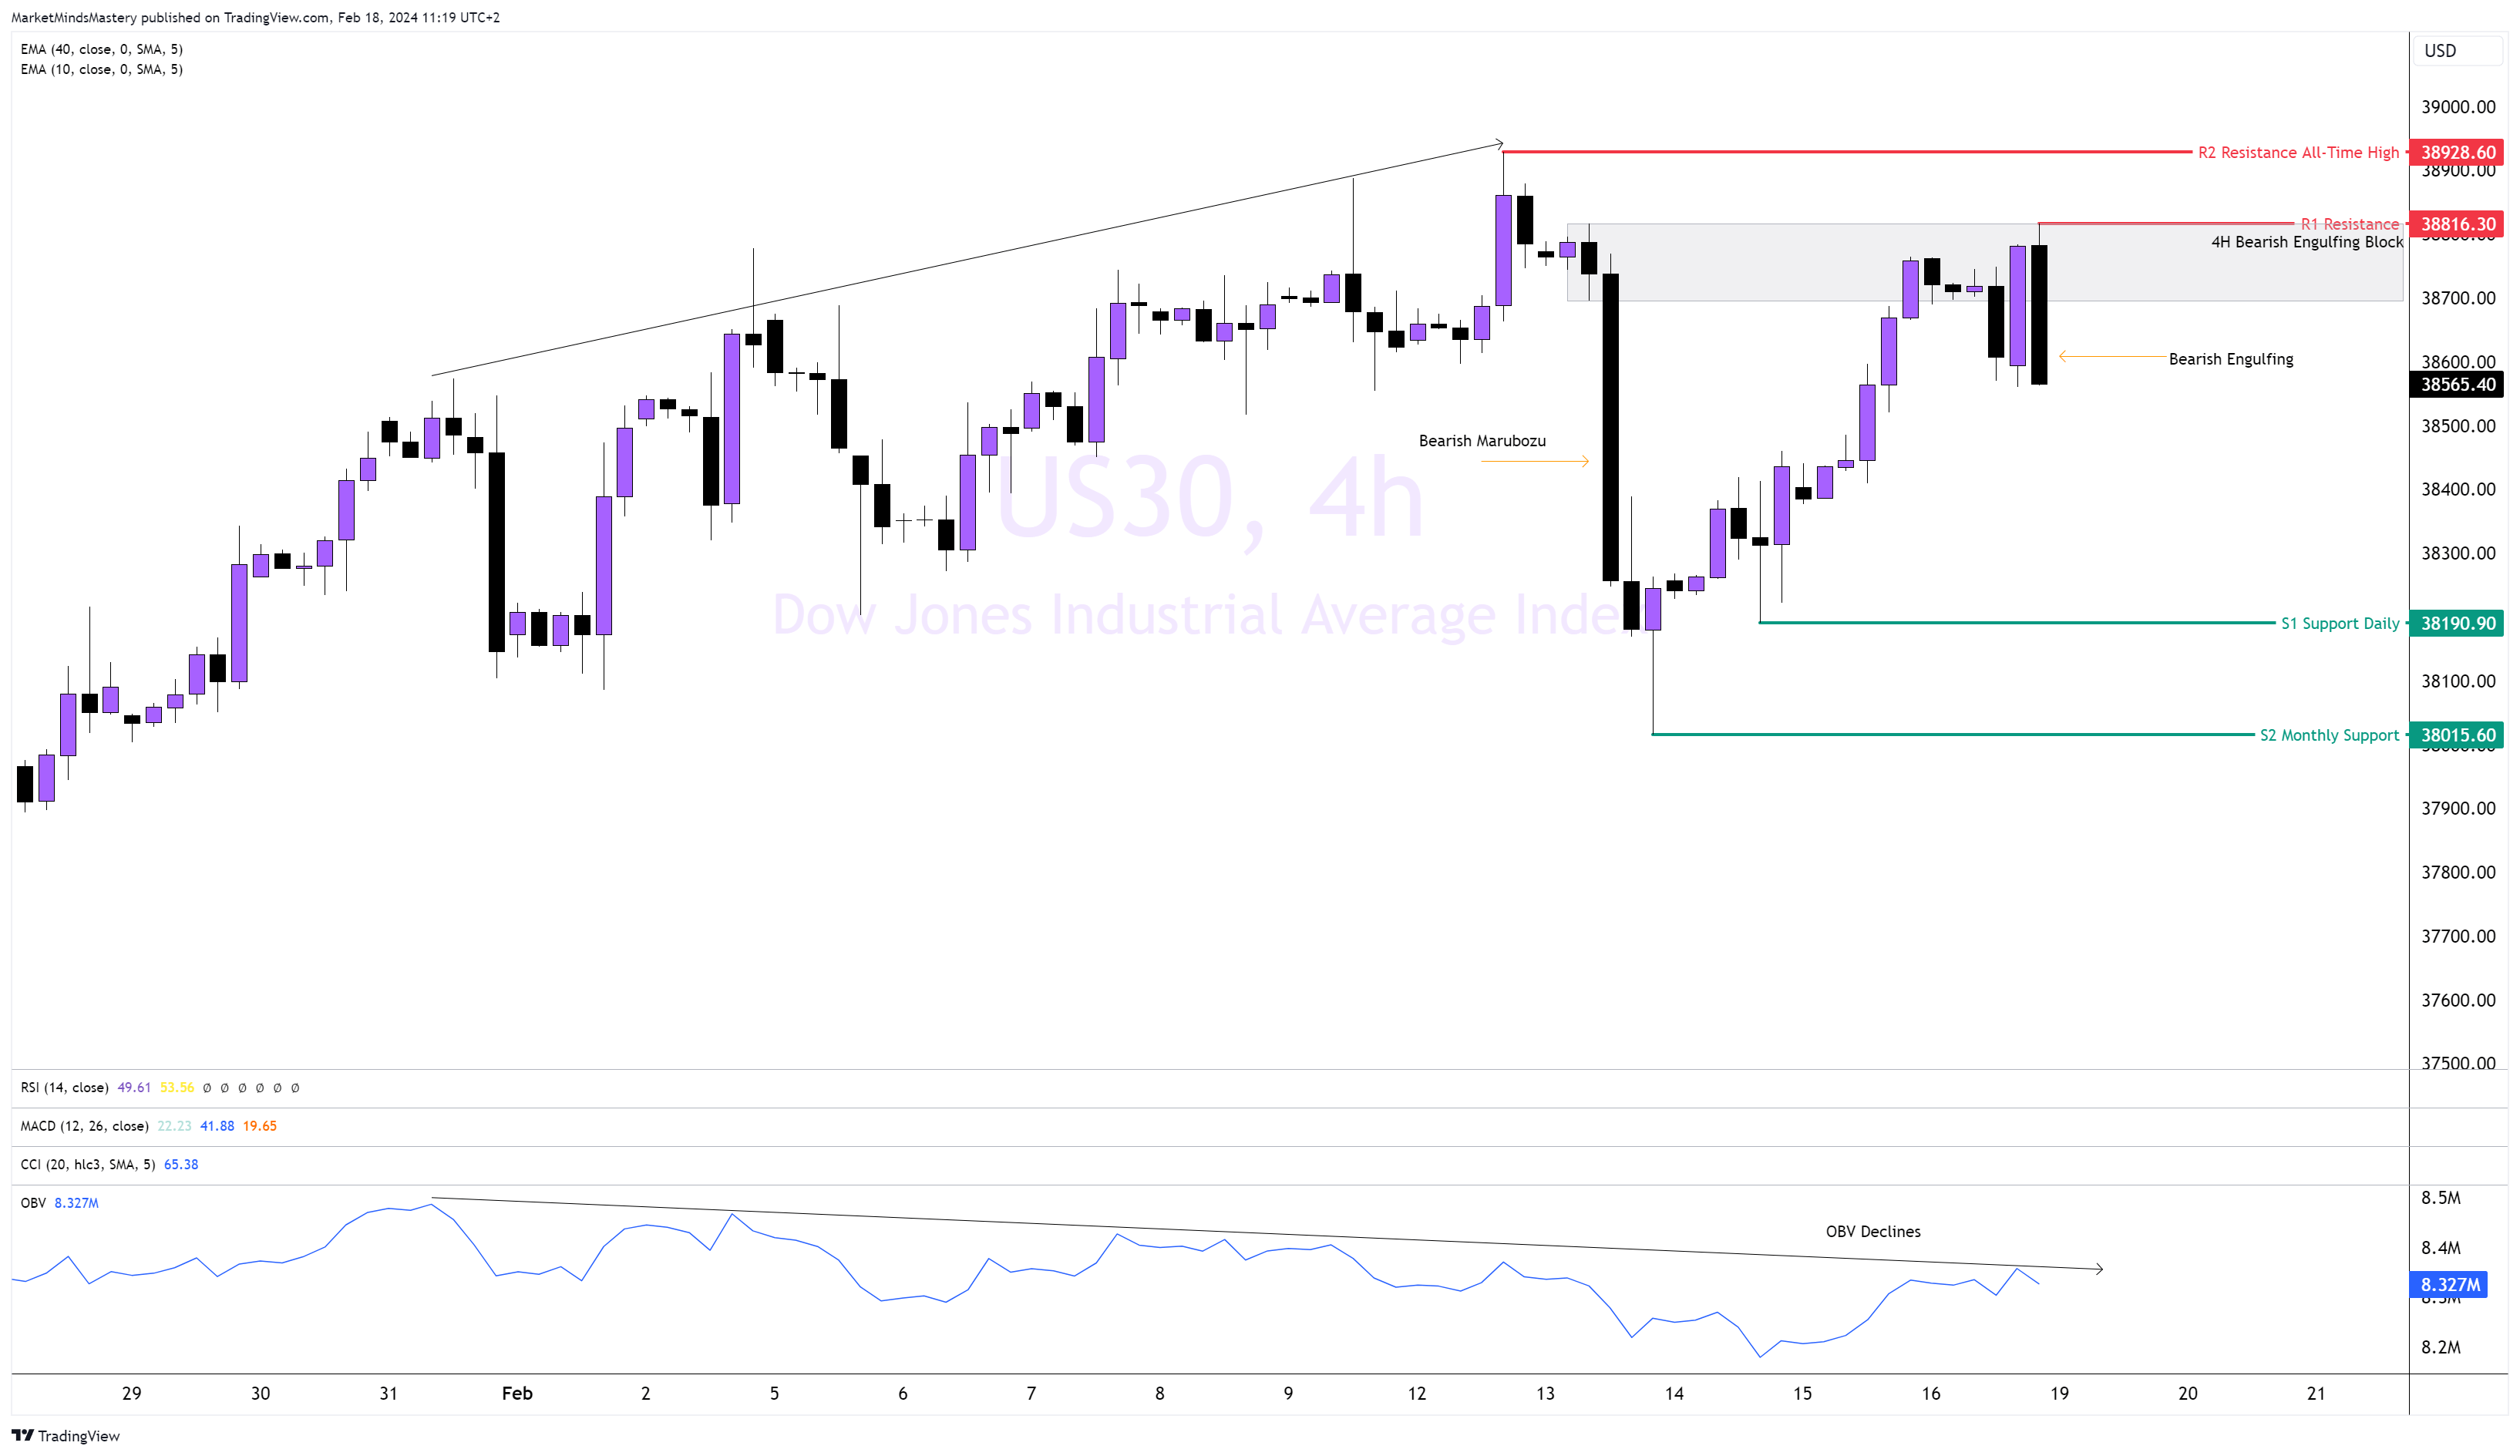
US30, 4H
Following the surprising news events of last week, the price of the US30, on the 4H chart, printed a bearish marubozu candle. The price found support around the 38000 level and bounced upwards with a bullish reversal hammer. The price could not create a new all-time high, and the market sold off at the bearish engulfing block area between 38700 and 38800 last week. Since then, a long, bearish engulfing candle was created, indicating that the sellers were willing to defend that area. The (OBV) Balance Volume declines, showing that more money moves out of the market than money flows into the market. This is also a bearish indication. If the price moves lower, the first area of support, S1, is a daily low of approximately 38190. A close below it and a further decline will find the next level of support, S2, to be the previous month's low, around 38000. This round number can bring significant trading engagement as it is a round number and attracts attention. If the price bounces off and moves upwards, the first area of resistance, R1, is approximately 38800. If the price penetrates the R1 and moves higher, the next resistance area is the R2, around 38928, the all-time high price.
GOLD, 4H
Following the long-term consolidation, last week's price of Gold, on the 4H time frame, created a lower low. Therefore, a Fibonacci retracement can be drawn from point (a) to point (b) as the price started a correction. Regarding the MACD indicator, the MACD line rose above the signal line, which is a bullish indication. However, the market is still in a defined downtrend. If the price continues moving upwards, the first resistance area can be the dynamic 20-period daily moving average. The 20 Daily MA is also in an area of a bearish engulfing block price action. The high of the bearish engulfing around 2031 is marked as the R1 static resistance and consists of the 0.618 Fibonacci golden number. If the price penetrates the R1, closes above it and moves higher, the next area of resistance, R2, will be approximately 2044, which is also a monthly level.
Oppositely, if the price moves downwards, the S1 support, around 1994, is the first static support. If the price decisively penetrates it, the next area of support, S2, was founded around the 1984 level.
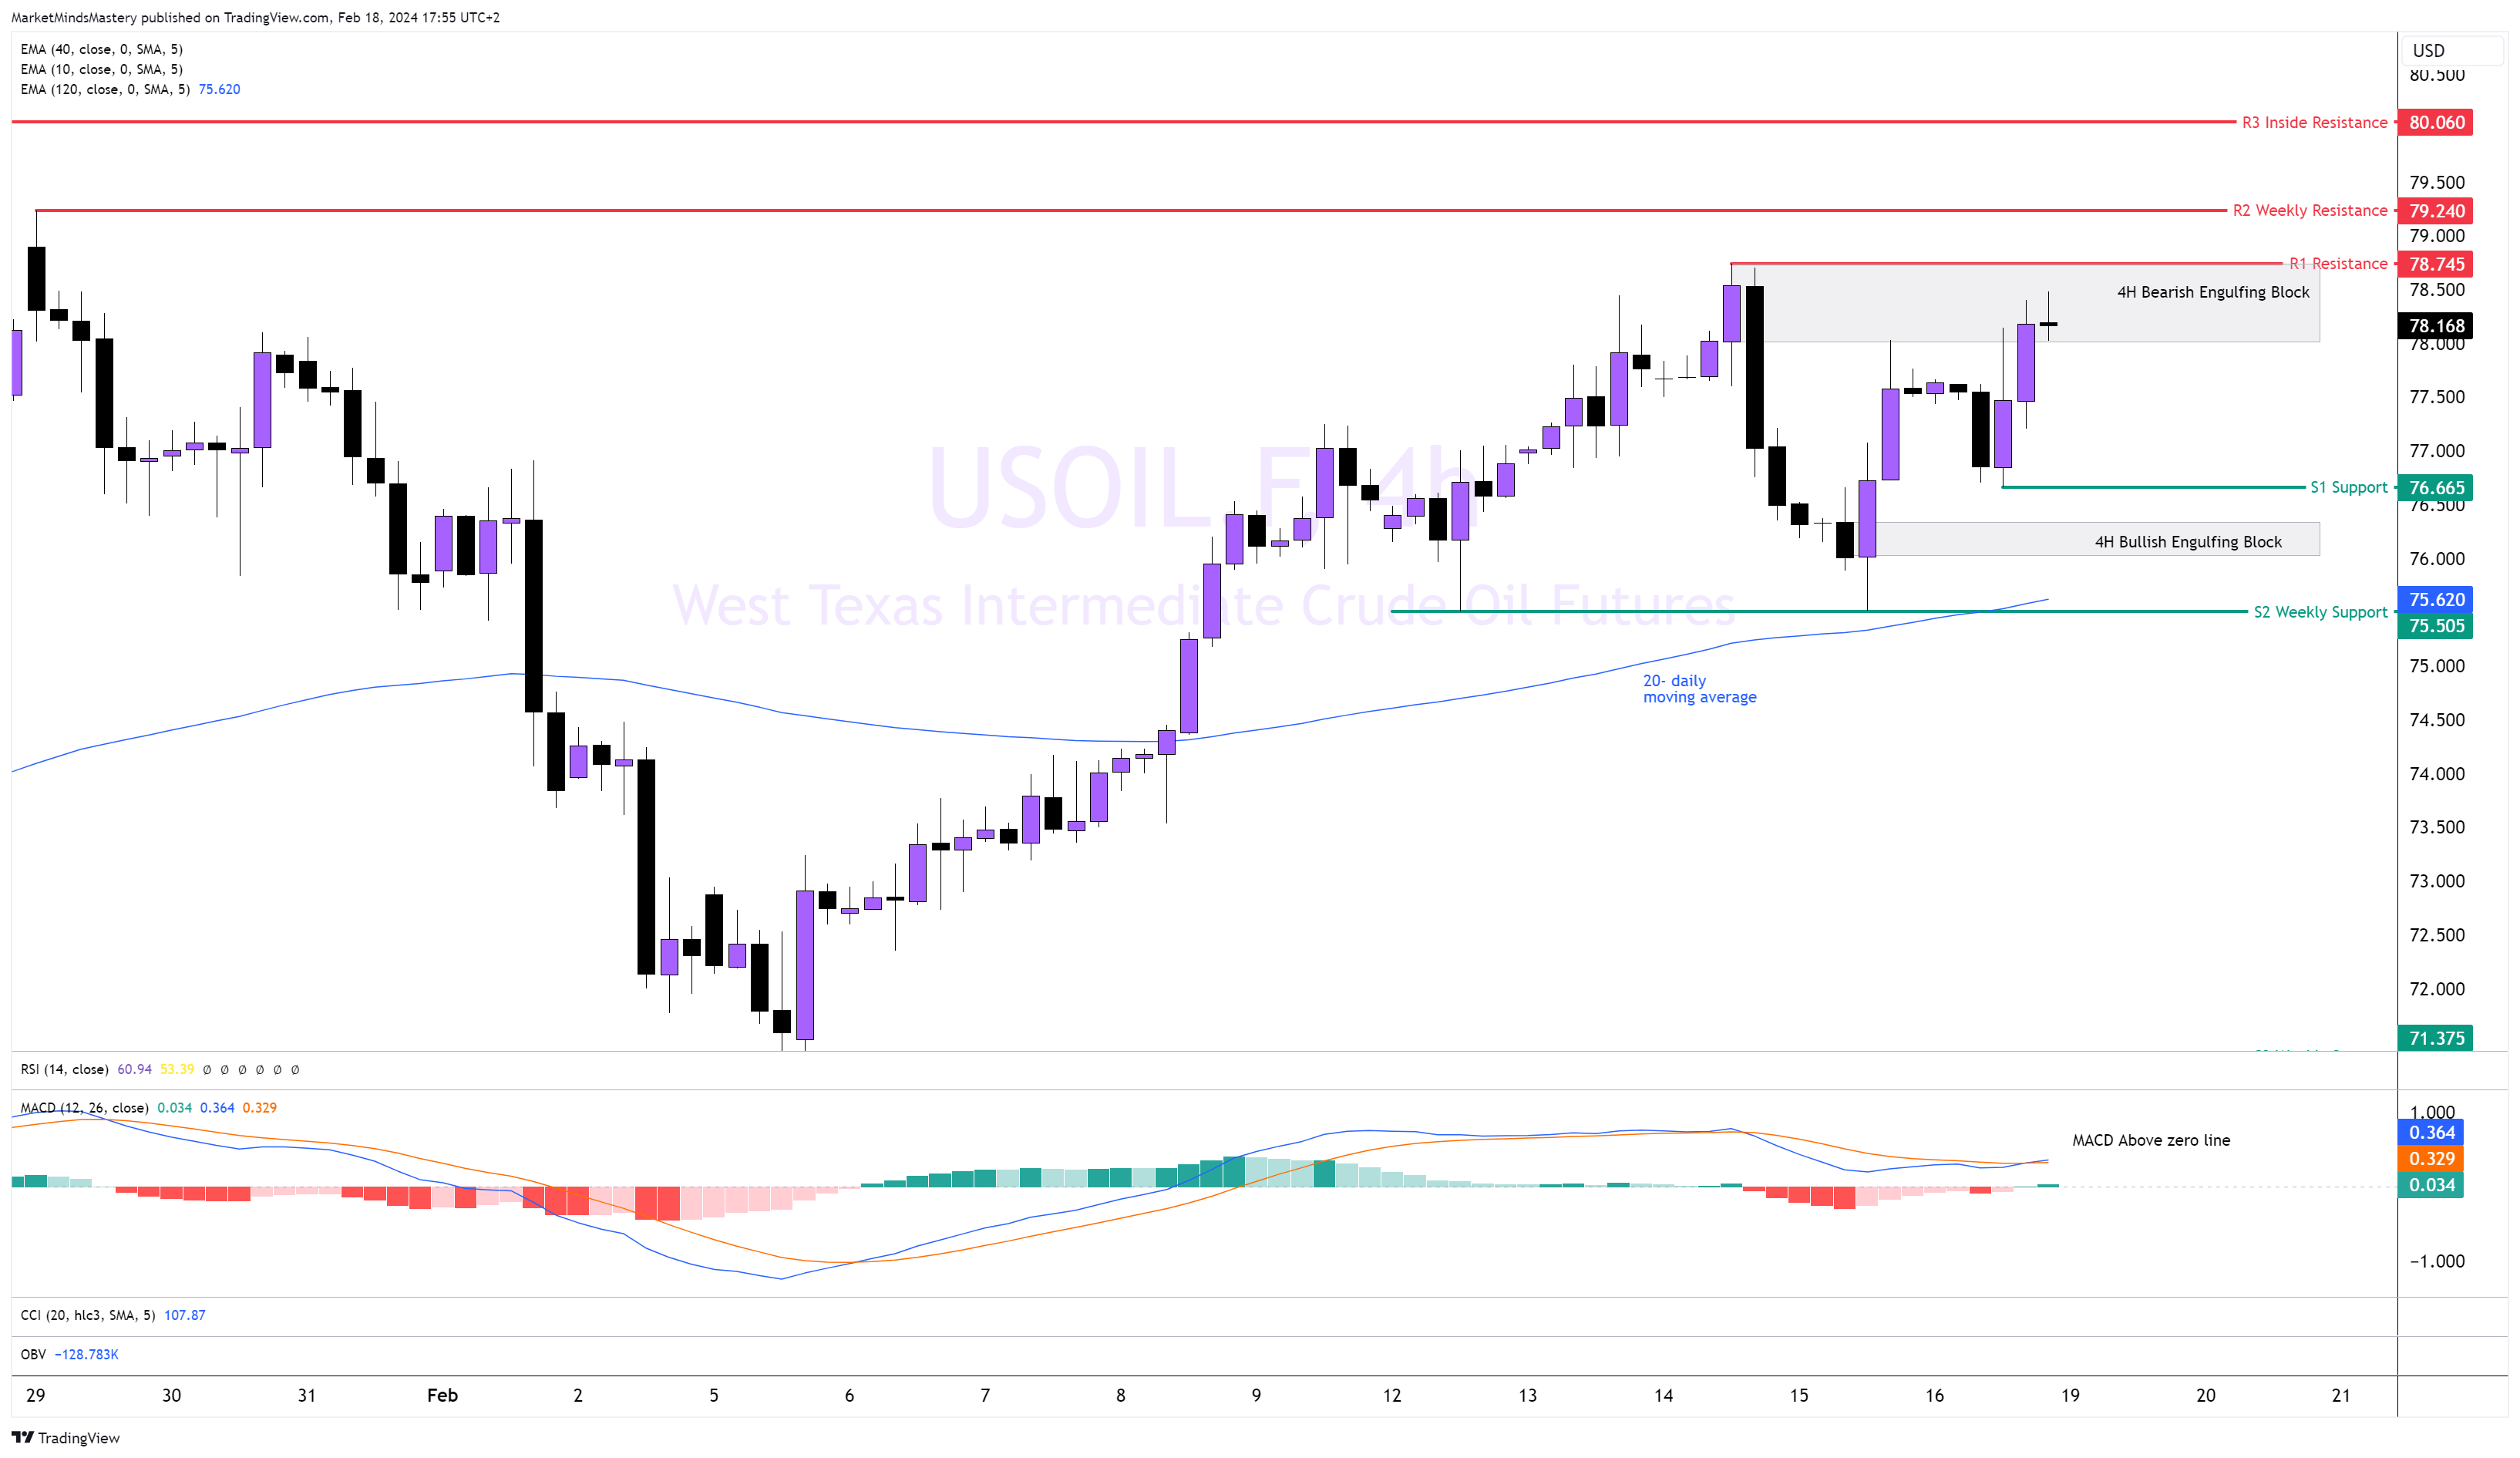
USOIL, 4H
Following the uptrend that started at the beginning of February, the price increased in a series of higher highs and higher lows. Last Friday, the price tried to reach $78.74, stopping around $78. However, the price remains above the 20-daily period moving average, and the MACD is above the zero line. Both have bullish implications.
If the price moves upwards, the first resistance is the R1, which is around $78.74. If the price penetrates it and moves higher, the next resistance is the R2, a weekly level of approximately $79.20. A move beyond R2 can find the price reaching $80, which will be the R3 resistance area. On the other hand, if the price declines and moves downward, the first area of support, S1, is approximately $76.66. It is above the bullish engulfing block area between $76-76.30.
A break below it can find the S2 weekly support, around $75.50, which consists of the dynamic 20-period daily moving average.
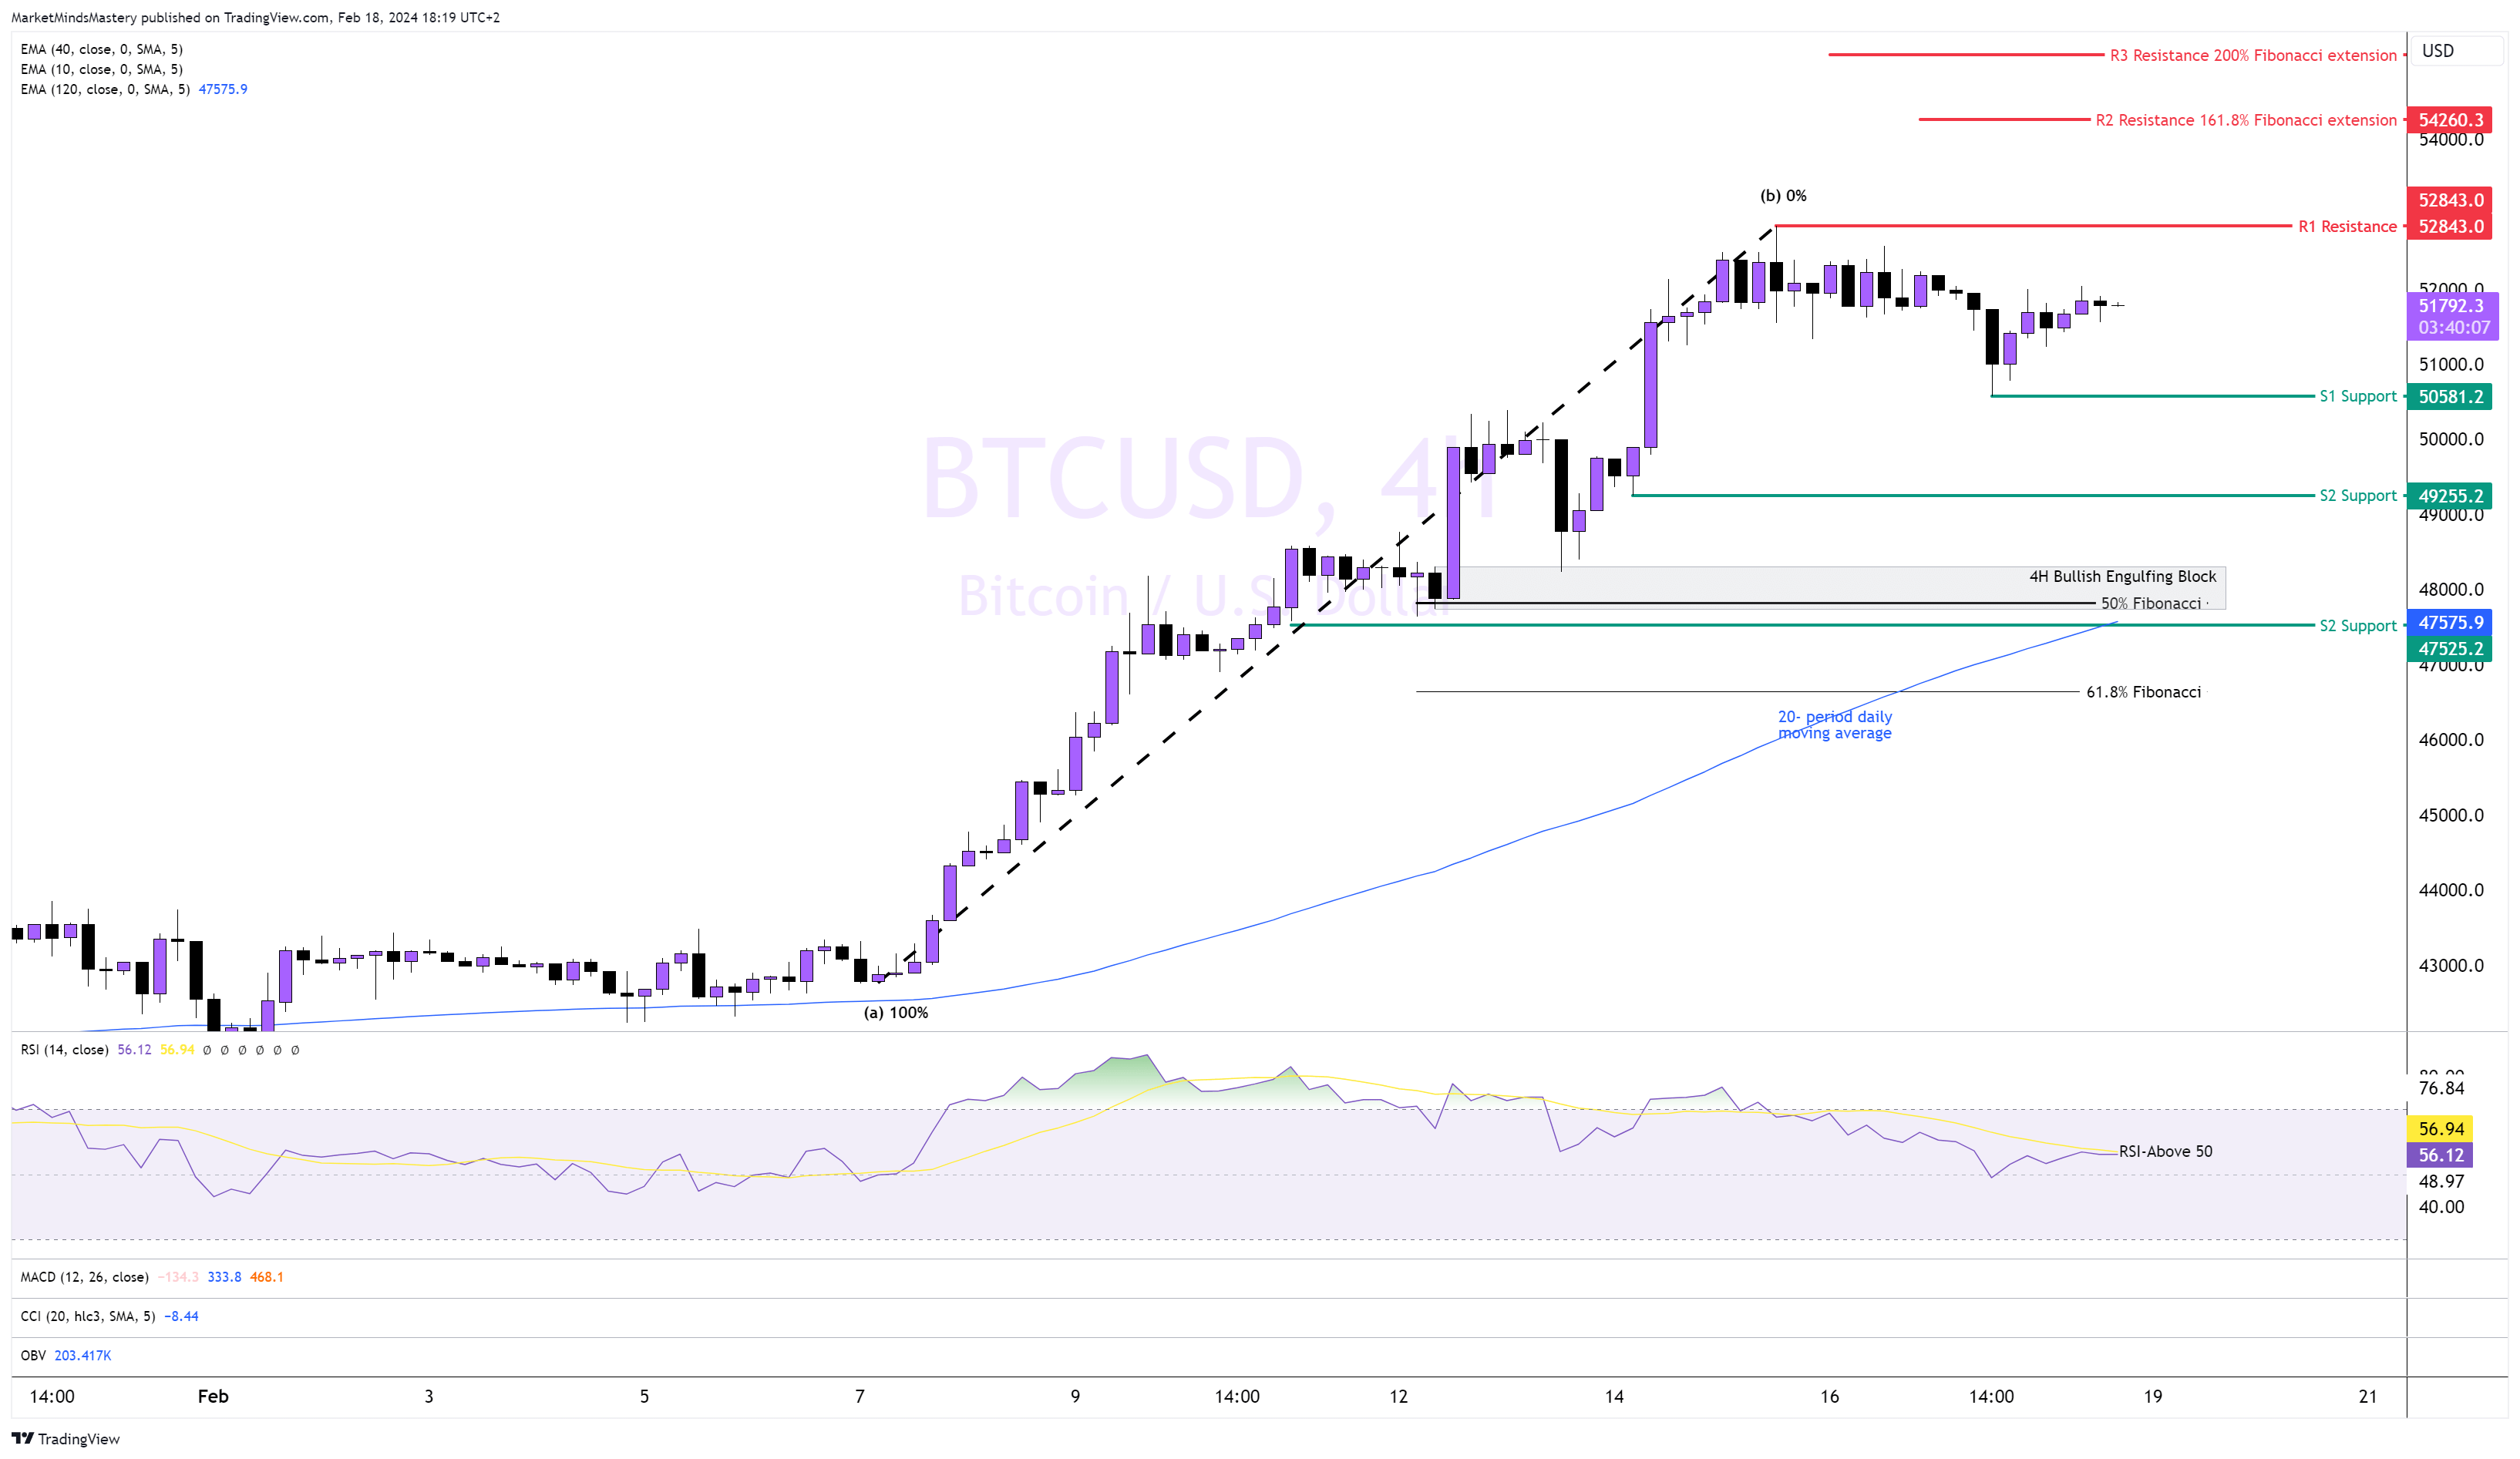
BTCUSD, 4H
Bitcoin has been experiencing enormous appreciation and increased volatility lately. The price is rising, and more extended, bullish candles are printed on the charts than bearish candles. These shallow retracements indicated that buyers are aggressive and willing to bid higher prices within a minor correction. The RSI is above 50, and this is bullish. However, as per the oscillator, it also does it at a weak pace. If the price moves downwards, the first support is the S1, which is around $50580. A break below the S1 and a close on two consecutive days can lead the price to the next area of support, the S2, around $49255. A further decline will meet the 50% retracement based on the Fibonacci impulsive move from point (a) to point (b). This area also hosts the bullish engulfing candle block that started the last recent trend leg. Conversely, if the price moves upwards, the first resistance is the R1, which is around $52843. If the price moves above the R1, the 161.8% Fibonacci extension can be used to find the R2 resistance above the $54000.
👉 Click here to check our Challenges
👉 Don’t miss our Free Live Webinars
👉Join us on Discord
Risk Disclosure:
The Trading Pit offers only demo accounts to all users within the Challenges and Signal Provider Agreements (Scaling Plan). All assets and trading activities are purely virtual. Please note that we do not offer CFD (Contract for Difference) challenges to residents of Canada and the United States. All content and information on this website is for informational purposes only and should not be interpreted as financial advice. Also, remember that results achieved in the past are no guarantee of future results. It is essential to understand the risks associated with trading. If you are unsure, always consult an independent financial advisor.