The Trading Pit Week Ahead Market Outlook (April 15 – April 21)
Last week, we witnessed a significant event in the financial market, which we dubbed the “Interest Rates Pulse”. The RBNZ (Reserve Bank of New Zealand) maintained the Interest Rates at 5.5%, the Boc (Bank of Canada) at 5%, and the ECB (European Central Bank) at 4.5%. This led to the Kiwi (NZD), the Lonnie (CAD), and the Euro depreciation. The USD emerged as the leading player, rallying to higher prices due to the positive CPI number, which surpassed expectations.
The US Retail Sales will be the only significant news event on Monday. The previous number stood at 0.6%, and the forecast predicts a drop to 0.3%. It's crucial to note that two factors always play a significant role in currency movements: the actual number deviation from the forecast and whether the market will follow through with the actual number. This forecasted drop should be monitored closely as it could impact the market.
On Tuesday, the volatility is expected to spike with China reporting the GDP (Gross Domestic Product) and the Retail Sales., As per the forecast, both are expected to drop from 5.2% to 5% and 5.5% to 4.5%, respectively.
The UK will report the claimant count change only an hour before the London opening. The previous report showed that 16.8K claimed unemployment benefits, and the consensus-estimated that 17.2K will claim this time. That is an early indication of the unemployment rate.
Later at night, the Bank of England’s Governor Bailey will host a two-day speech that starts today.
During the New York trading session, the Bank of Canada will report the country’s CPI (Consumer Price Index). The previous number was 2.8%, and based on the forecast, this time is expected to be reported at 3%. A higher CPI number usually favours the currency. Therefore, if the outcome confirms the estimates and the Loonie follows through, bearish moves are expected on the EURCAD and GBPCAD.
The Boc Governon Macklem and the Fed’s Chairman Powell will give speeches.
On Wednesday, in the middle of the trading week, the CPI (Consumer Price Index) in New Zealand during the Sydney session will be reported, and in the UK during the London session. In New Zealand, the previous report was 4.7% and now is expected to decrease to 4.1%.
If the US dollar’s strength continues, and the NZD experiences a downfall due to a lower CPI, the market might see a solid downward move in the NZDUSD.
In the UK, the previous report was at 3.4% and is expected to drop to 2.9%. Similarly with the Kiwi, if the Sterling weakens, it can fuel the downward move of the GBPUSD and, based on the CAD’s performance, the GBPCAD.
On Thursday, the employment change and the unemployment rate will be the only significant events in Australia. As per the previous report, the employment change was 116.5K and is forecasted to drop to 15.5K. This forecast shows an extreme deviation from the last report. The unemployment rate from 3.7% is predicted to increase significantly to 3.9%. A 0.2% increase in unemployment is a significant increase and usually leads to currency weakness. Traders may be interested in seeing how the AUDUSD and the AUDCAD perform afterwards.
Lastly, in the UK, on Friday, the last trading day of the week, the Retail Sales number will be reported. The previous report came at 0%, and now the consensus estimates an increase to 0.3%
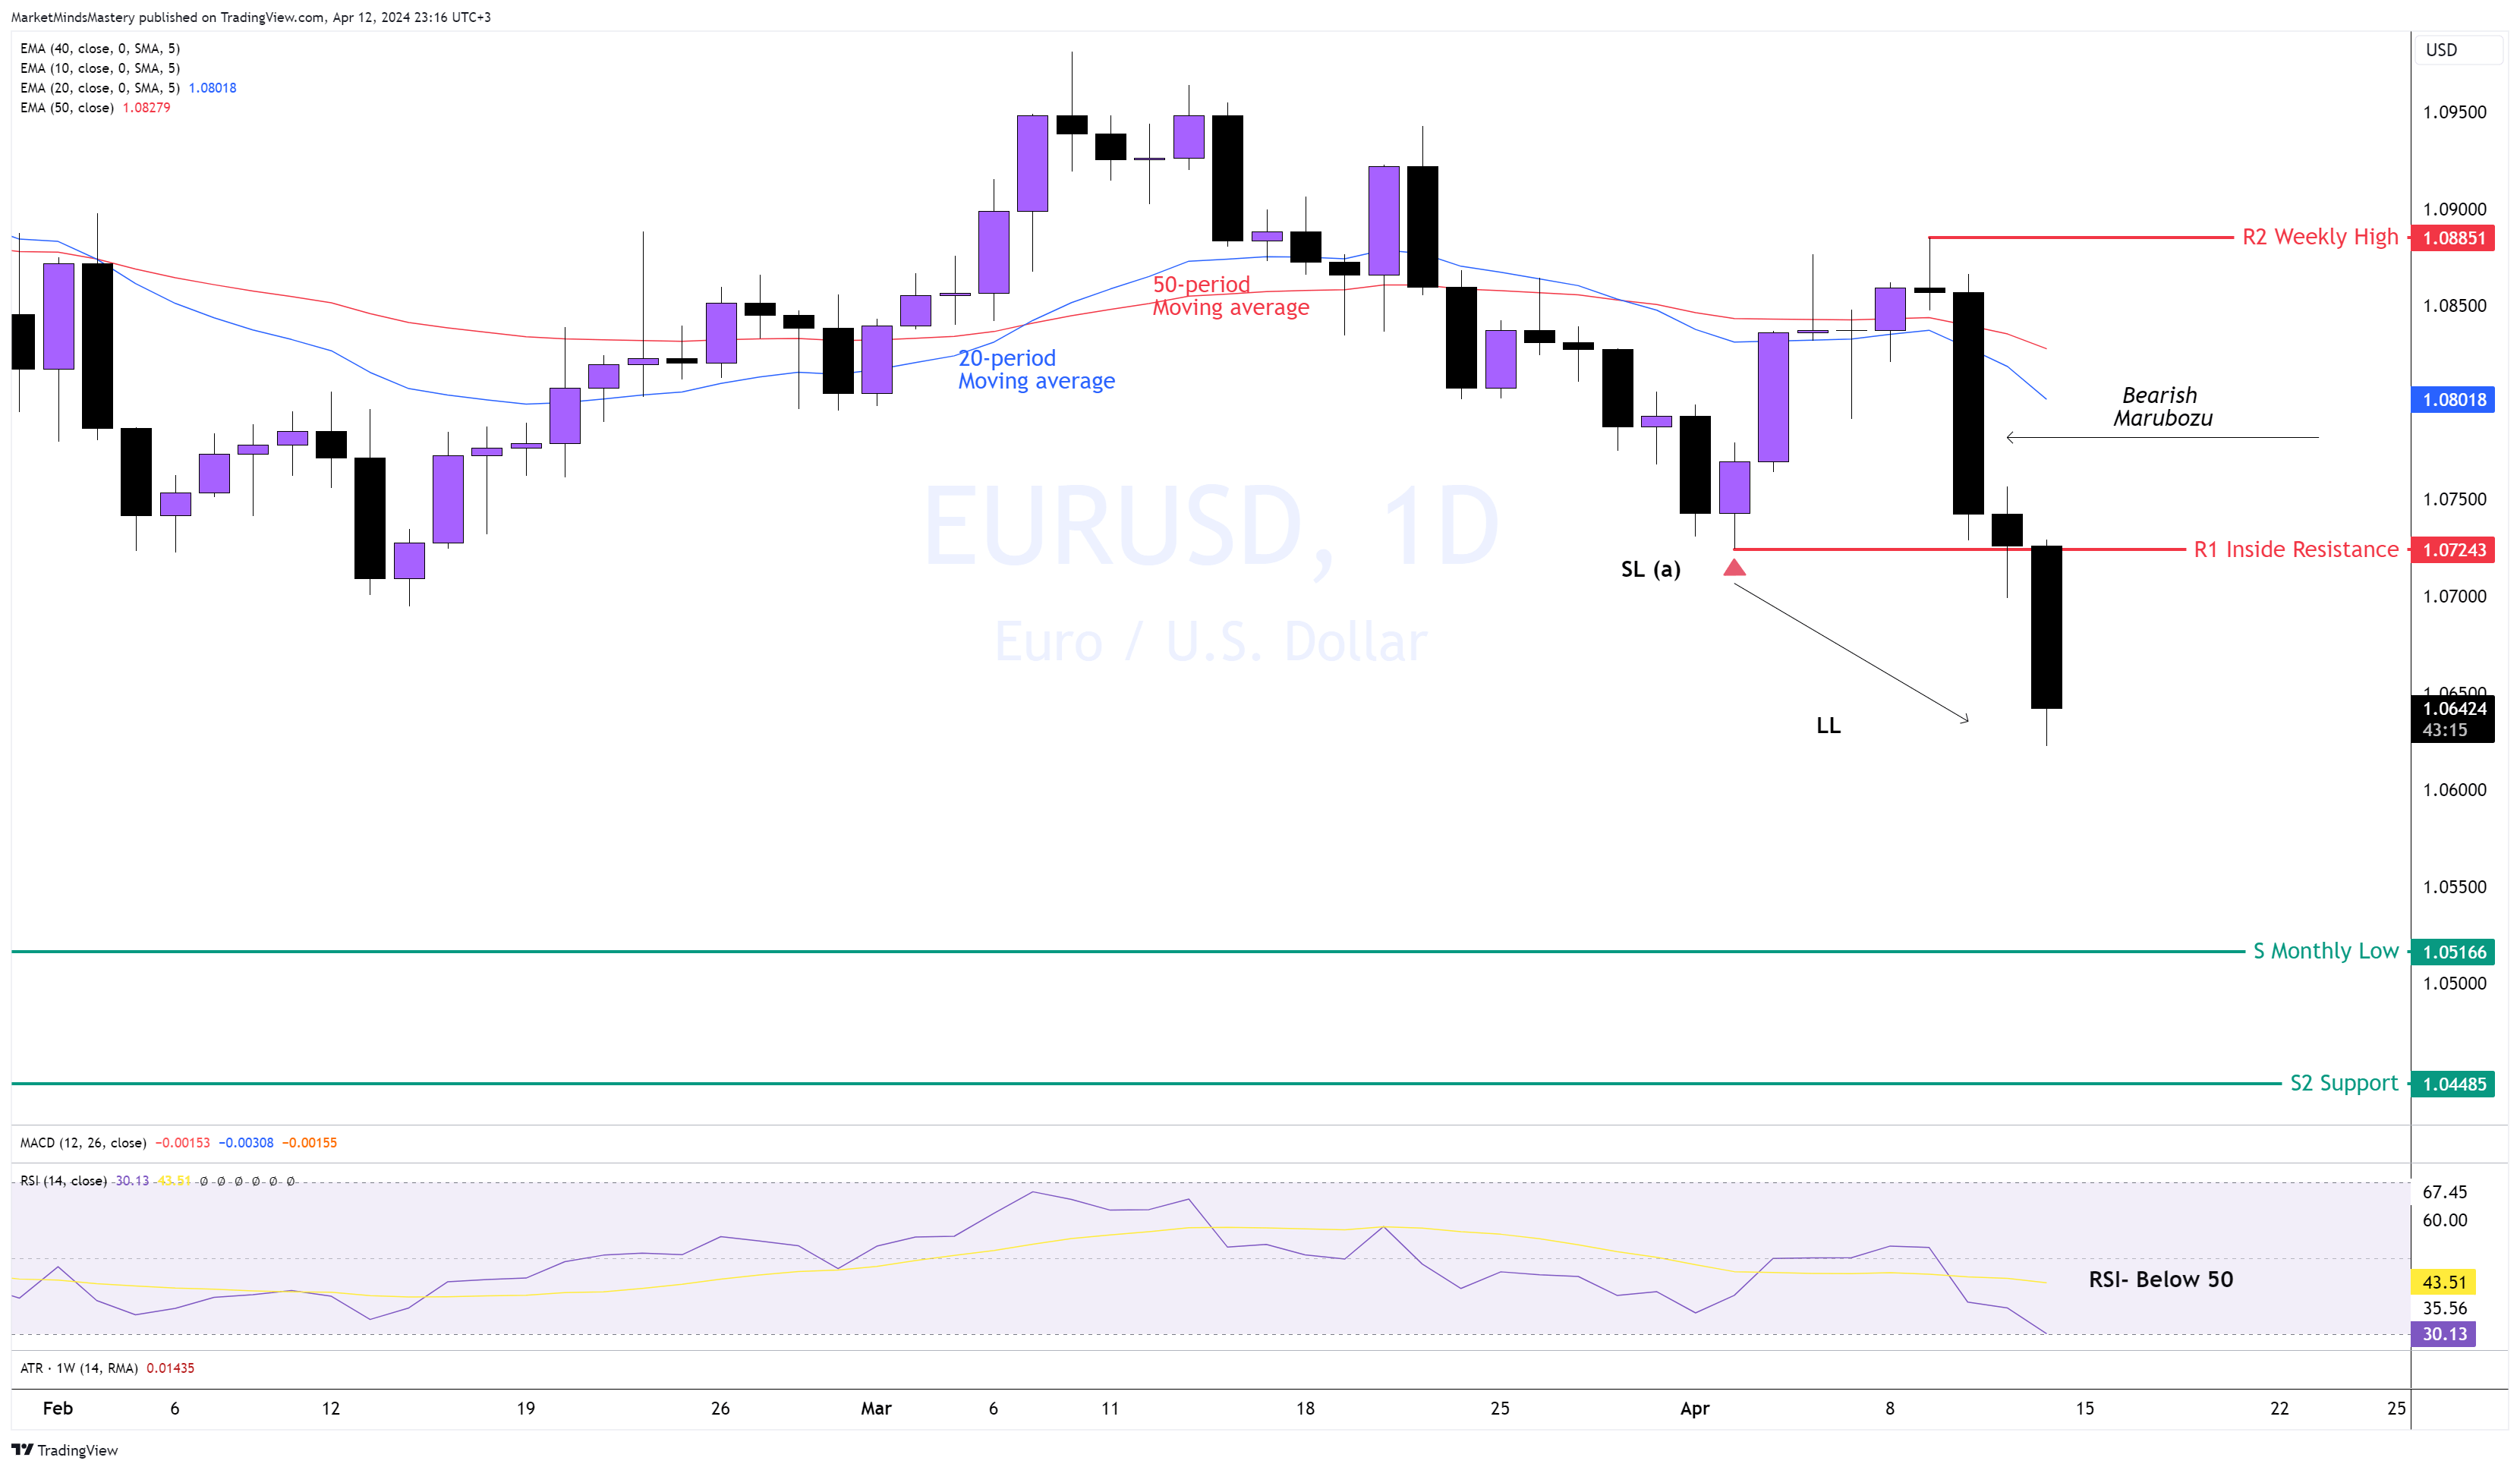
EUR USD, Daily

Even though the CPI number in the US bitted expectation by only 0.1%, and from 3.4%, the forecast rose to 3.5%, the market followed through, and the currency pair EURUSD experienced a sell-off of approximately 200 pips.
The ECB's decision to keep the Interest Rates at 4.5% negatively impacts the Euro, adding more stress to the currency.
Therefore, the market structure on the daily chart has shifted, with the SL (a) (swing low at point a) being broken. It indicates an imbalance between buying and selling orders, which is bearish. Additionally, the 20-period moving average has crossed under the 50-period moving average, indicating bearishness.
The RSI oscillator is under 50, which also has bearish implications. These trends suggest that if the price continues to move downwards, the first support area, S1, is a monthly level of around 1.05166. If the price surpasses and declines further, the next support, S2, is around 1.04485. If the price moves upwards, the first resistance area, R1, is an inside resistance around 1.07243. If the price penetrates it and moves upwards, the 20 and 50-period moving averages are expected to act as dynamic resistance in the market.
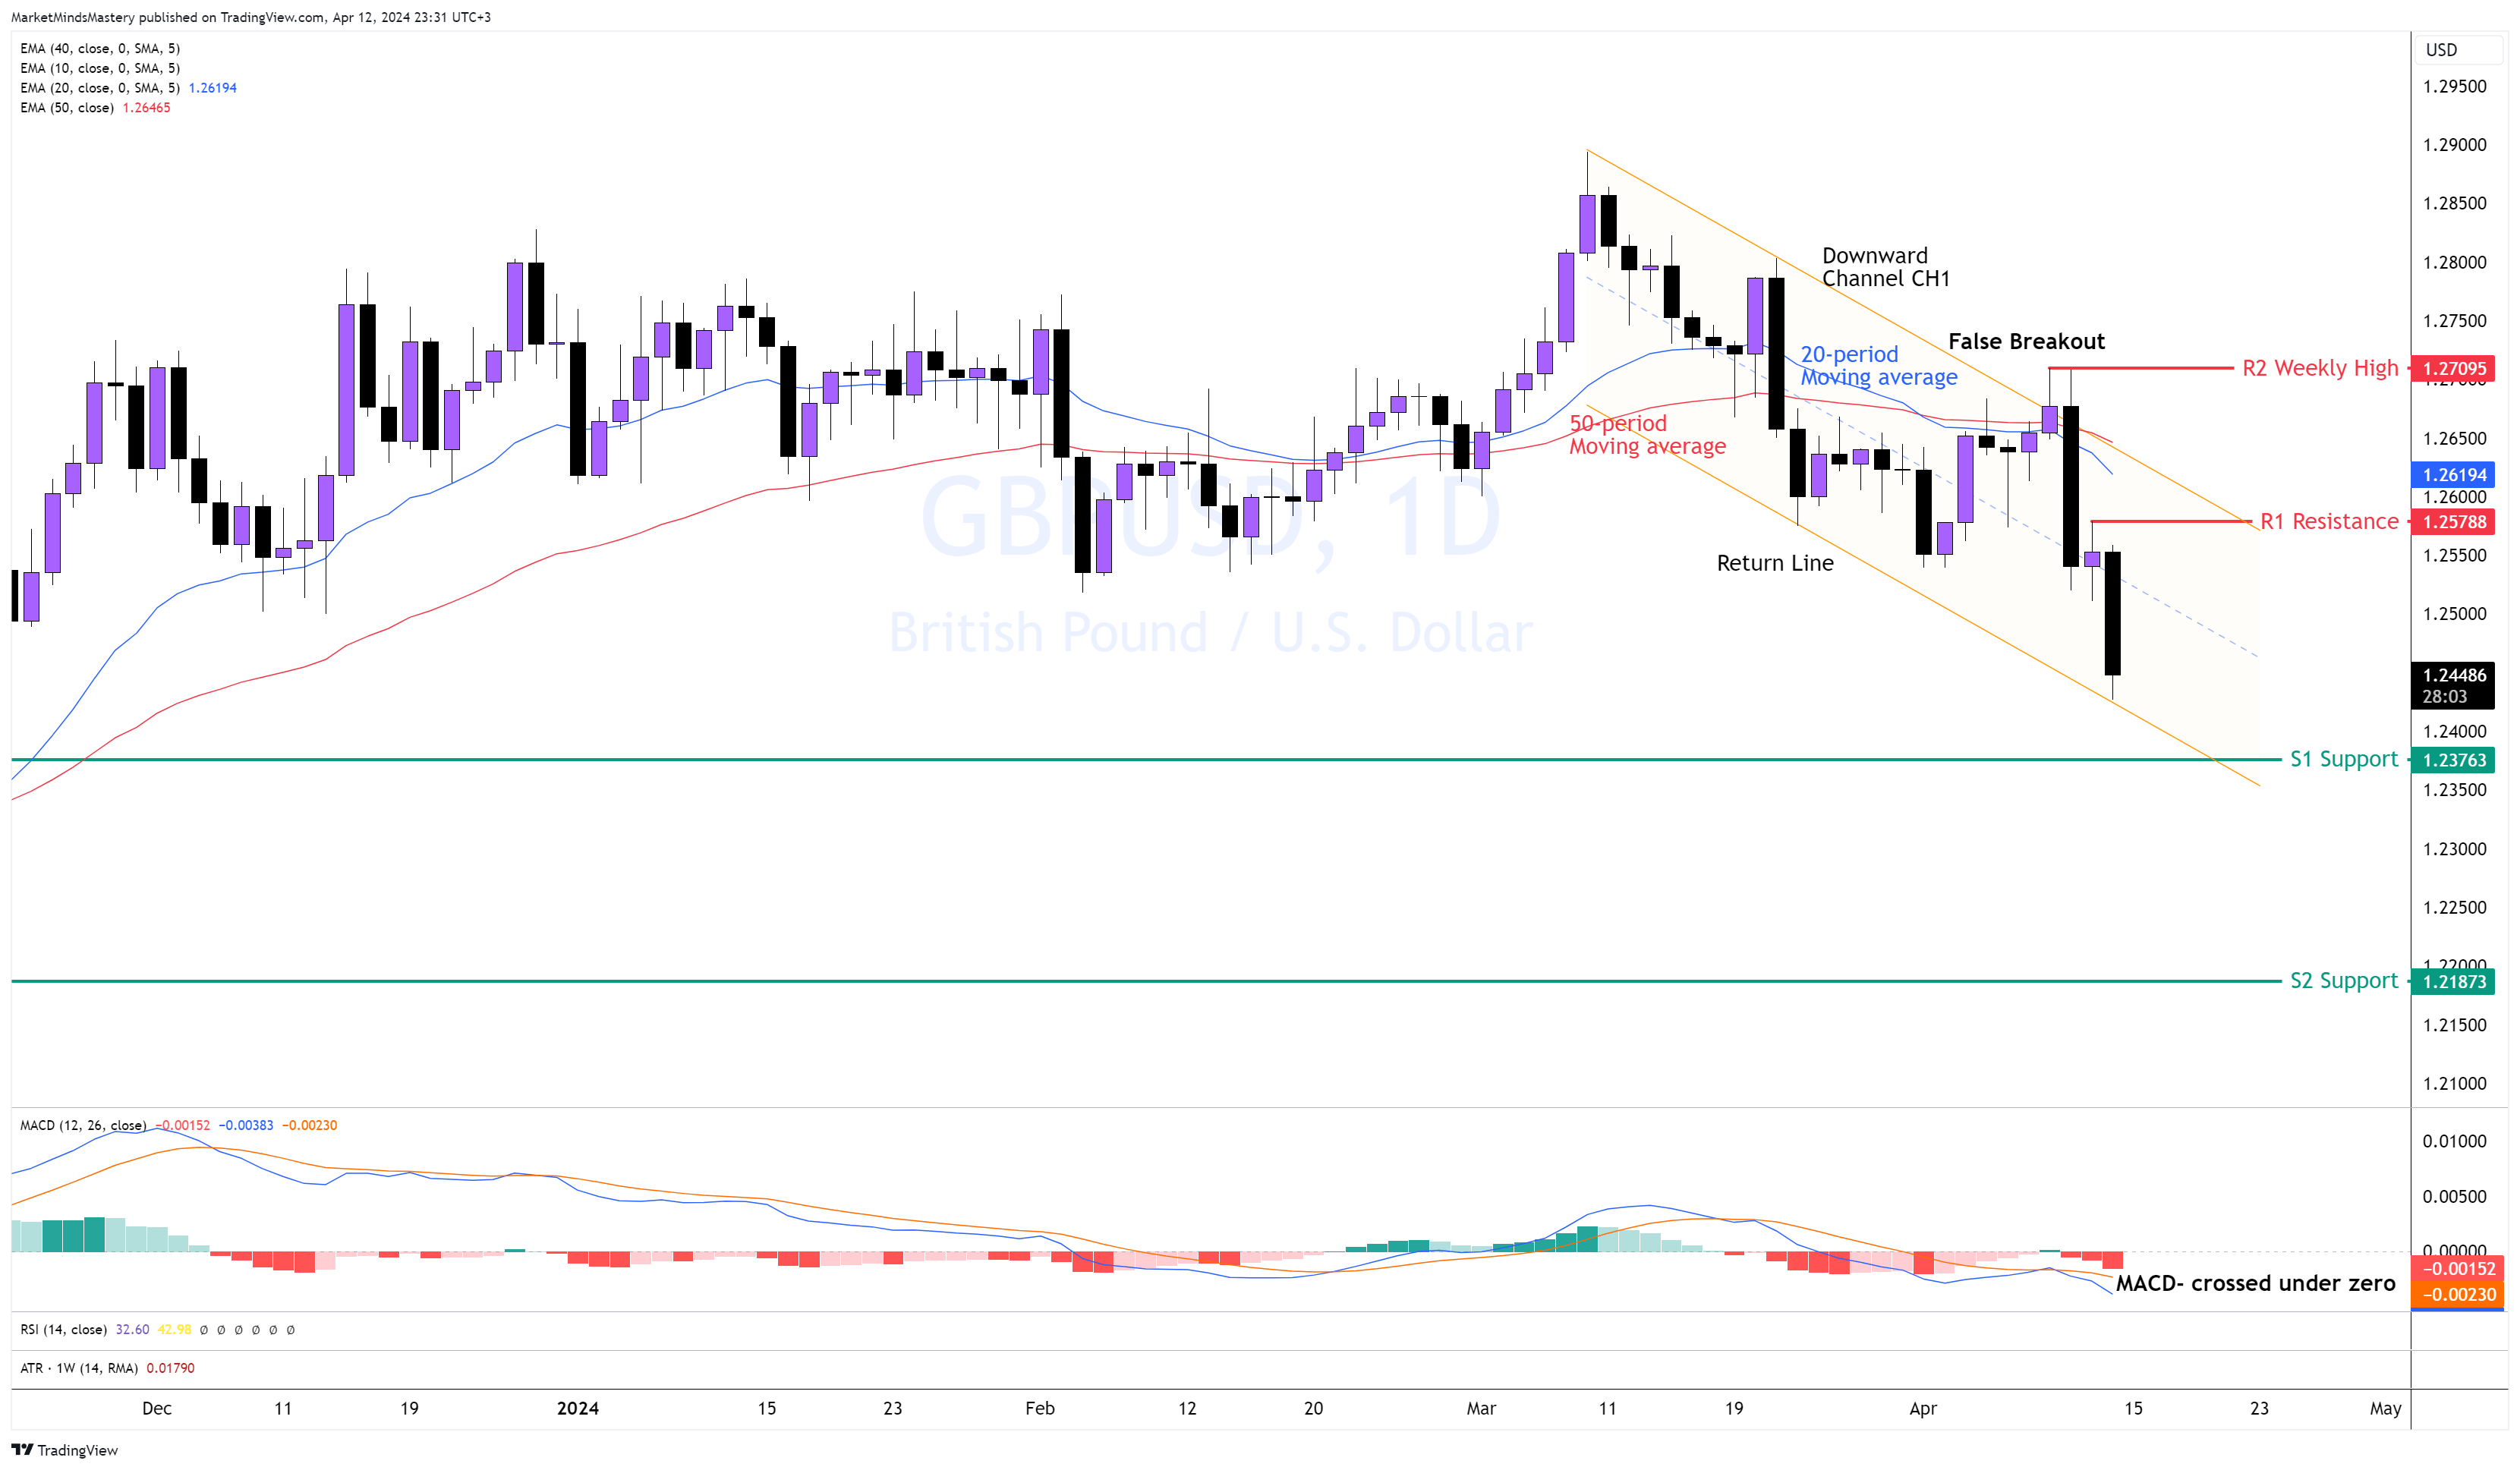
GBP USD, Daily
Following the Bearish Engulfing candle created on the weekly chart, the price moved downward with a series of lower highs and lower lows on the Daily chart. The chart above shows that the price behaviour can be captured using a downward channel CH1. During the retest of the downward channel last week, the price was rejected from the resistance level we pointed out in our analysis, and a market structure was created that defined a downtrend. The 20-period is under the 50-period moving average, indicating selling pressure. The MACD crossed under the zero line, also indicating bearishness.
Starting Monday, if the price continues to move downward, the first support area, S1, is approximately 1.23763. If the price penetrates it, closes below it and keeps moving lower, the next support area, S2, is around 1.21873.
Conversely, moving to the upside, we will find the first resistance area, R1, approximately 1.25788. A higher move can lead to the R2 resistance, around 1.27095.
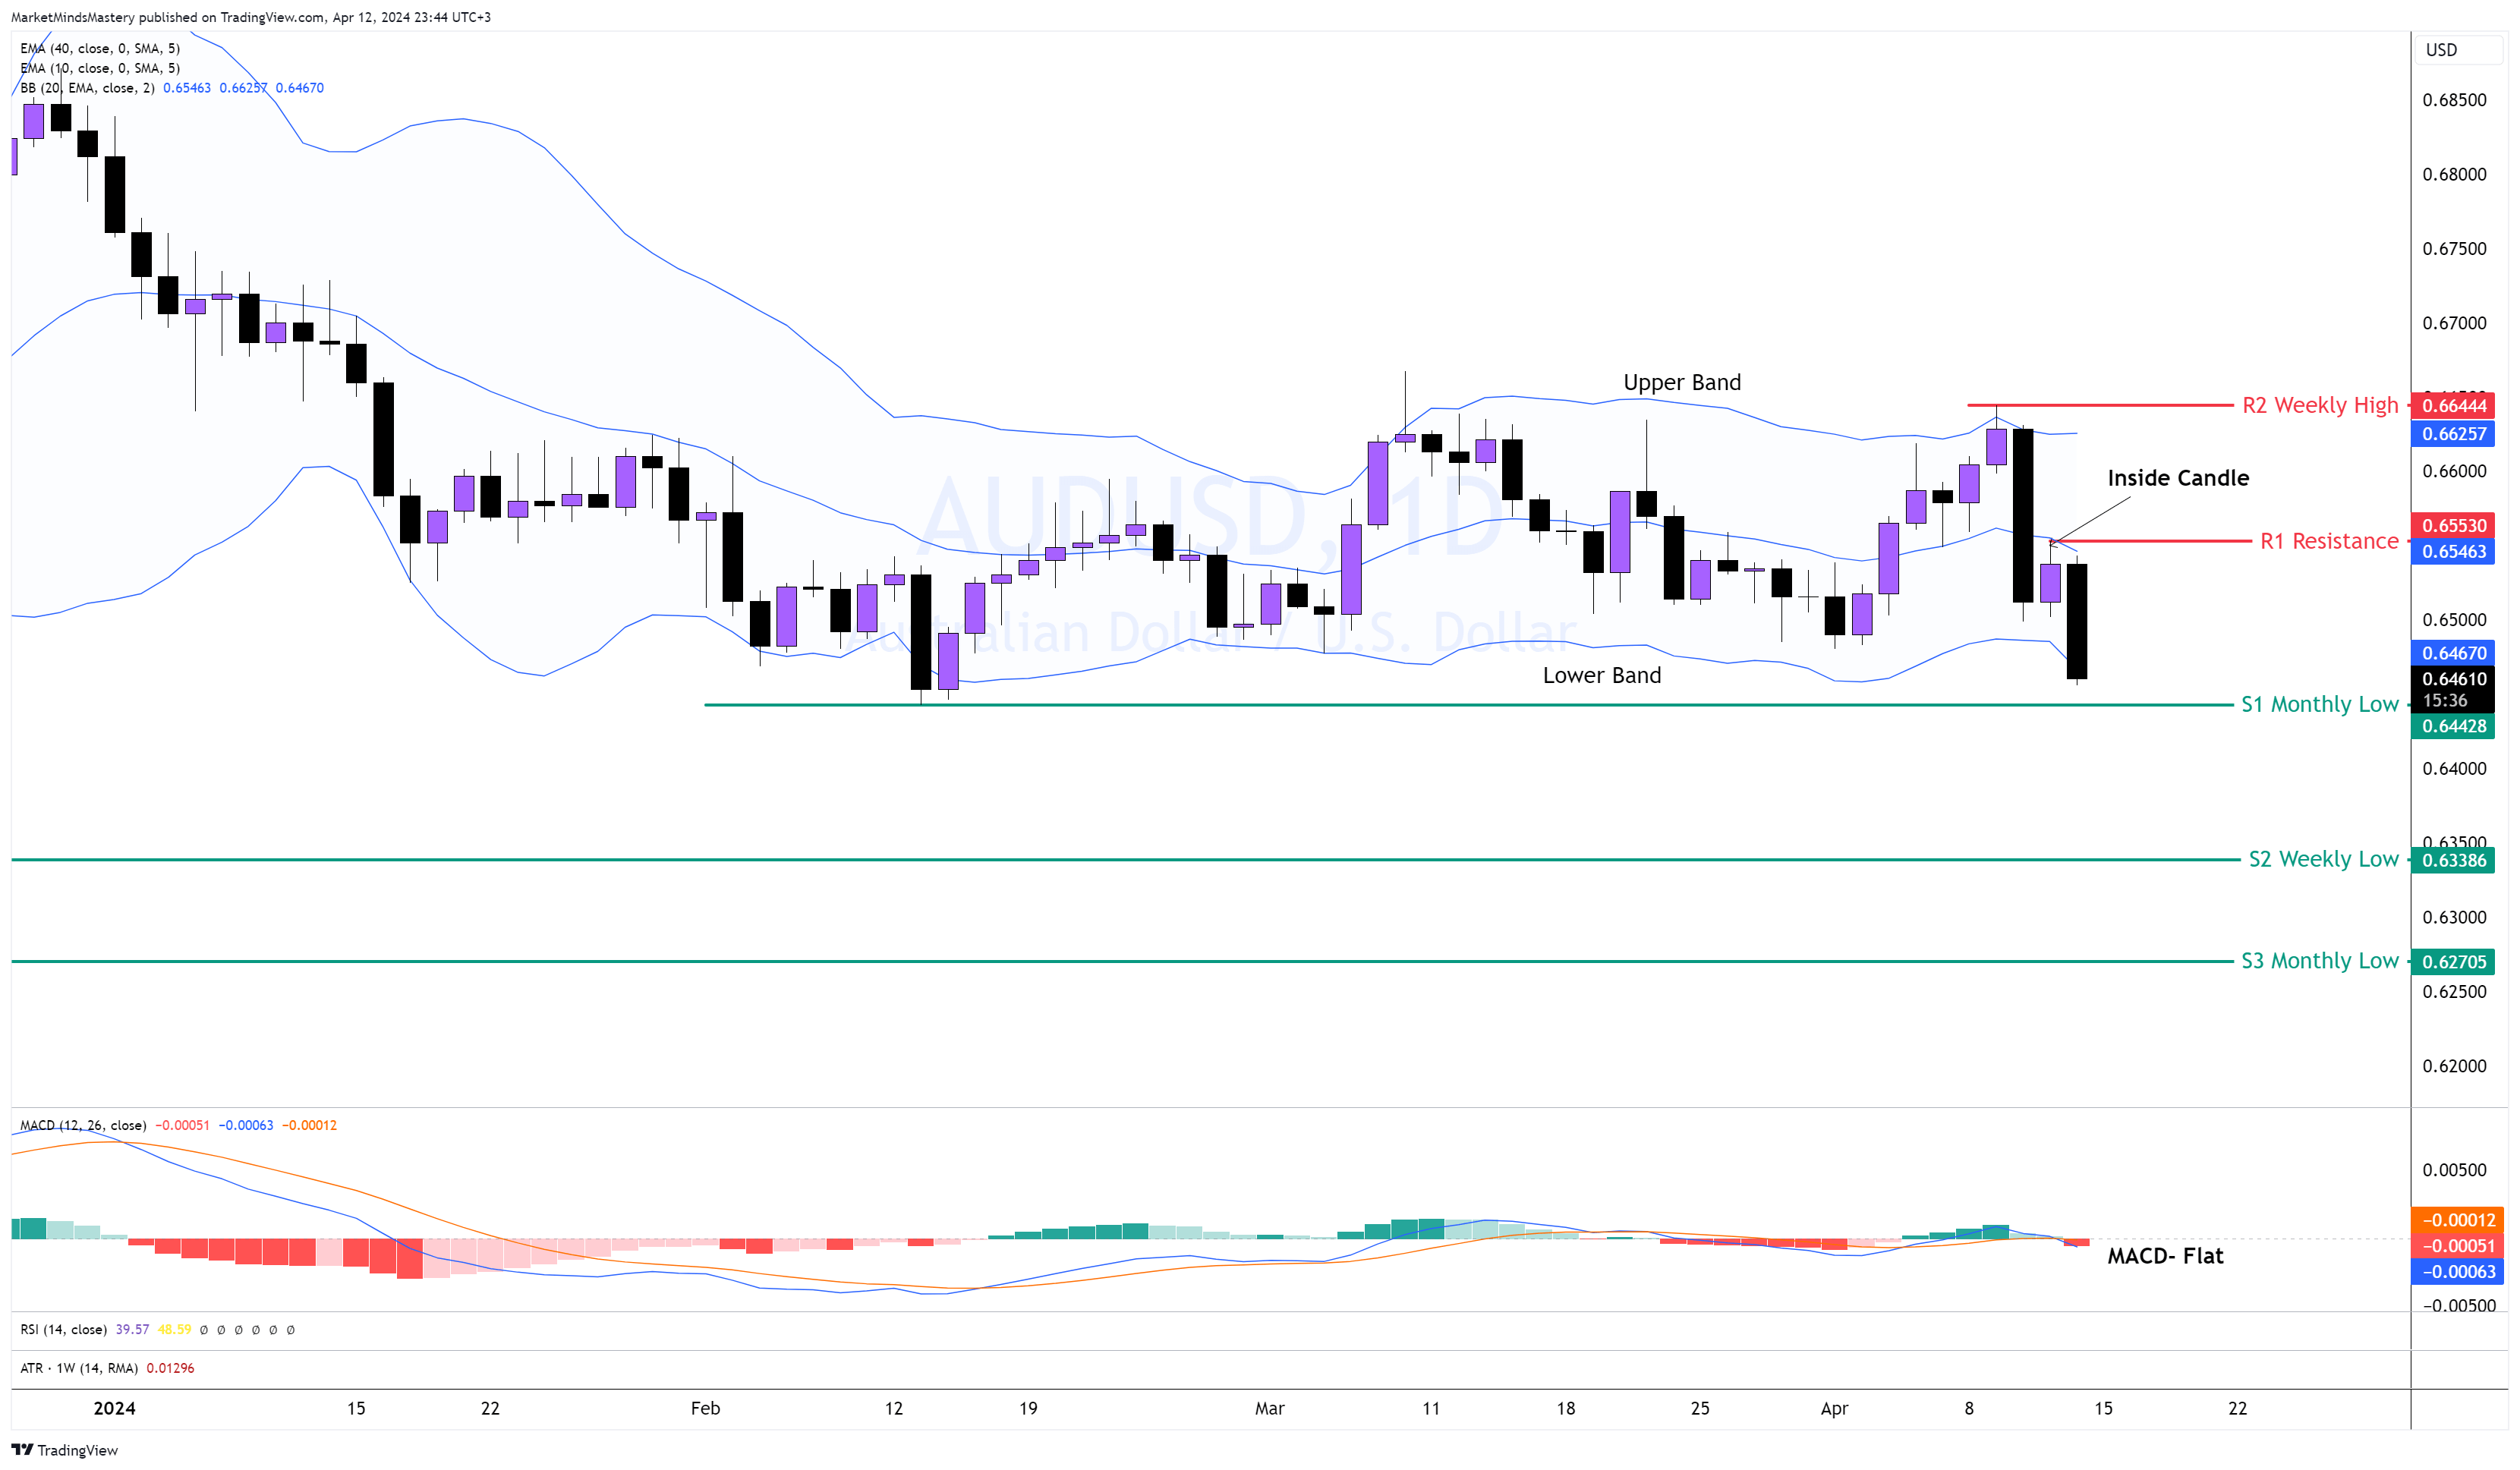
AUD USD Daily
Although the USD was the strongest currency last week and moved more than its average true range, the AUD was the next strongest currency per the currency strengths and correlation measures. Despite the USD being the most robust, the AUDUSD pair didn't create a downtrend and stayed within the boundaries of 0.66444 and 0.64428. As we see on the chart above, the upper and the lower bands point in the same direction and are parallel. Additionally, the MACD is flat around the zero line, and the histogram shows a balance of buying and selling orders. Hence, if the price moves downward, the first support area, S1, is a monthly low of around 0.64428. If the price breaks and closes under the S1 and moves lower, the next support area, S2, is an old weekly low of around 0.63386. A further decline will be found in the price testing of the S3 support, around 0.62705.
On the other hand, if the price bounces off and moves upwards, the high of the inside candle of the previous Thursday can act as the first resistance area, R1. At the exact price area, the 20-period moving average of the Bollinger Bands can also be used as a resistance area. A higher rally can return the price to the top of the range, testing the 0.66444, the R2 of the previous week's high.
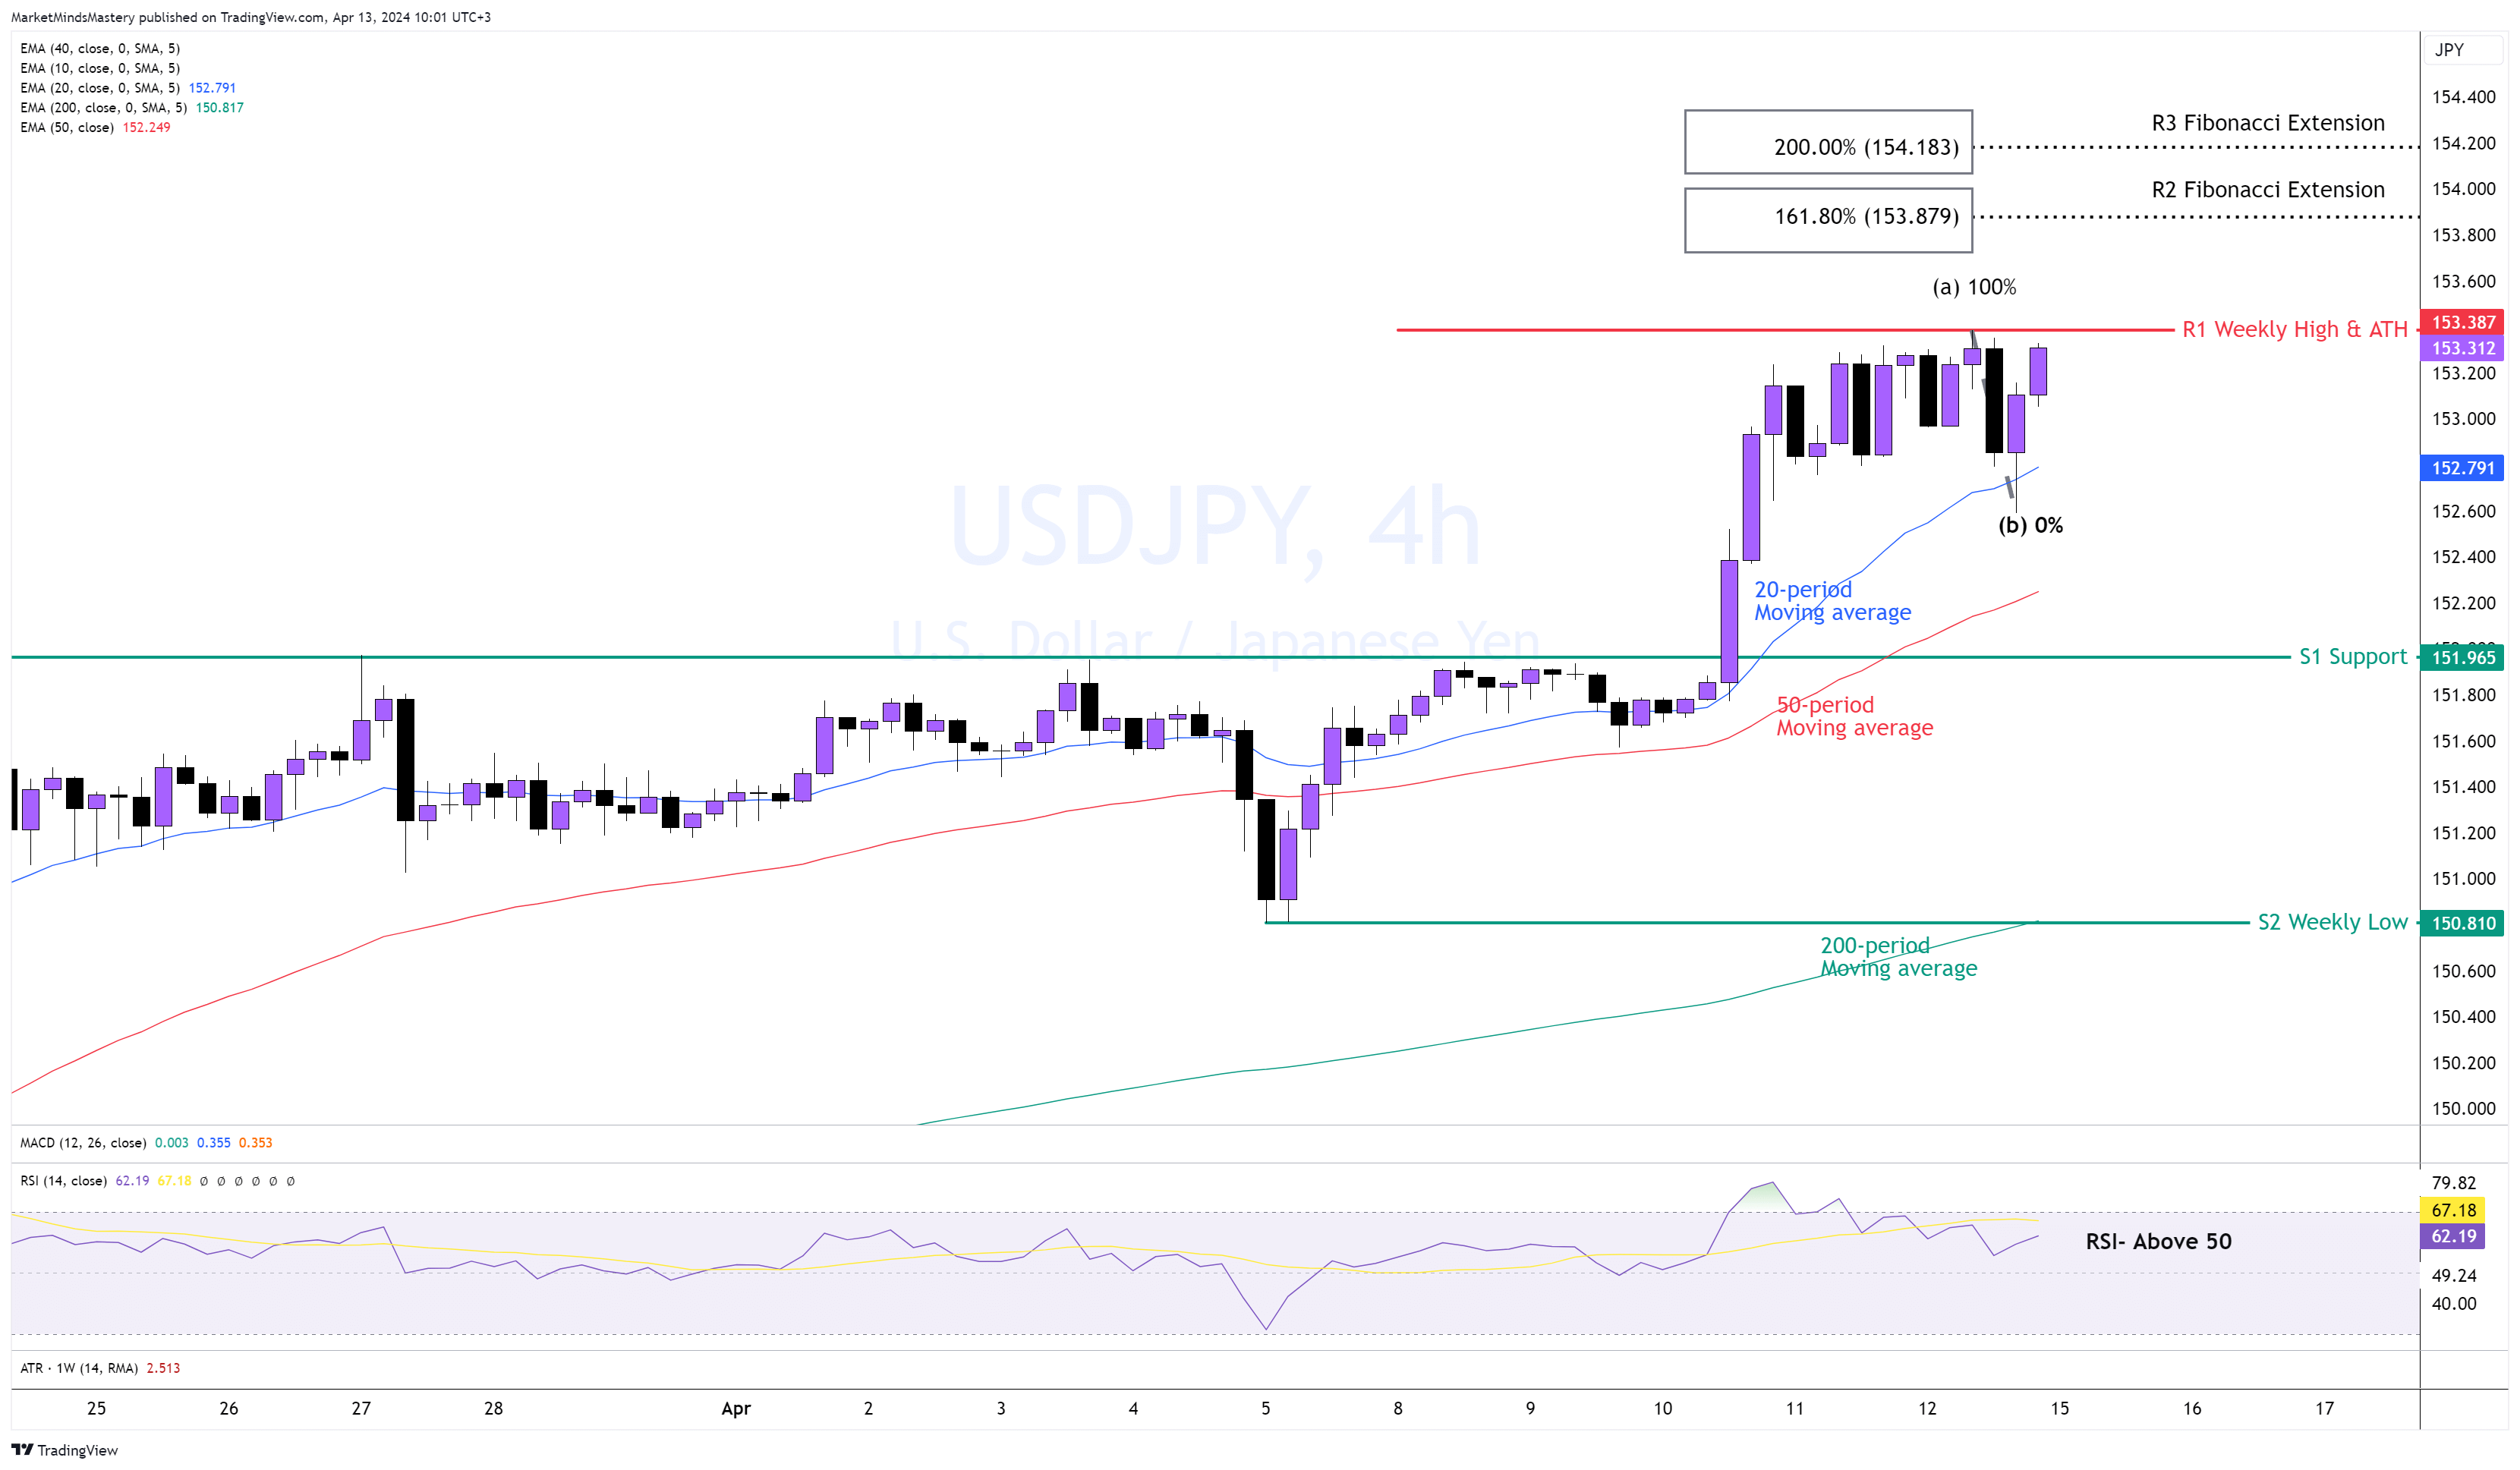
USD JPY 4H
The previous Wednesday, the positive CPI number in the US caused the bullish move on the USDJPY, and the price created a higher high, registering a new All-Time High. All three moving averages, the 20, 50 and 200, are in order, indicating bullishness, with the price constantly respecting the 20-period moving average on this 4-hour chart. The fact that the price bounces off from the 20-period MA reveals that the retracements are shallow. The RSI is above 50, indicating bullishness. If the price keeps increasing, the previous week’s high, around 153.38, is the R1 resistance. Suppose the price surpasses it and moves even higher to find the next possible resistance. In that case, we can use the Fibonacci extension with 161.8% and 200% being, respectively, the R2 resistance around 153.87 and the R3 resistance around 154.18.
If there is any price setback, the S1 support is found to be approximately 151.96. If the price penetrates the S1, closes under it and moves downwards, the next support area, S2, is approximately 150.81, a weekly low.
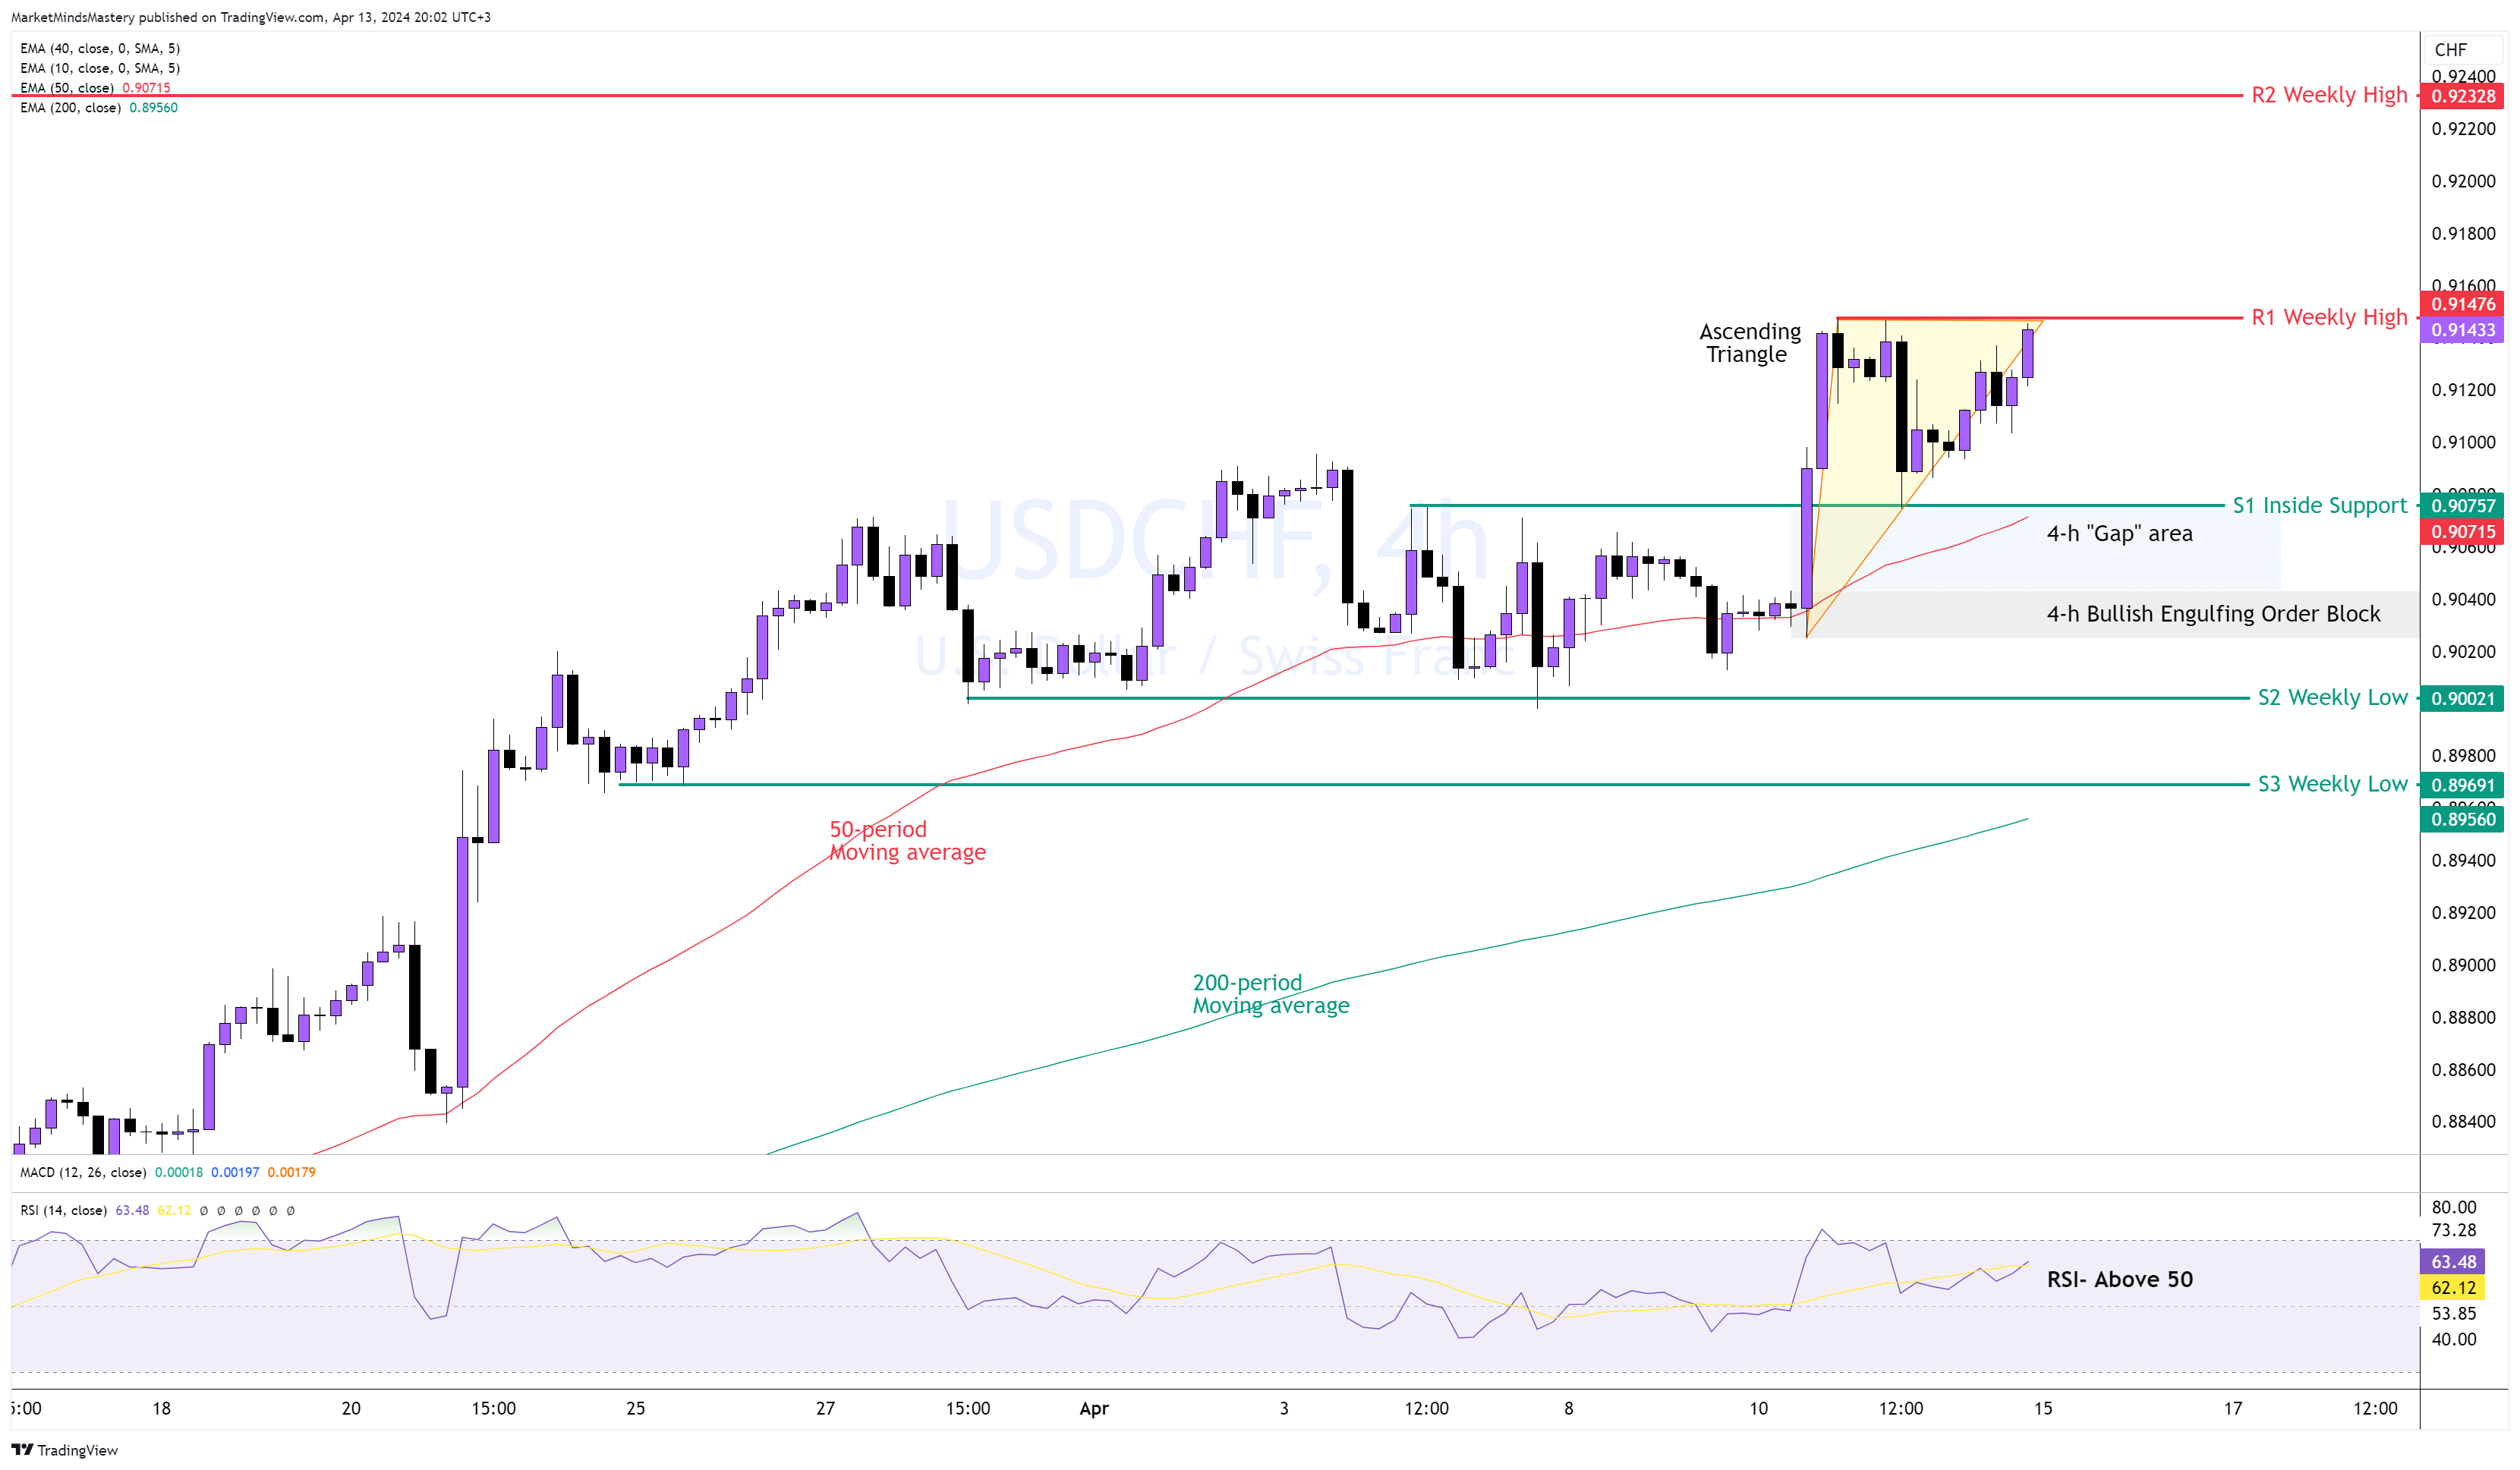
USD CHF 4H
Following the consolidation started last Monday, the price last Wednesday bounced off the 50-period moving average and moved upwards, leaving behind a 4-hour “Gap”. The 50-period is above the 200-period moving average, indicating a bullish market. However, the distance between the two averages is wide enough, suggesting the uptrend is strengthening. The RSI oscillator is above 50, which is another bullish indication. Additionally, an ascending triangle formed, adding to the bullishness of this market.
Starting Monday, if the price breaks above the previous week’s high, which formed the R1 resistance, around 0.91476 and moves upwards, it can reach the next resistance area, R2, approximately 0.93238, around 85 pips.
On the other hand, if the price declines and moves downwards, the S1 inside support around 0.90757 consists of the 50-period moving average, which can be dynamic support and the “gap” price left behind before the bullish move. If the price penetrates the S1 and moves further downwards, surpassing the Bullish Engulfing Order Block, it can travel until the next support, S2, at approximately 0.9002.
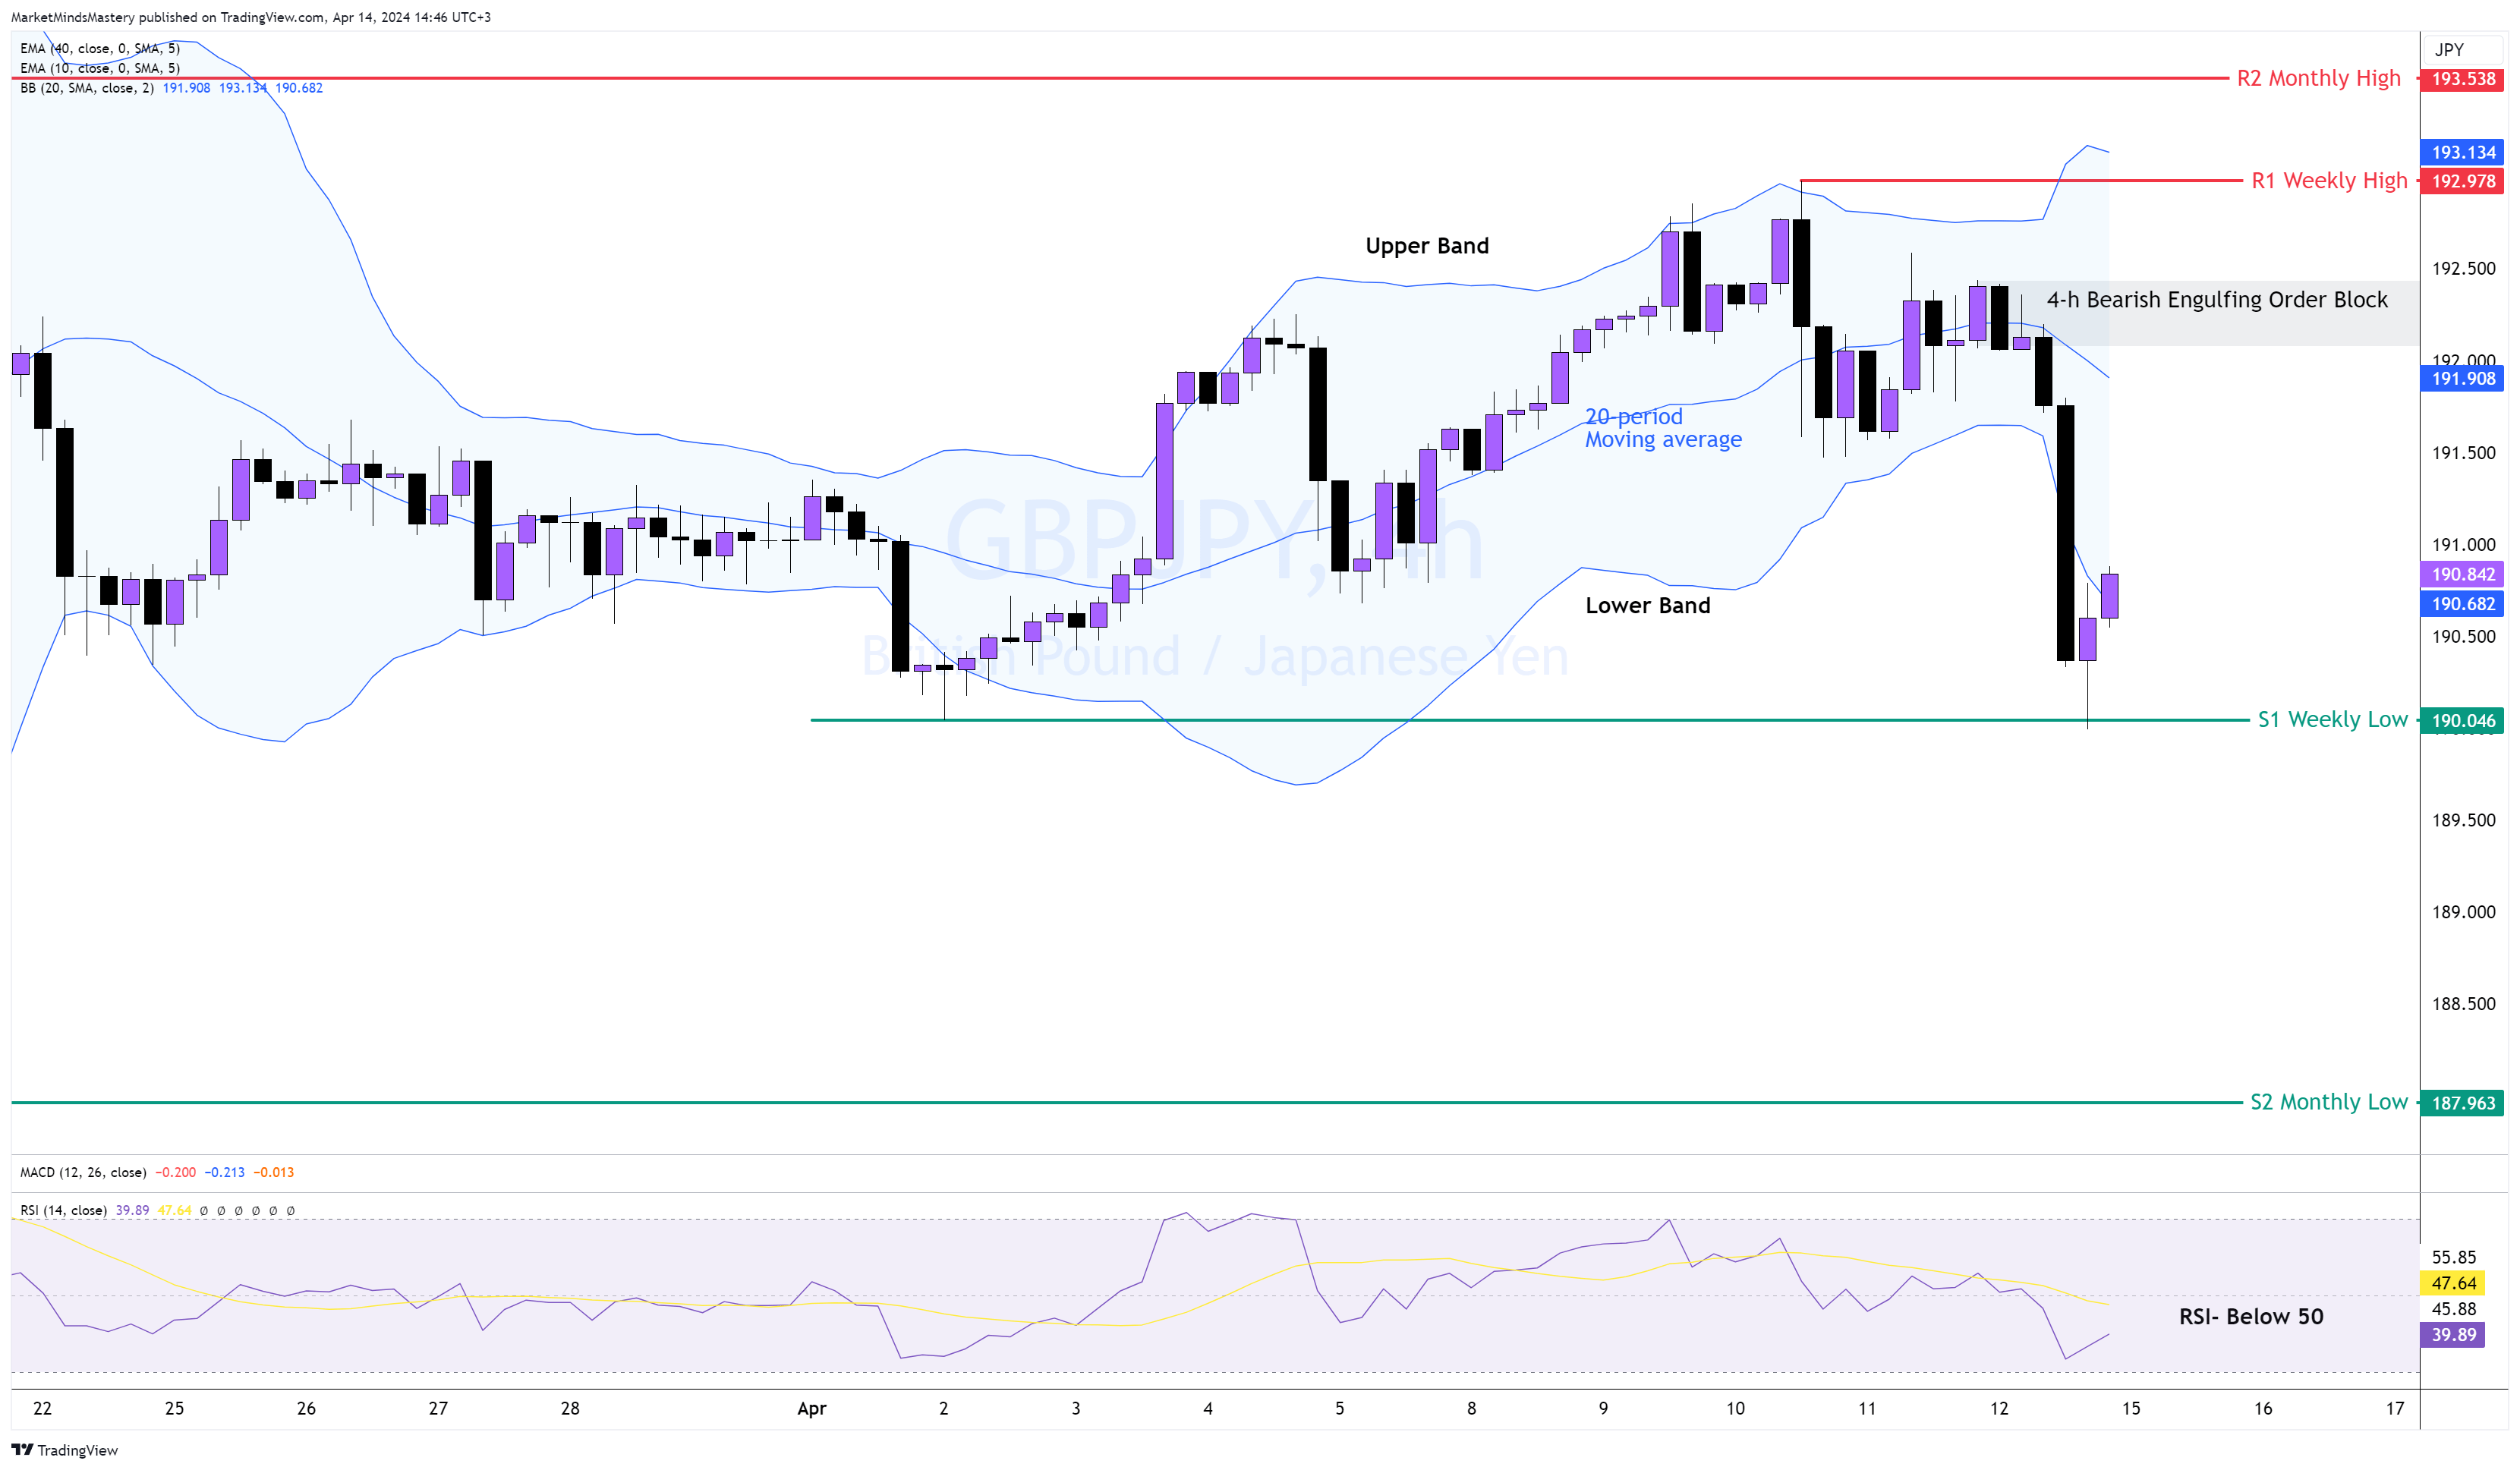
GBP JPY 4H
The overall market structure in the 4-hour chart is trendless. From left to right, the chart shows that the price has not been trending over the last few weeks, without well-defined higher highs and higher lows, nor the opposite, lower highs and lower lows. Therefore, moving averages are not helpful.
Applying the Bollinger Band, the price mostly stays within the upper and lower band with the middle line, meaning the 20-period moving average penetrated quickly by the price. Currently, the RSI oscillator is under 50, indicating bearishness, and the price is trading at the lower band, which is also a bearish indication.
The weekly low, marked on the chart since last week, held and caused the price to move upwards towards the end of last Friday's New York trading session.
Therefore, if the price moves upwards, the first resistance area will be the Bearish Engulfing Order Block shown on the chart above. If the price penetrates the OB and moves higher, the top part of the range will be the R1 resistance, which happened to be the previous week’s high at around 192.978.
On the other hand, if the price declines and moves lower, the previous week’s low will be the first support, S1, around 190.46. A further decline will lead the price to the next significant support, S2, around 187.963
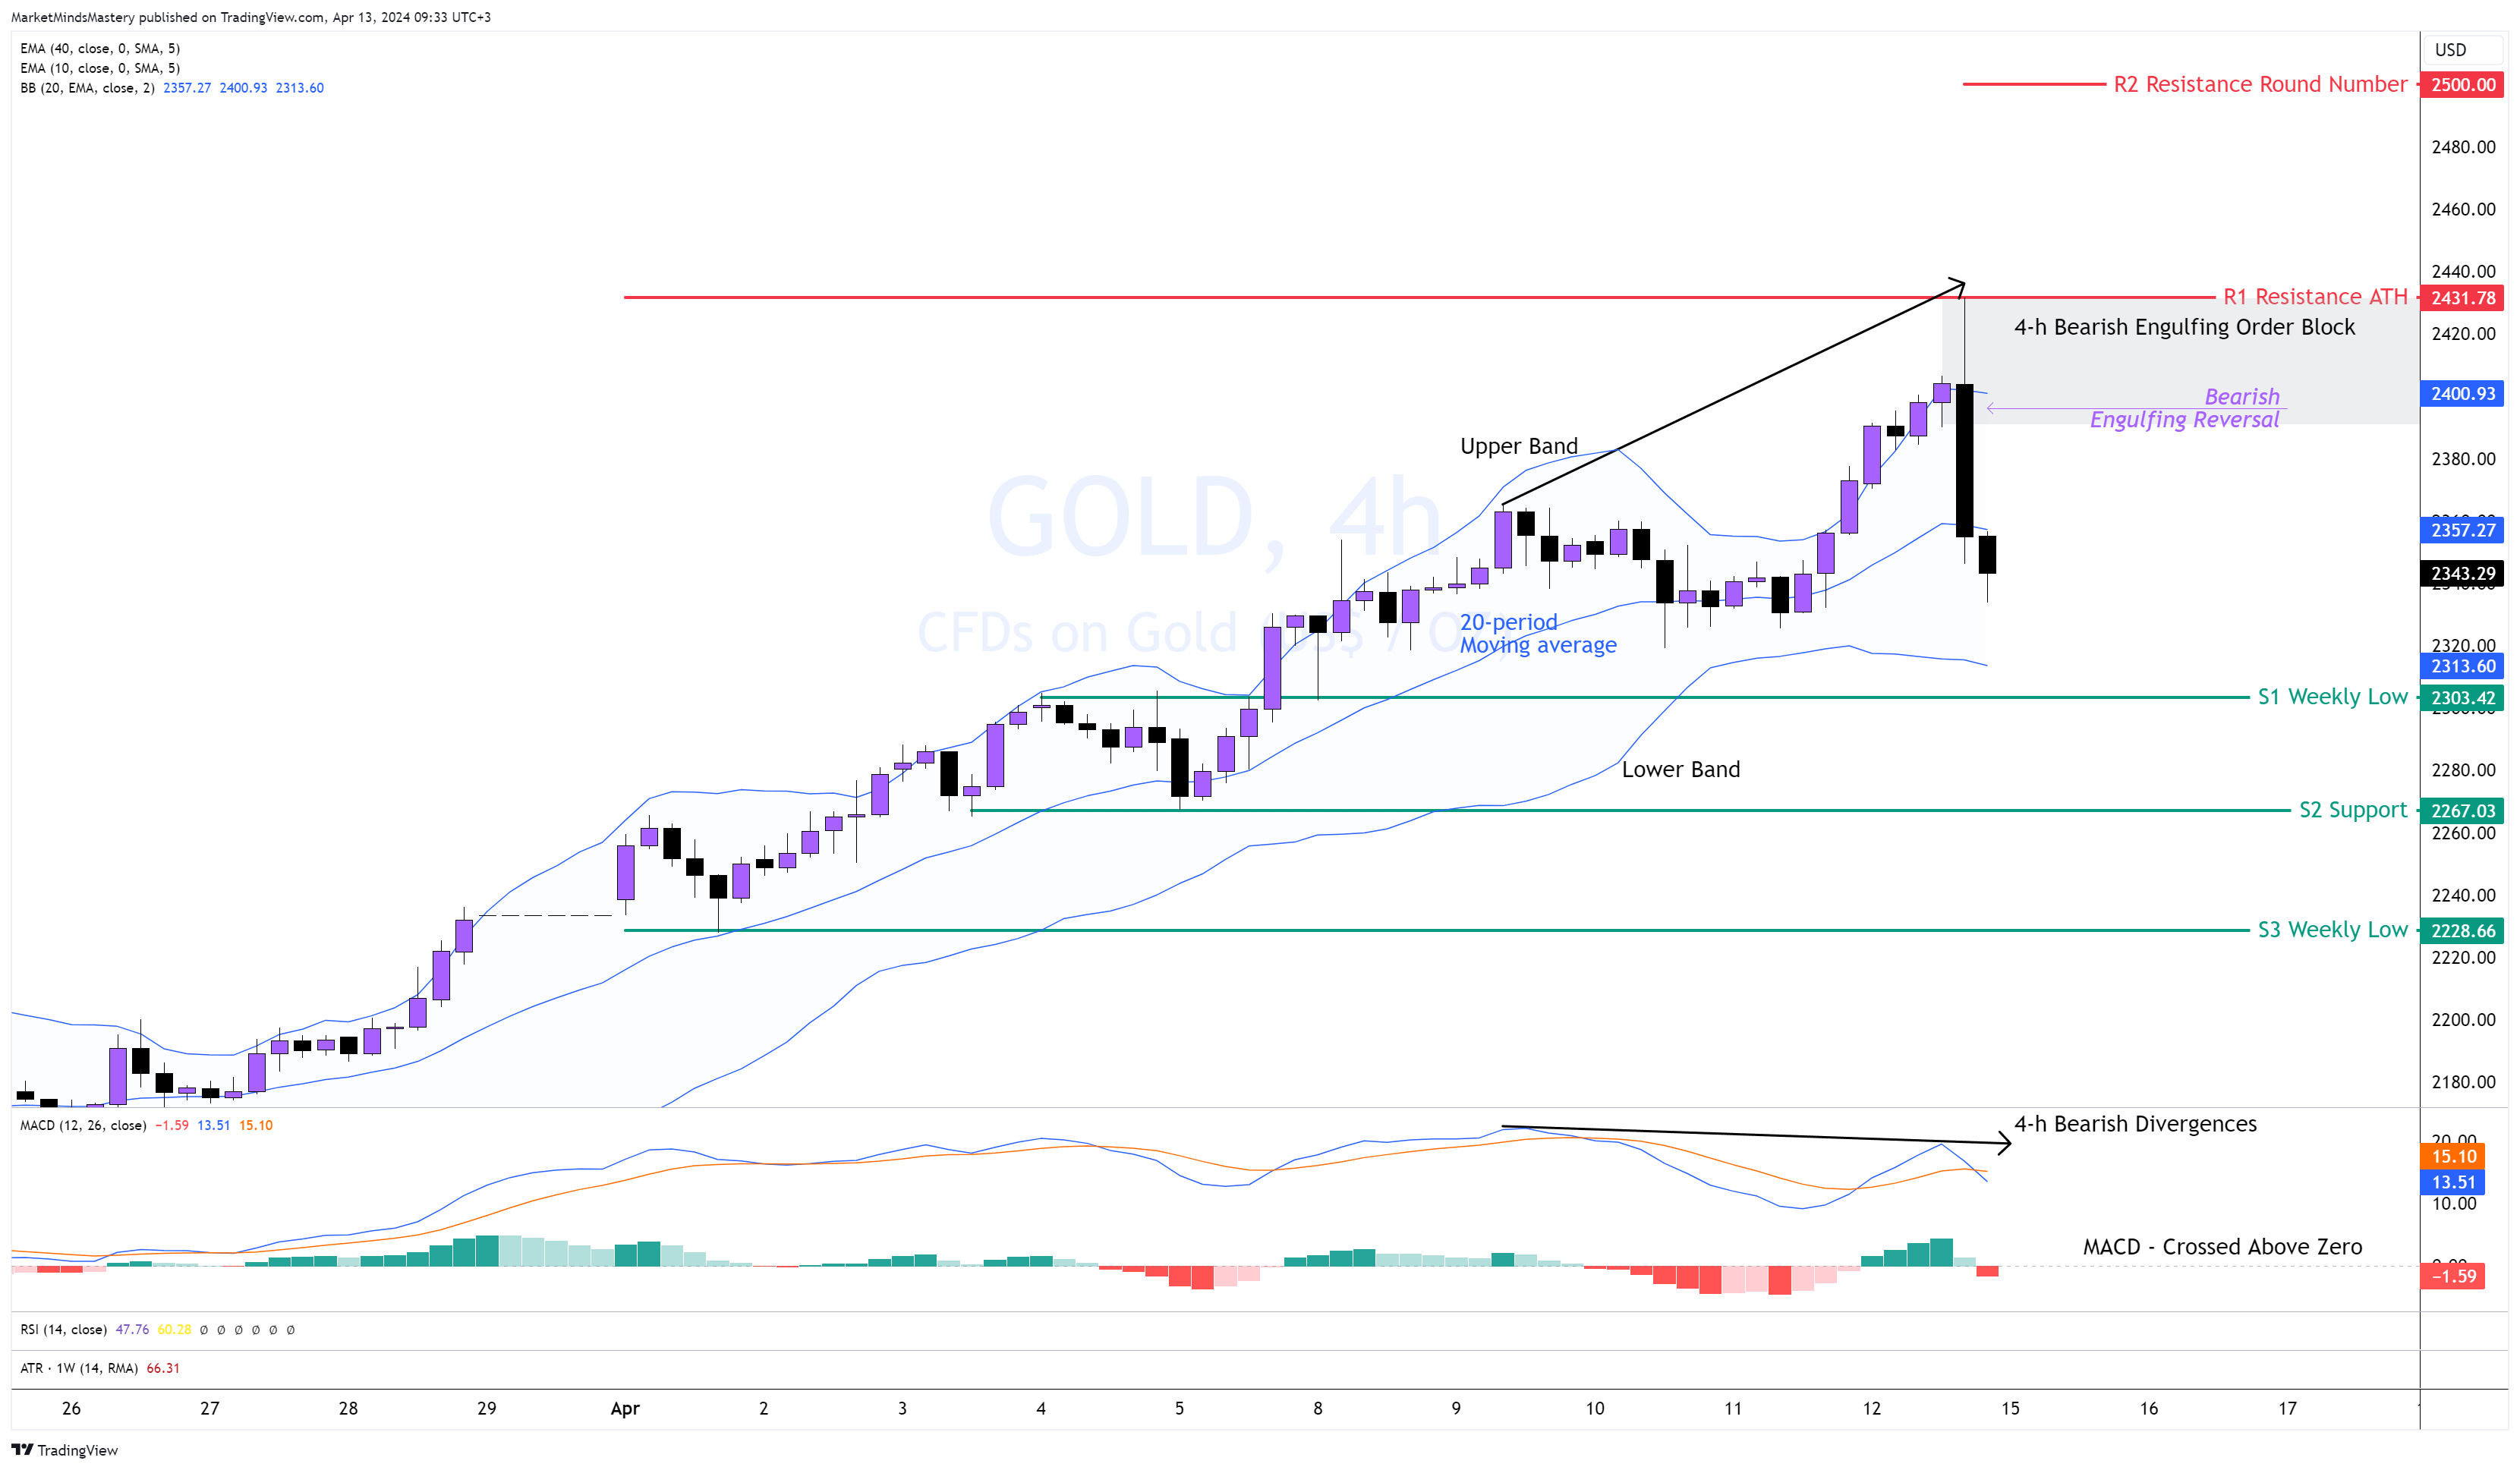
GOLD, 4H
Gold price exploded to the upside last week, creating a new All-Time High around $2431. Despite the optimism about the USD value, the cost of the Gold rose. Additionally, per the previous week’s analysis, the price false broke out at the 200% Fibonacci extension. The Long Bearish Engulfing reversal candle on the 4-hour chart revealed the enormous number of sell orders that entered the market. Based on the market structure, the market is in an uptrend, with a series of higher highs and higher lows. The MACD crossed above the zero line and showed Bearish Divergences. It can cause the price initially to enter a corrective phase.
Starting Monday, the lower band can be a dynamic support if the price moves downwards. However, the previous week’s low, S1, will be relevant support in the market at around $2300. If the price closes under the S1 and keeps moving downwards, the next support area, S2, will be approximately $2267.
Oppositely, if the price moves upwards, the first and only relevant resistance price level is the All-Time high, around $2431. In that area, a well-defined Bearish Engulfing Order Block caused the price collapse the previous week; therefore, the price will require a significant amount of buying orders to be lifted higher. If the price closes above the R1 and keeps moving upwards, the next resistance, R2, can be the $2500 round number. We can not use the Fibonacci extension here because there is no valid swing low when we contact the analysis (as the price can keep moving lower).
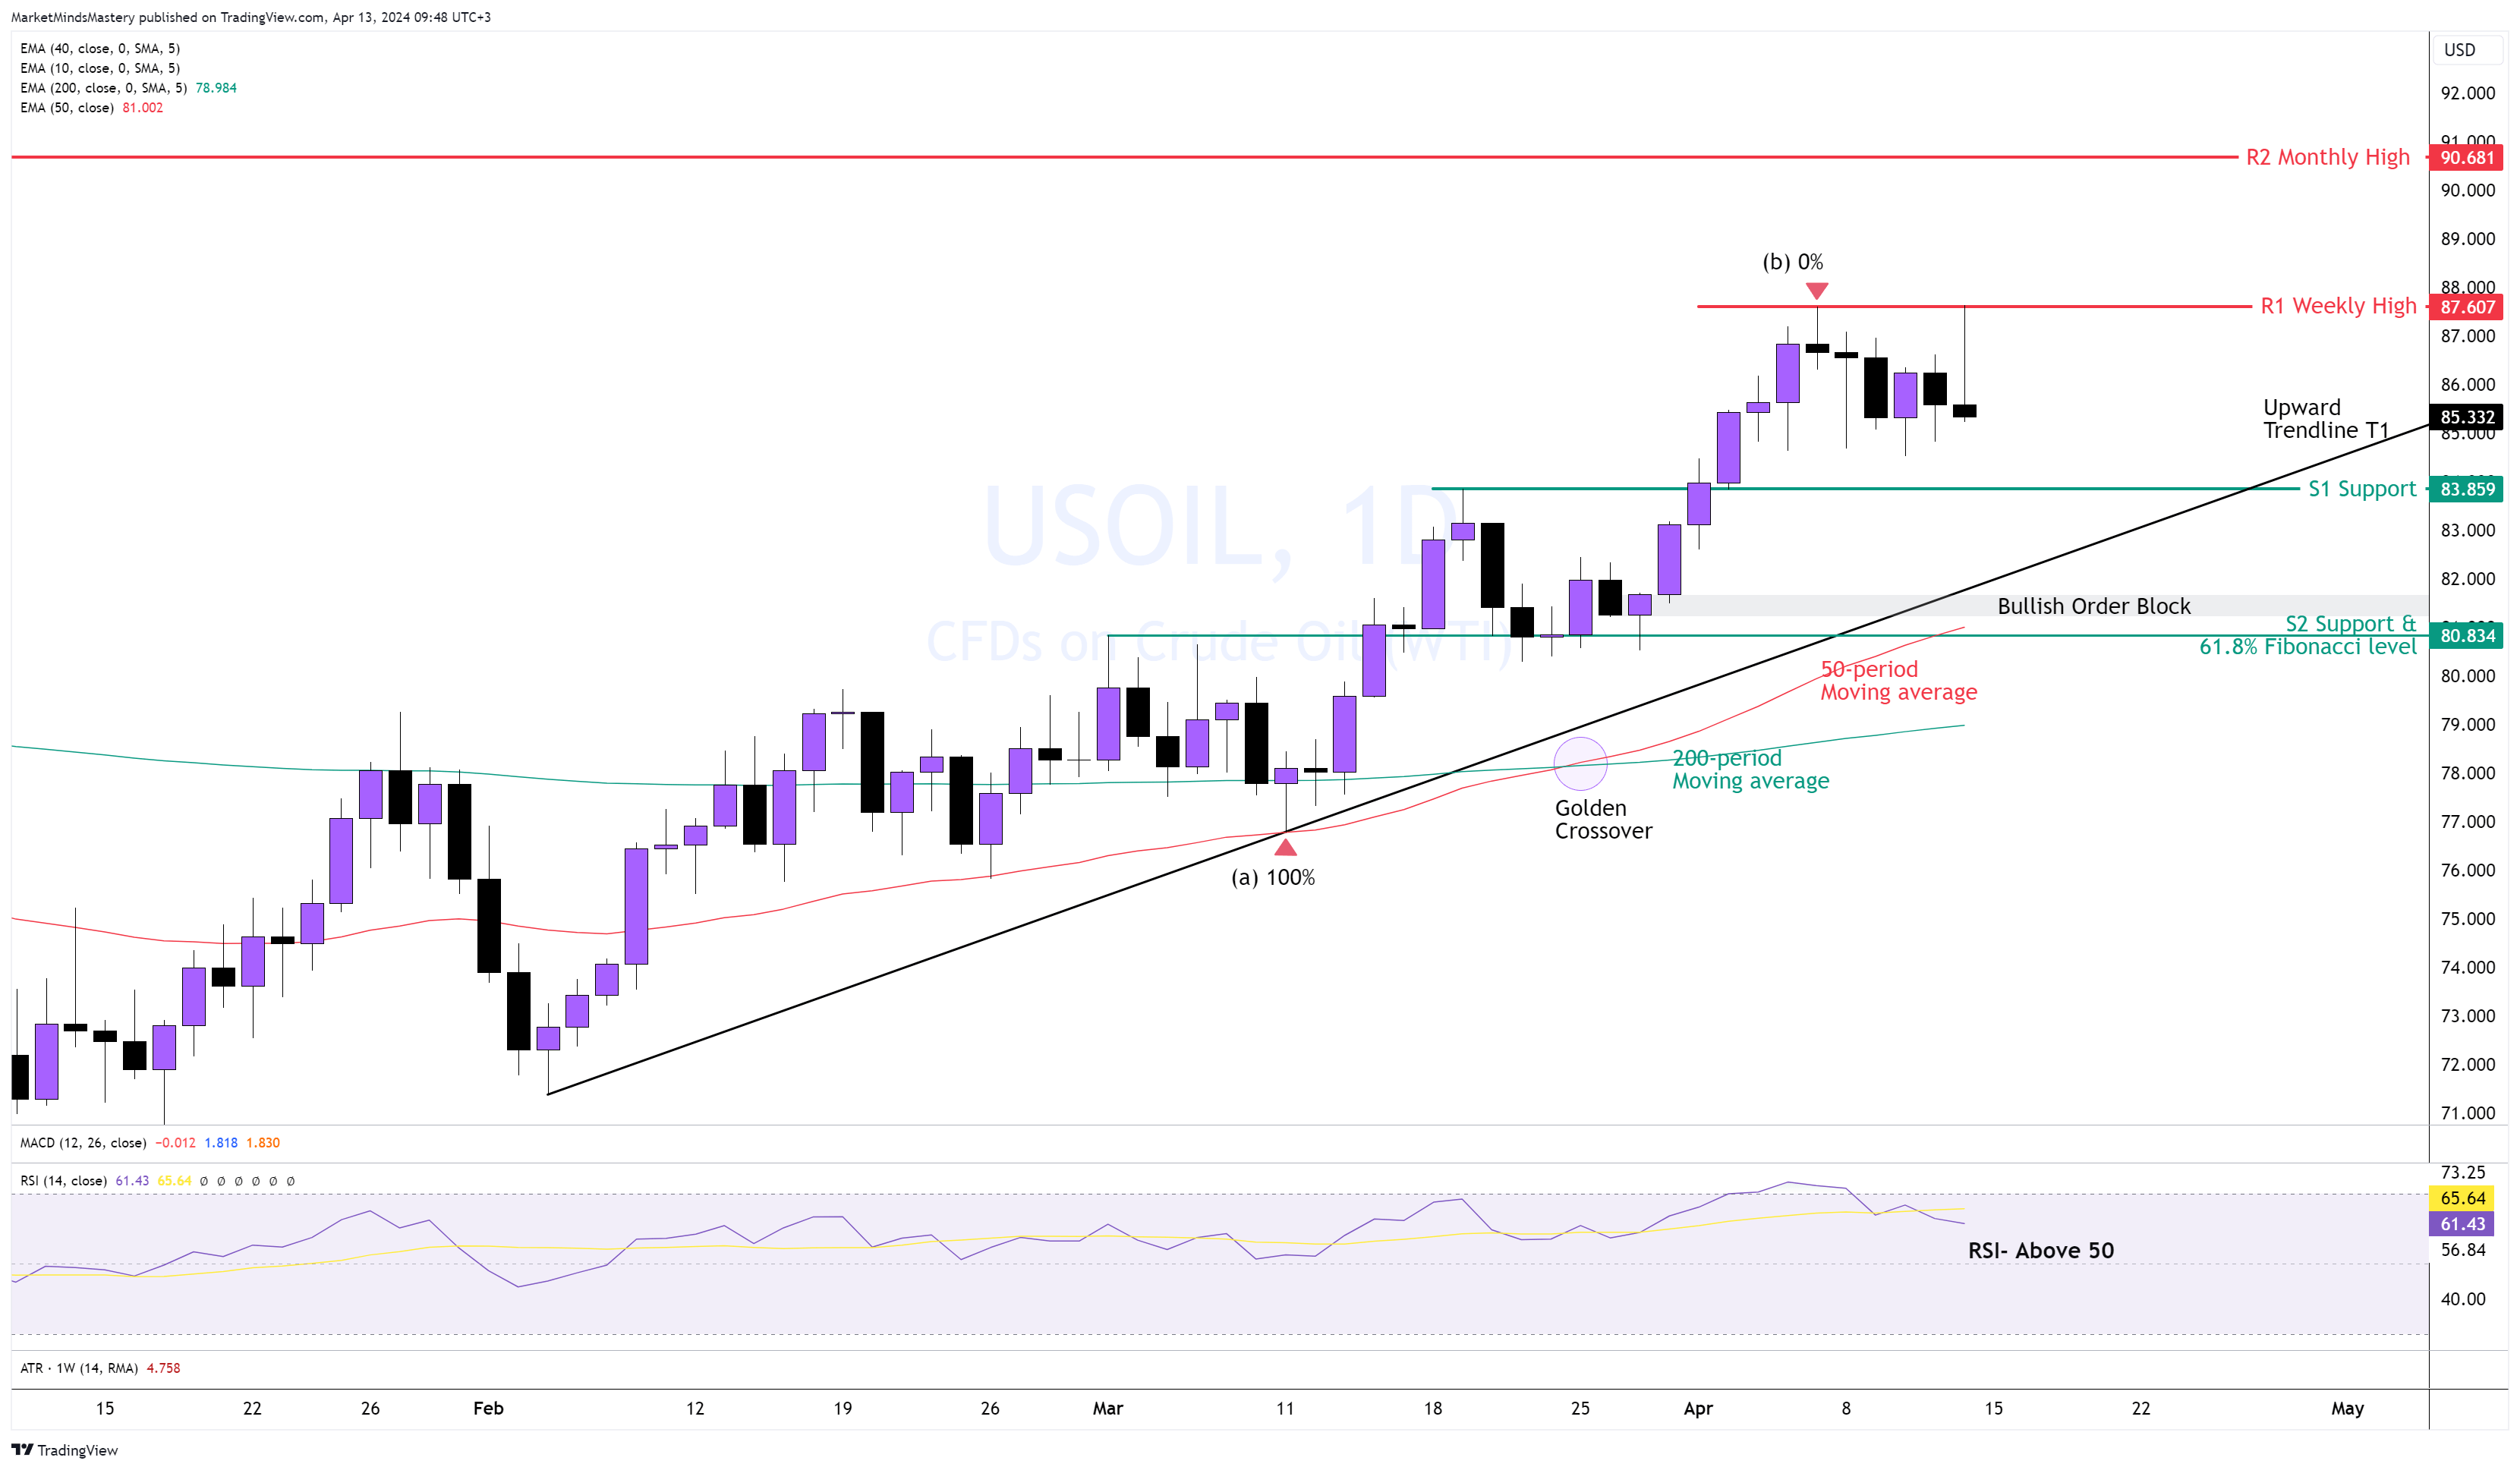
US OIL, Daily
The price of the USOIL appreciated the previous week, and the price almost reached $88 per barrel. On the Daily chart, the price moved in an uptrend, with higher highs and higher lows present. The Golden crossover puts the 50-period above the 200-period moving average, which is a bullish indication. The RSI is above the midline 50, indicating a bullish market. An upward trendline T1 connects two rising lows on the chart. If the price continues upwards, the previous week’s high, R1, can be the first resistance in the Oil market, around $87.60. If the price penetrates the R1, closes above it and moves upwards, the next resistance area, R2, is approximately $90, a recent monthly high. On the other hand, if the price declines and moves downwards, the first area of support, S1, is around $83.85. This is the most recent swing high that can act as a support.
If the price penetrates it and moves lower, the next support area, S2, is approximately $80.83, which is a cluster of multiple price lows, and the Fibonacci Golder ratio is 61.8% if we measure from the swing low at point (a) to the swing high at point (b). The 50-period moving average, the upward trendline T1, and a Bullish Order Block also rest around this area.
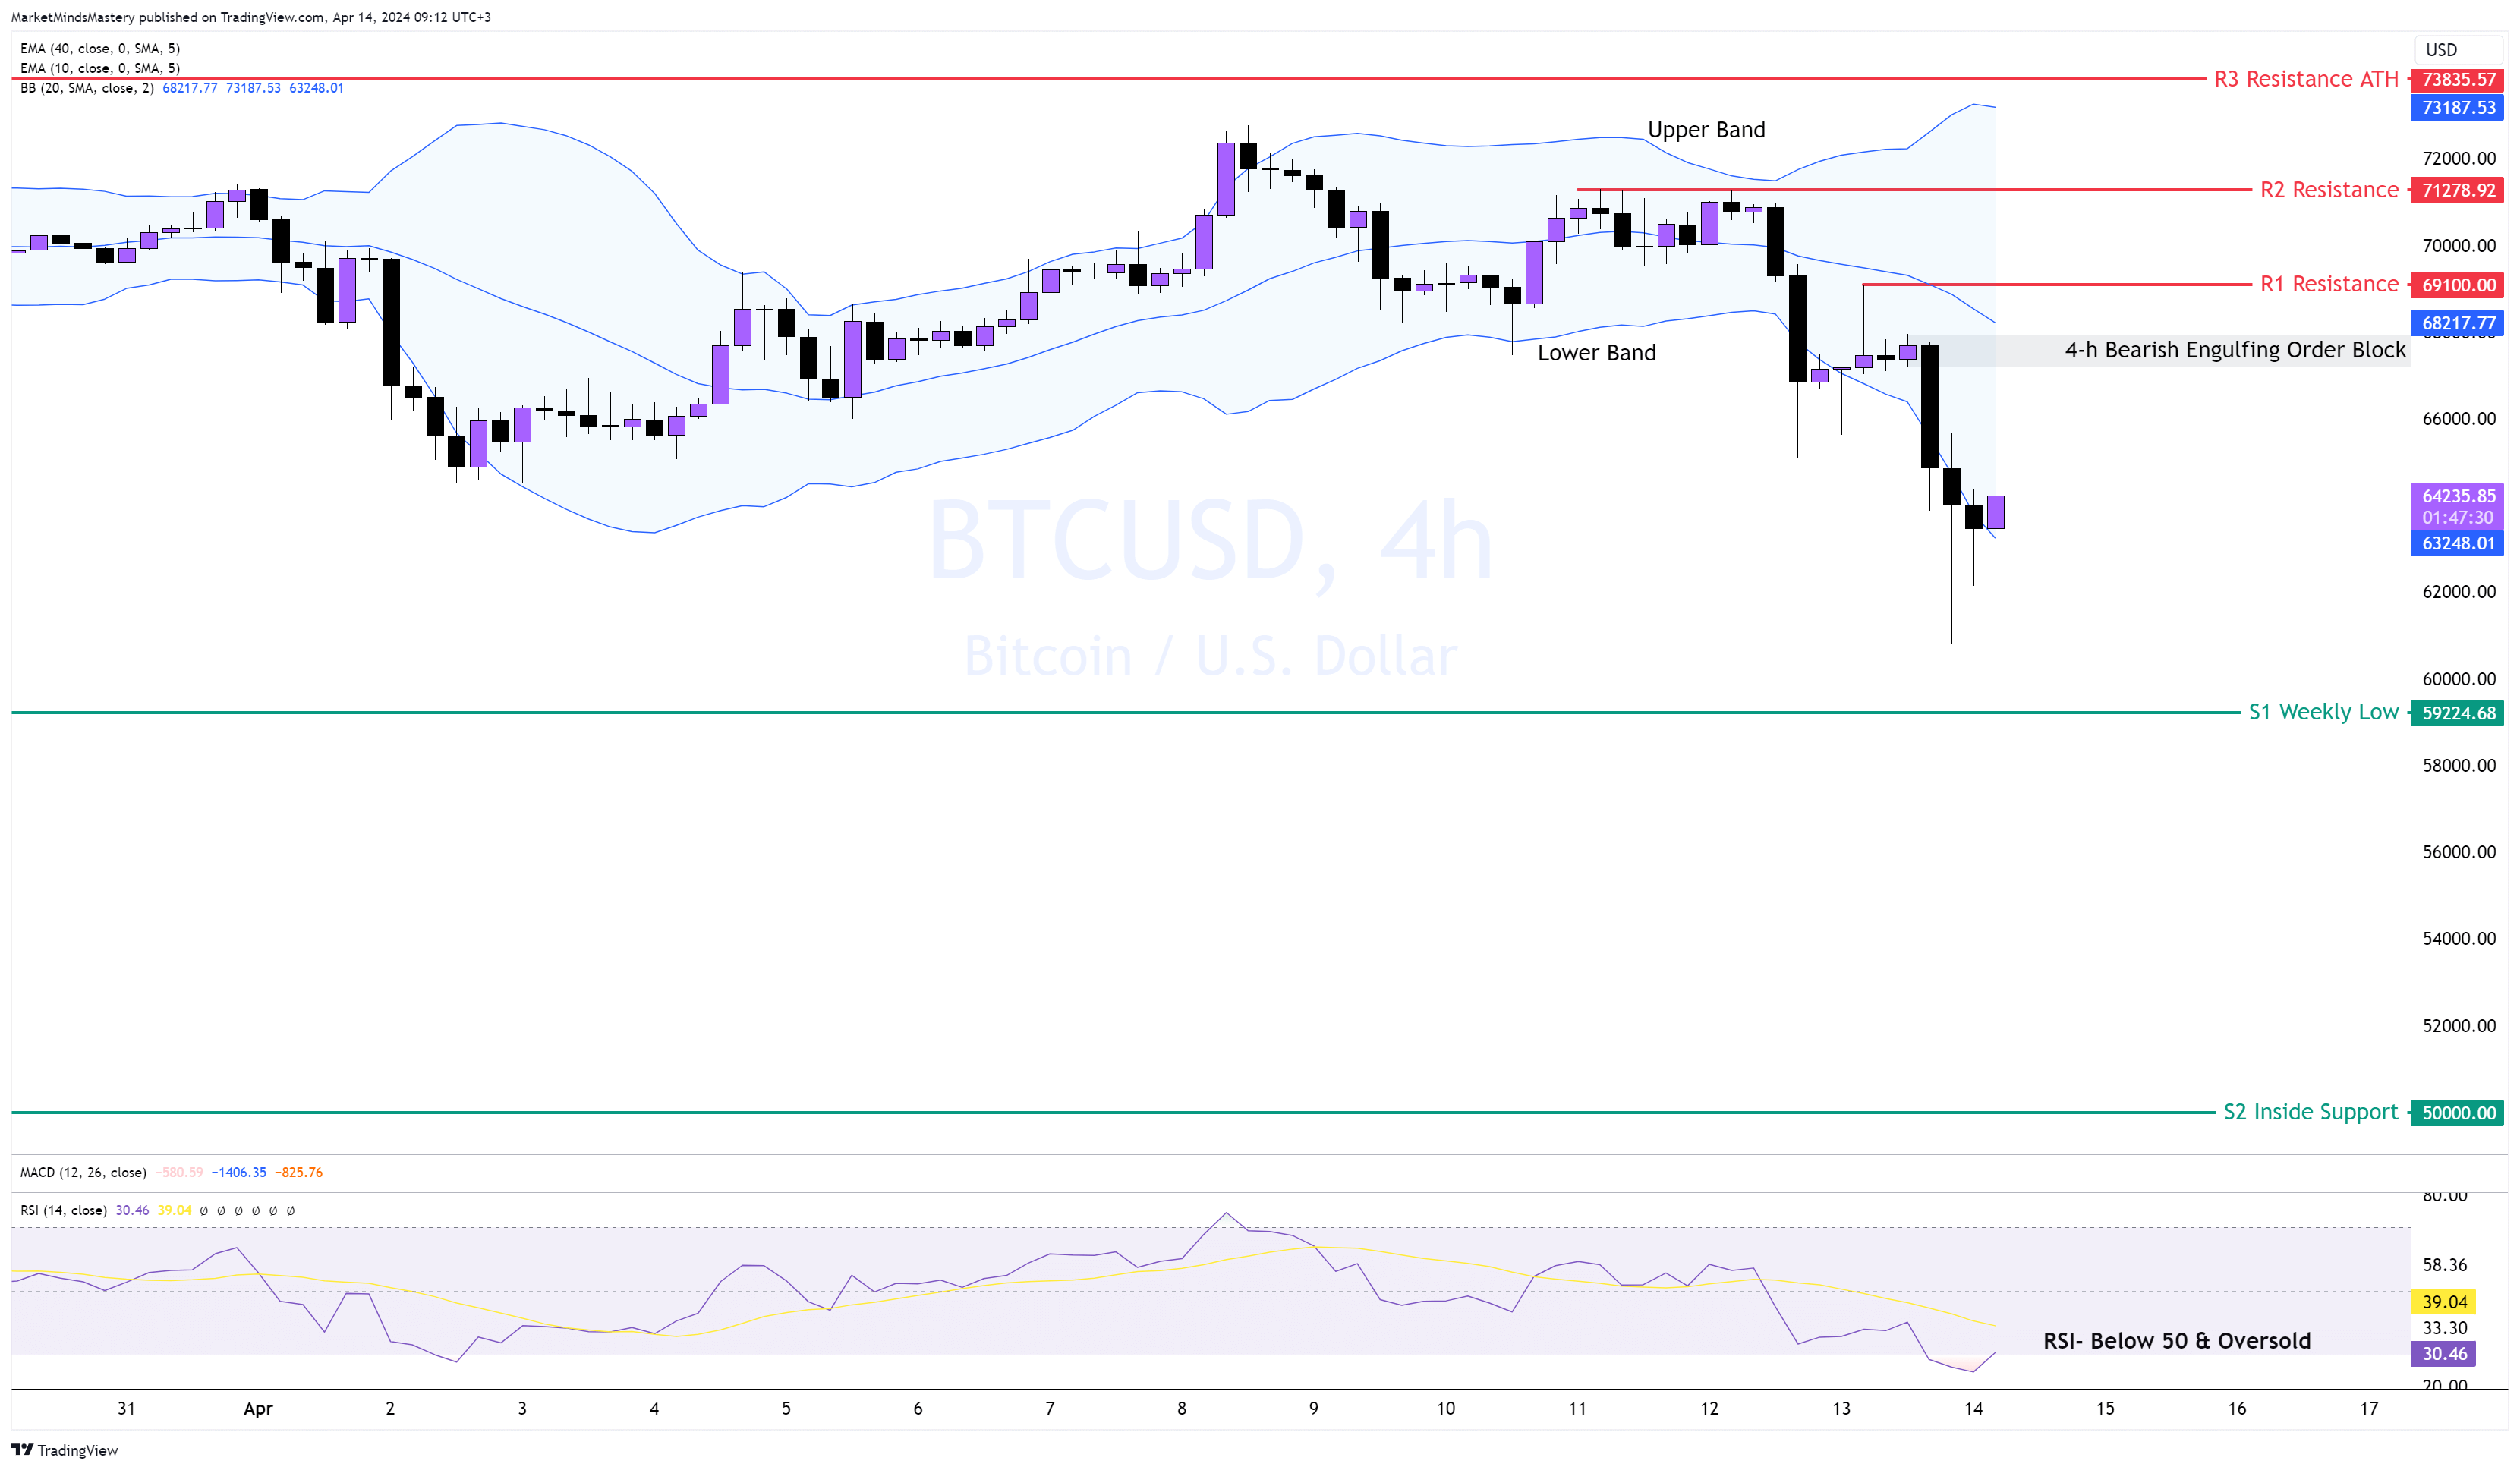
BTC USD, 4H
Following the rejection at the All-Time High price level of around $73835 one month ago, the price started the correction phase, registering lower highs and lower lows. Observing last week’s candles, we see that the black ones (bearish) are longer in quantity than the bullish candles. Especially in the previous downward move, the price created a lower low, and the Upper Band pointed upwards, showing a strong breakout in the market. This is how the Bollinger Bands can validate the strong breakouts. During the last downward move, the price created a Bearish Engulfing Order Block, which can be used for trading opportunities as per traders' strategies.
It is worth mentioning that the RSI oscillator has become oversold for the first time since January. And this is on the 4-hour chart as the market creates more swings than the higher time frames.
If the price continues to move downwards, the first support, S1, is approximately $60000. If the price close below the S1 and declines more, the next support, S2, is around $50000. On the other hand, if the price bounces off and moves upwards, the first resistance area, R1, is around $69100, with the Bearish Engulfing Order BLock under it. If the price surpasses R1 and continues upward, the next resistance area, R2, will be around $71200.
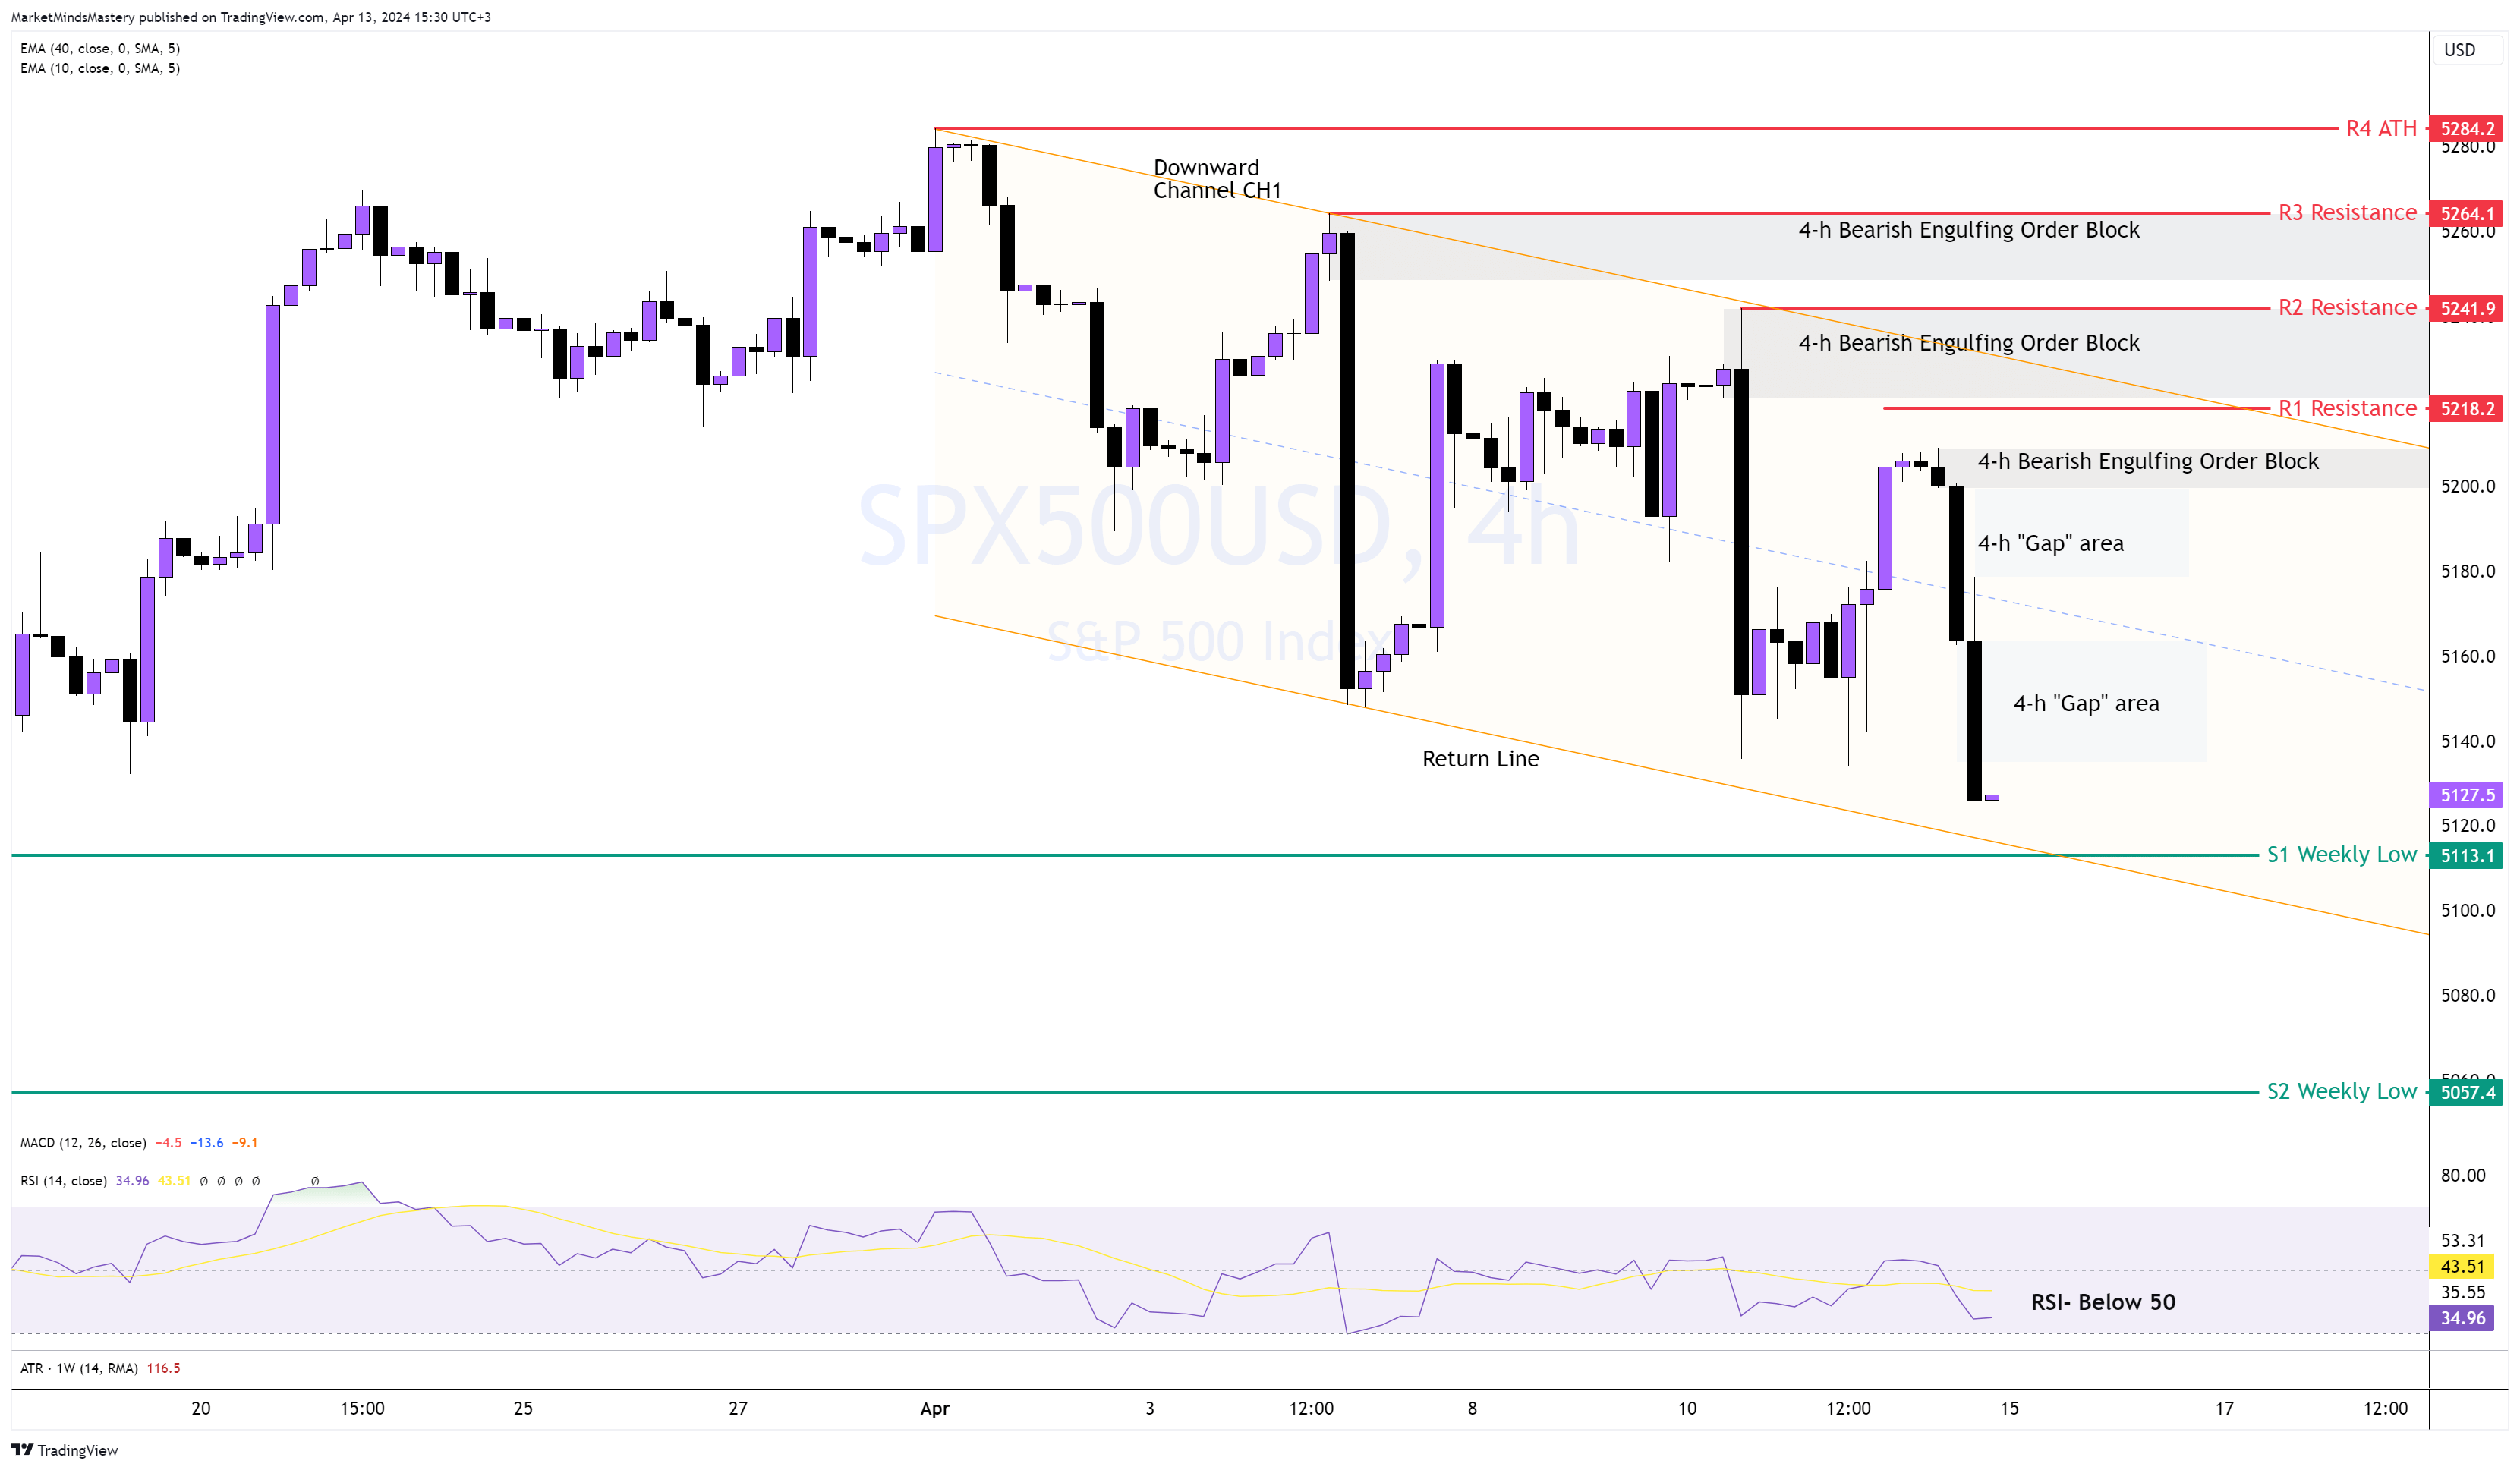
SP 500, 4H
Following the previous week’s forecast, the price of the SP 500 on the weekly chart followed through, and the market declined, causing the weekly price correction. On the 4-hour chart, the price looks like a downtrend with a series of lower highs and lower lows, which can be established within a downward channel CH1. The extended bearish candles on the chart define the aggressive sell orders accumulated during significant news events in the US. The RSI oscillator is under the middle line, indicating bearishness. Currently, the price is supported at the S1 price level, which is a weekly low price, and the market respected it the previous Friday. Also, the price bounced off from the return line of the CH1 channel.
Hence, if the price stays above the S1 support and moves upwards, the “Gaps” will likely be filled, and the price may enter into the Bearish Engulfing Order Block under the R1 resistance around $5218. The confluence of the R1 and the CH1 trendline can cause the price setbacks. If the price penetrates the R1 and moves upwards, the next resistance area, R2, is around $5241, with another well-defined Bearish engulfing Order Block present.
On the other hand, if the price declines and moves downwards, the first support area, S1, is approximately $5113. If the price penetrates it and moves lower, the next support area, S2, is around $5057, another weekly low.
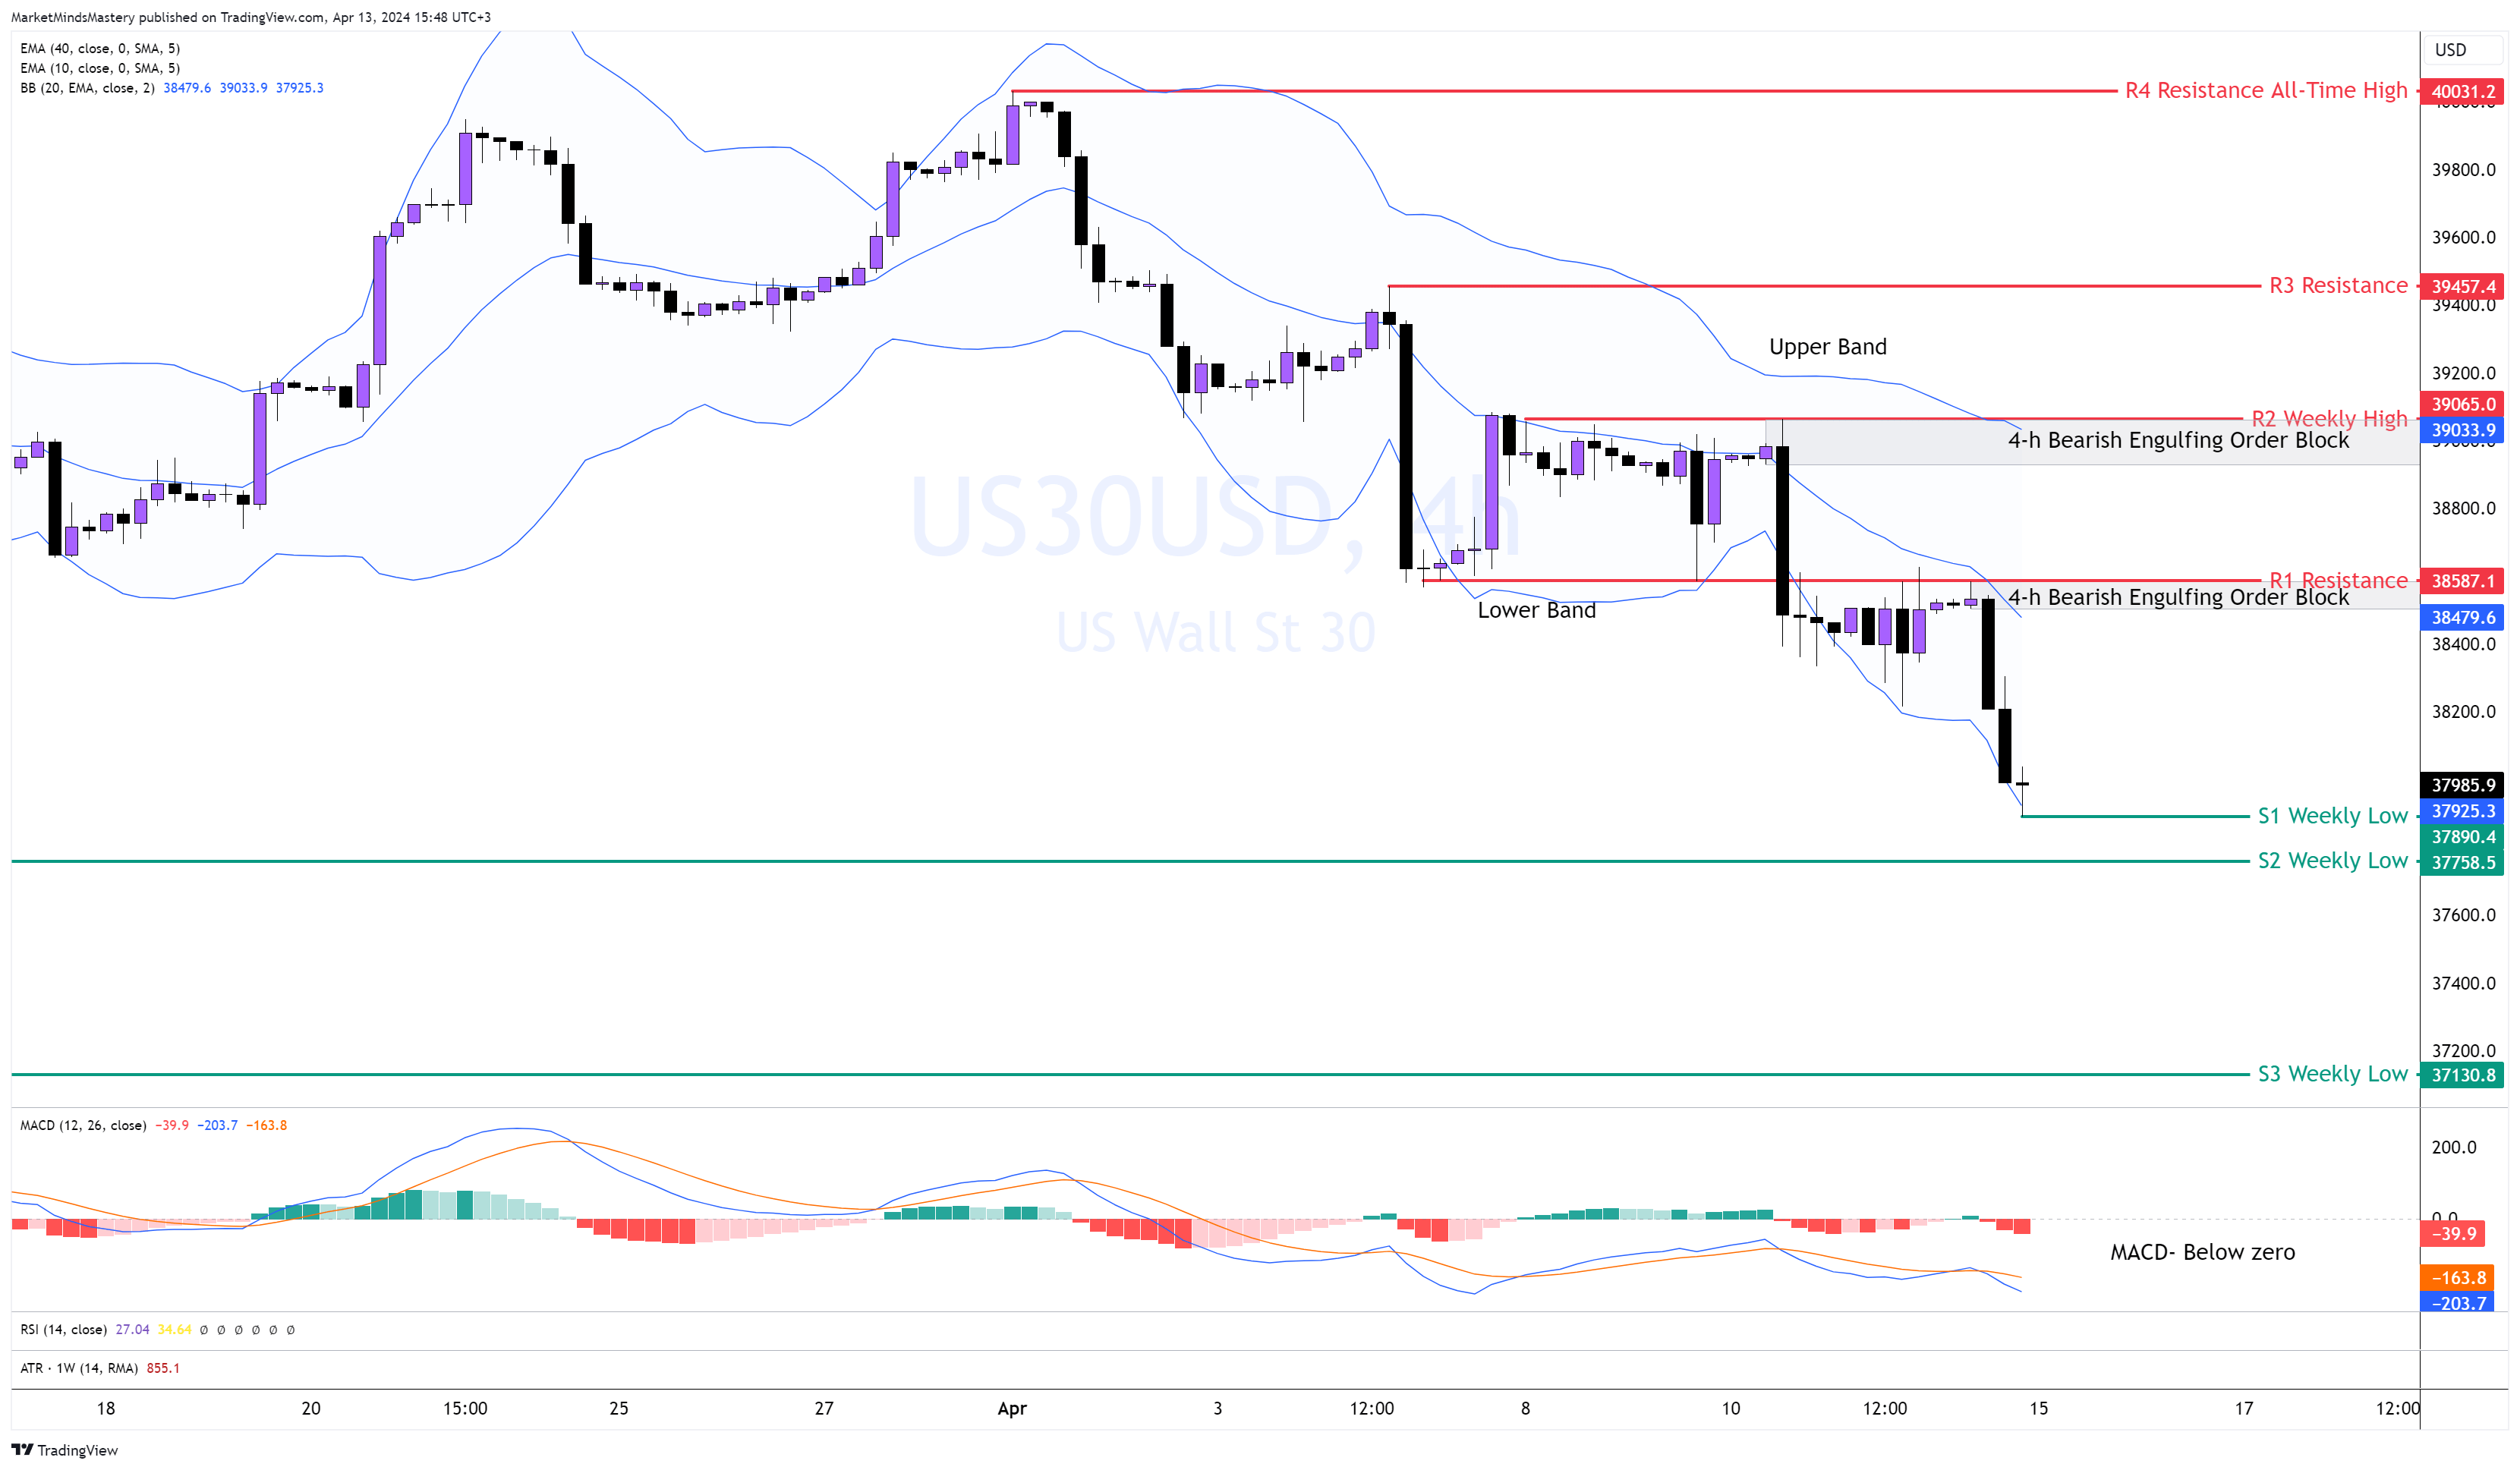
US 30, 4H
Following the downward move from last week, the price kept lowering, creating a series of lower highs and lower lows. If the weekly chart resumes its upward move, we will see a change in market direction on the 4-hour chart, from a downtrend to an uptrend. Using the Bollinger Bands, the market trades well under the middle of the BB, equivalent to the 20-period moving average. The market created two Bearish Engulfing Order Blocks in the last two new impulsive legs. The MACD is under the zero line, indicating bearishness in the 4-hour time frame. Therefore, if the price continues to move downwards, the first support area will be the previous week’s low, S1, approximately $37890. If the price penetrates the S1 and continues its download move, the next support area, S2, is around $37758.
On the other hand, if the price moves upwards, the first resistance area, R1, is around $38587. The first Bearish Engulfing Order Block has been created at this price level. A further upward move will find the next resistance area, R2, around $39065, which is the previous week’s high.
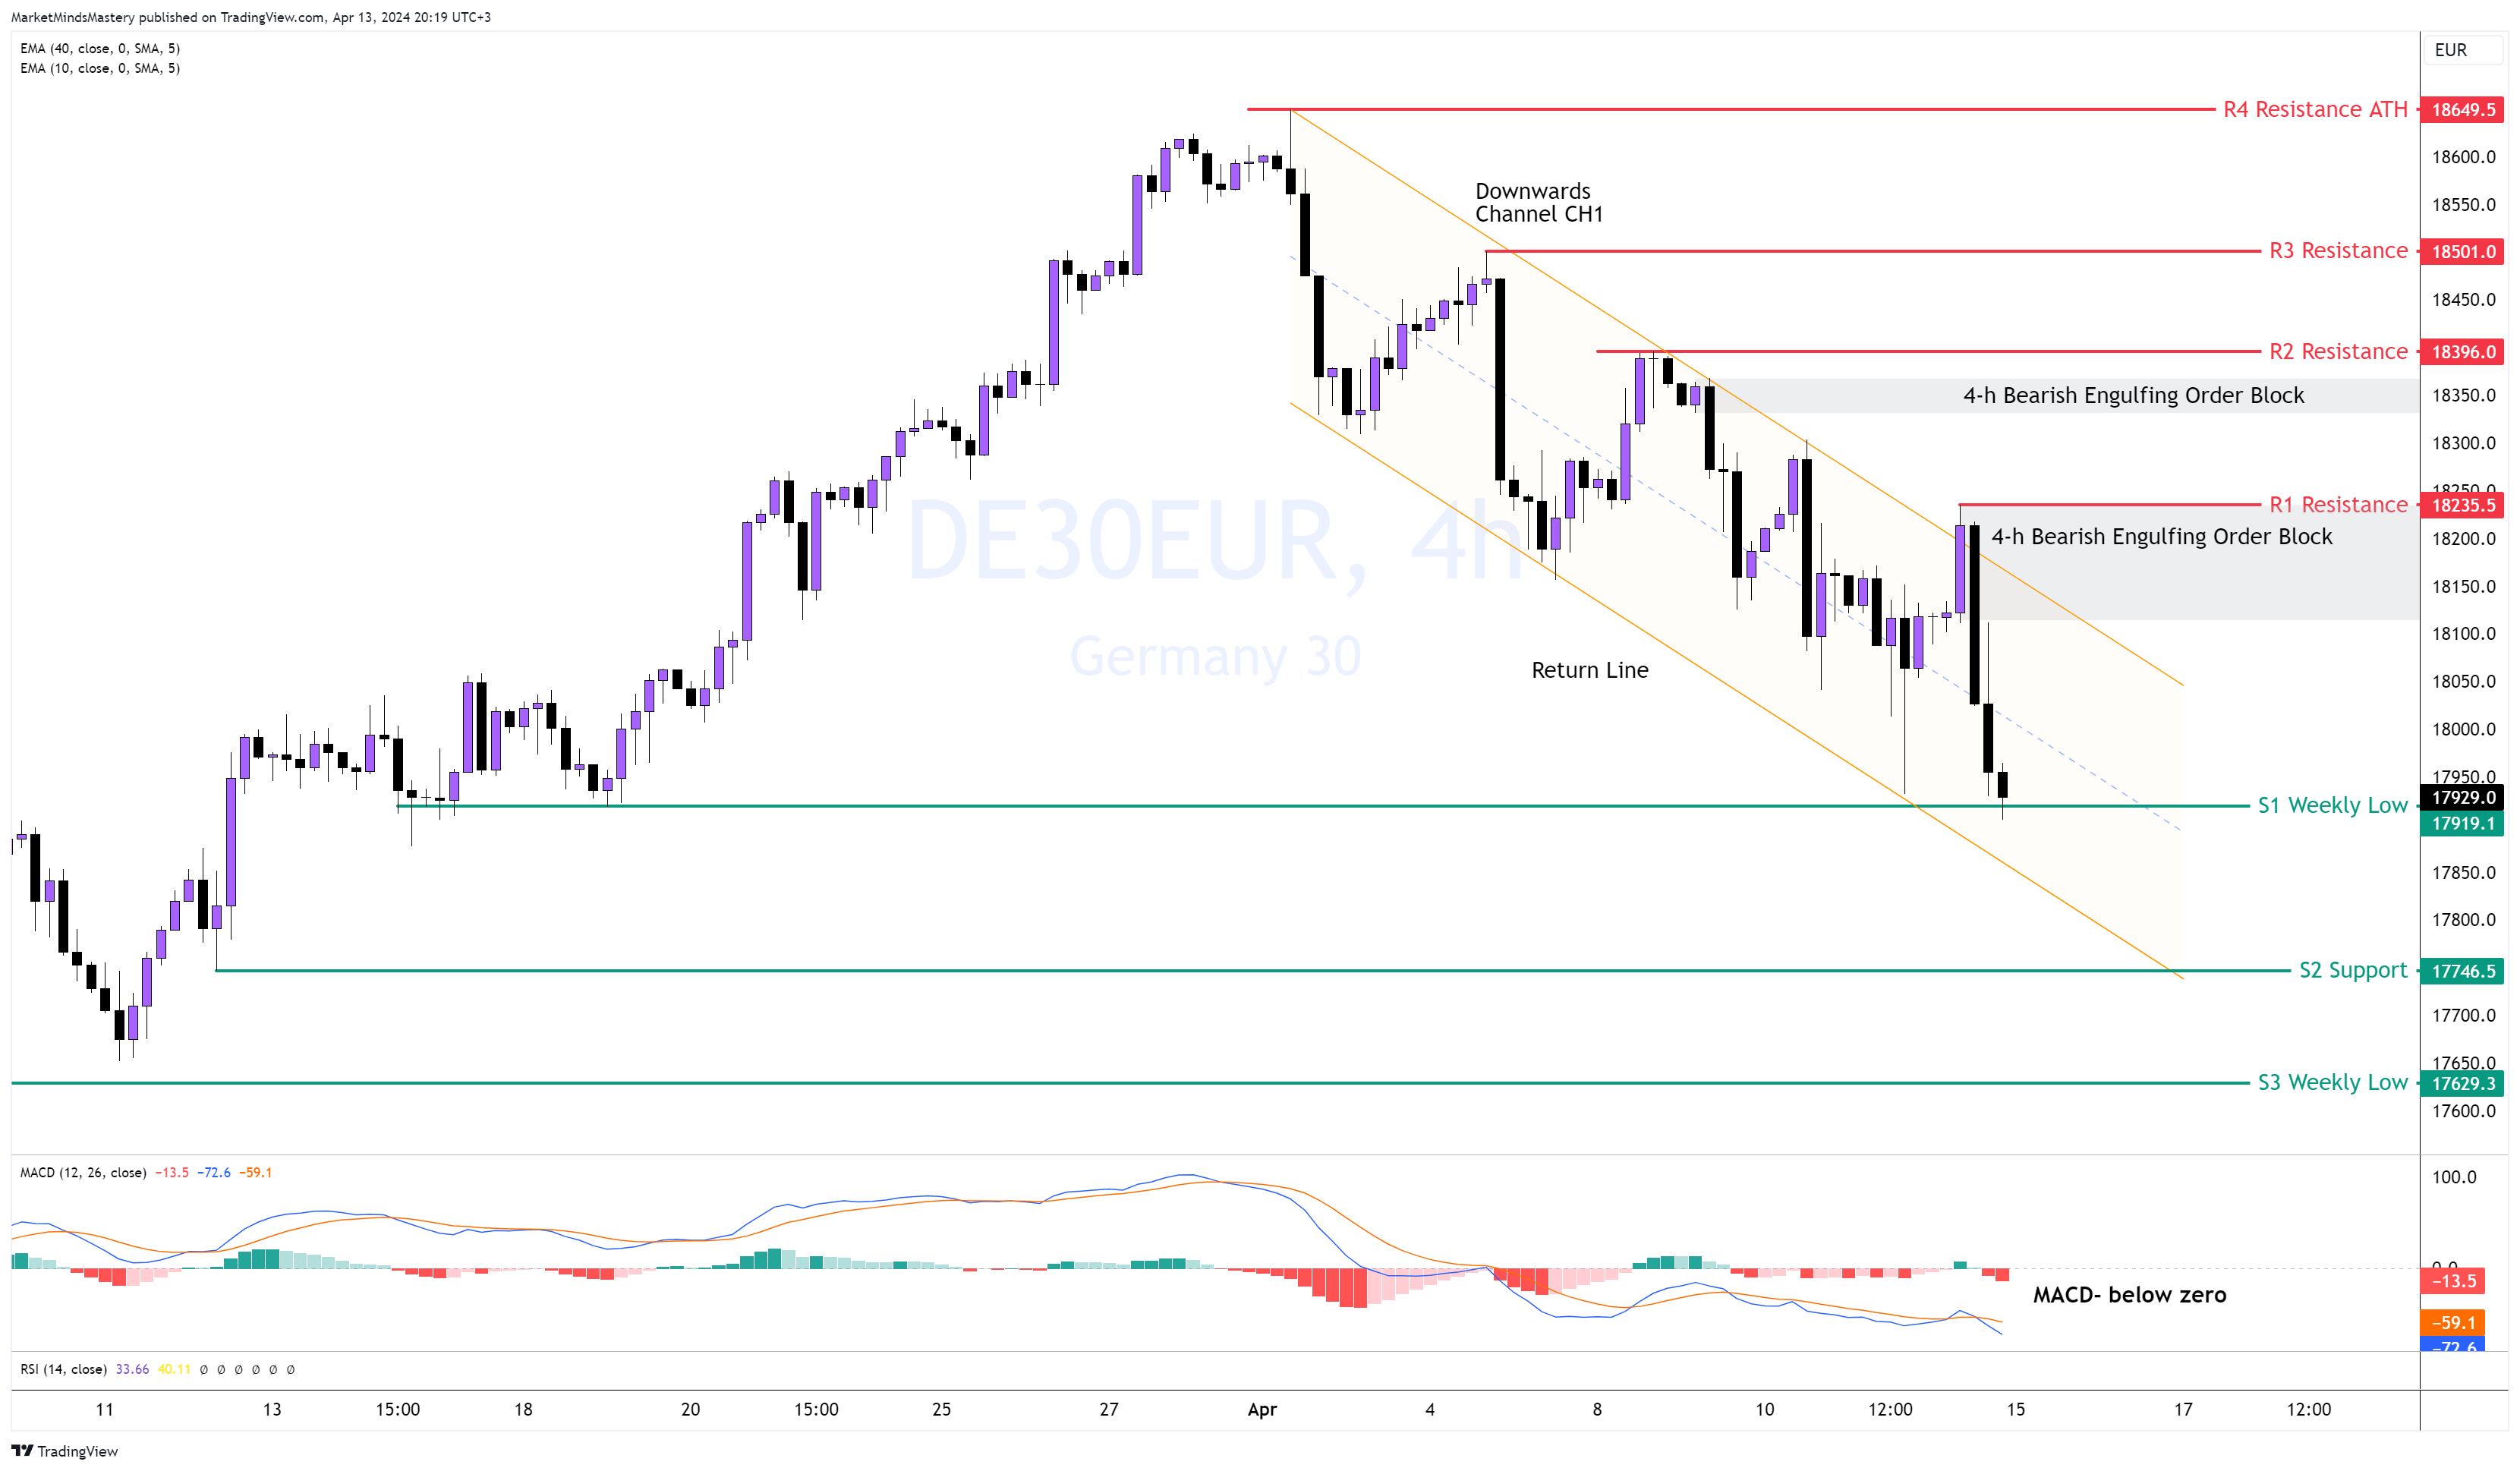
GER 30, 4H
Following the drop of the price per the weekly chart correction, the price on the 4-h bounced off from the Bullish Engulfing Order Block we marked on the previous week’s analysis and moved higher. The week ended with a long bearish candle confirming the swing high on the weekly chart.
Based on the 4-hour chart pattern, the price moves downward with lower highs and lower lows being present. Also, the price can be included within a downward channel, CH1. The price respects both the downward trendline and the return line of the channel, and they both worked as resistance and support lines, respectively.
The MACD line crosses under the Signal line on the MACD indicator, which has bearish implications.
If the price finds support from Monday onwards and moves upwards, the R1 resistance will be the first significant price level, around 18235, with a Bearish Engulfing Order Block sitting there. Additionally, the downward trendline of the CH1 is approximately at the same level. If the price penetrates the R1 and moves upwards, the next resistance area, R2, is around 18396. On the other hand, if the price continues moving downwards, the first support area becomes the return line of the CH1 channel, with a significant static level of the S2 of approximately 17746. Further decline can lead the price to the S3 support level, which is a weekly low, around 17629.
👉 Click here to check our Challenges
👉 Don’t miss our Free Live Webinars
👉Join us on Discord
Risk Disclosure:
The Trading Pit offers only demo accounts to all users within the Challenges and Signal Provider Agreements (Scaling Plan). All assets and trading activities are purely virtual. Please note that we do not offer CFD (Contract for Difference) challenges to residents of Canada and the United States. All content and information on this website is for informational purposes only and should not be interpreted as financial advice. Also, remember that results achieved in the past are no guarantee of future results. It is essential to understand the risks associated with trading. If you are unsure, always consult an independent financial advisor.