The Trading Pit Week Ahead Market Outlook (March 11 – March 17)
Last week, the Bank of Canada kept its interest rates unchanged at 5% and the European Central Bank's interest rate at 4.5%. Non-farm payrolls ( in the US) were higher than expected. However, the US Dollar didn't show significant strength. This week will be a short week in terms of significant news events.
Starting Monday, Japan will report the GDP (Gross Domestic Product) for the fourth quarter, and the consensus is that an improvement of 0.4% will be achieved.
Last quarter, the GDP was -0.1% and is expected to increase to 0.3%. This will be the only significant event directly affecting the Japanese Yen. Last week, the Japanese Yen was one of the strongest currencies. If the outcome favours the Yen and the market follows through, more strength is expected for the Japanese currency.
On Tuesday, Germany will report the CPI (Consumer Price Index), which is estimated to remain unchanged at 2.7%. Based on the consensus, stability is expected for the Euro. Last week, however, the Euro took advantage of the weakness of the USD and gained some strength. If the CPI outcome is appreciated by the market participants and the Euro shows strength, a more upward move can be seen on the EURUSD. On the other hand, if the Euro loses some value and the Japanese Yen gains more strength, it might offer good tradable opportunities for the EURJPY pair, and a price decline may occur. This event will be the only event that affects the Euro this week. The Unemployment Rate will be reported on the same day in the UK. The exact number as in the previous report is expected also this time, and the unemployment rate will remain at 3.8%. The Sterling was a solid currency last week, and if the outcome favours the Pound and the market follows through, the uptrend on the GBPUSD may continue as per our chart analysis (refer to the GBPUSD 4-h analysis). This will be the only significant event for Sterling.
The USD will be on the scope for the rest of the week, with three significant events until Friday.
On Tuesday, the CPI ( Consumer Price Index) will be reported. As per the consensus, the 3.1% is expected to remain unchanged. The CPI numbers are usually helpful in measuring a country's inflation level. The Retail Sales will be reported on Thursday, and an improved number is expected to be reported. The last report’s Retail Sales was -0.8%. This time, the consensus estimated a rise to 0.5%. If such an improvement occurs and the market follows through, strength in the USD is expected to be seen on the chart.
The last event for the week will be on Friday, again regarding the USD and will be the Michigan Consumer Sentiment Index. It is a survey gauging consumer sentiment in the United States by the University of Michigan.
EURUSD,4H

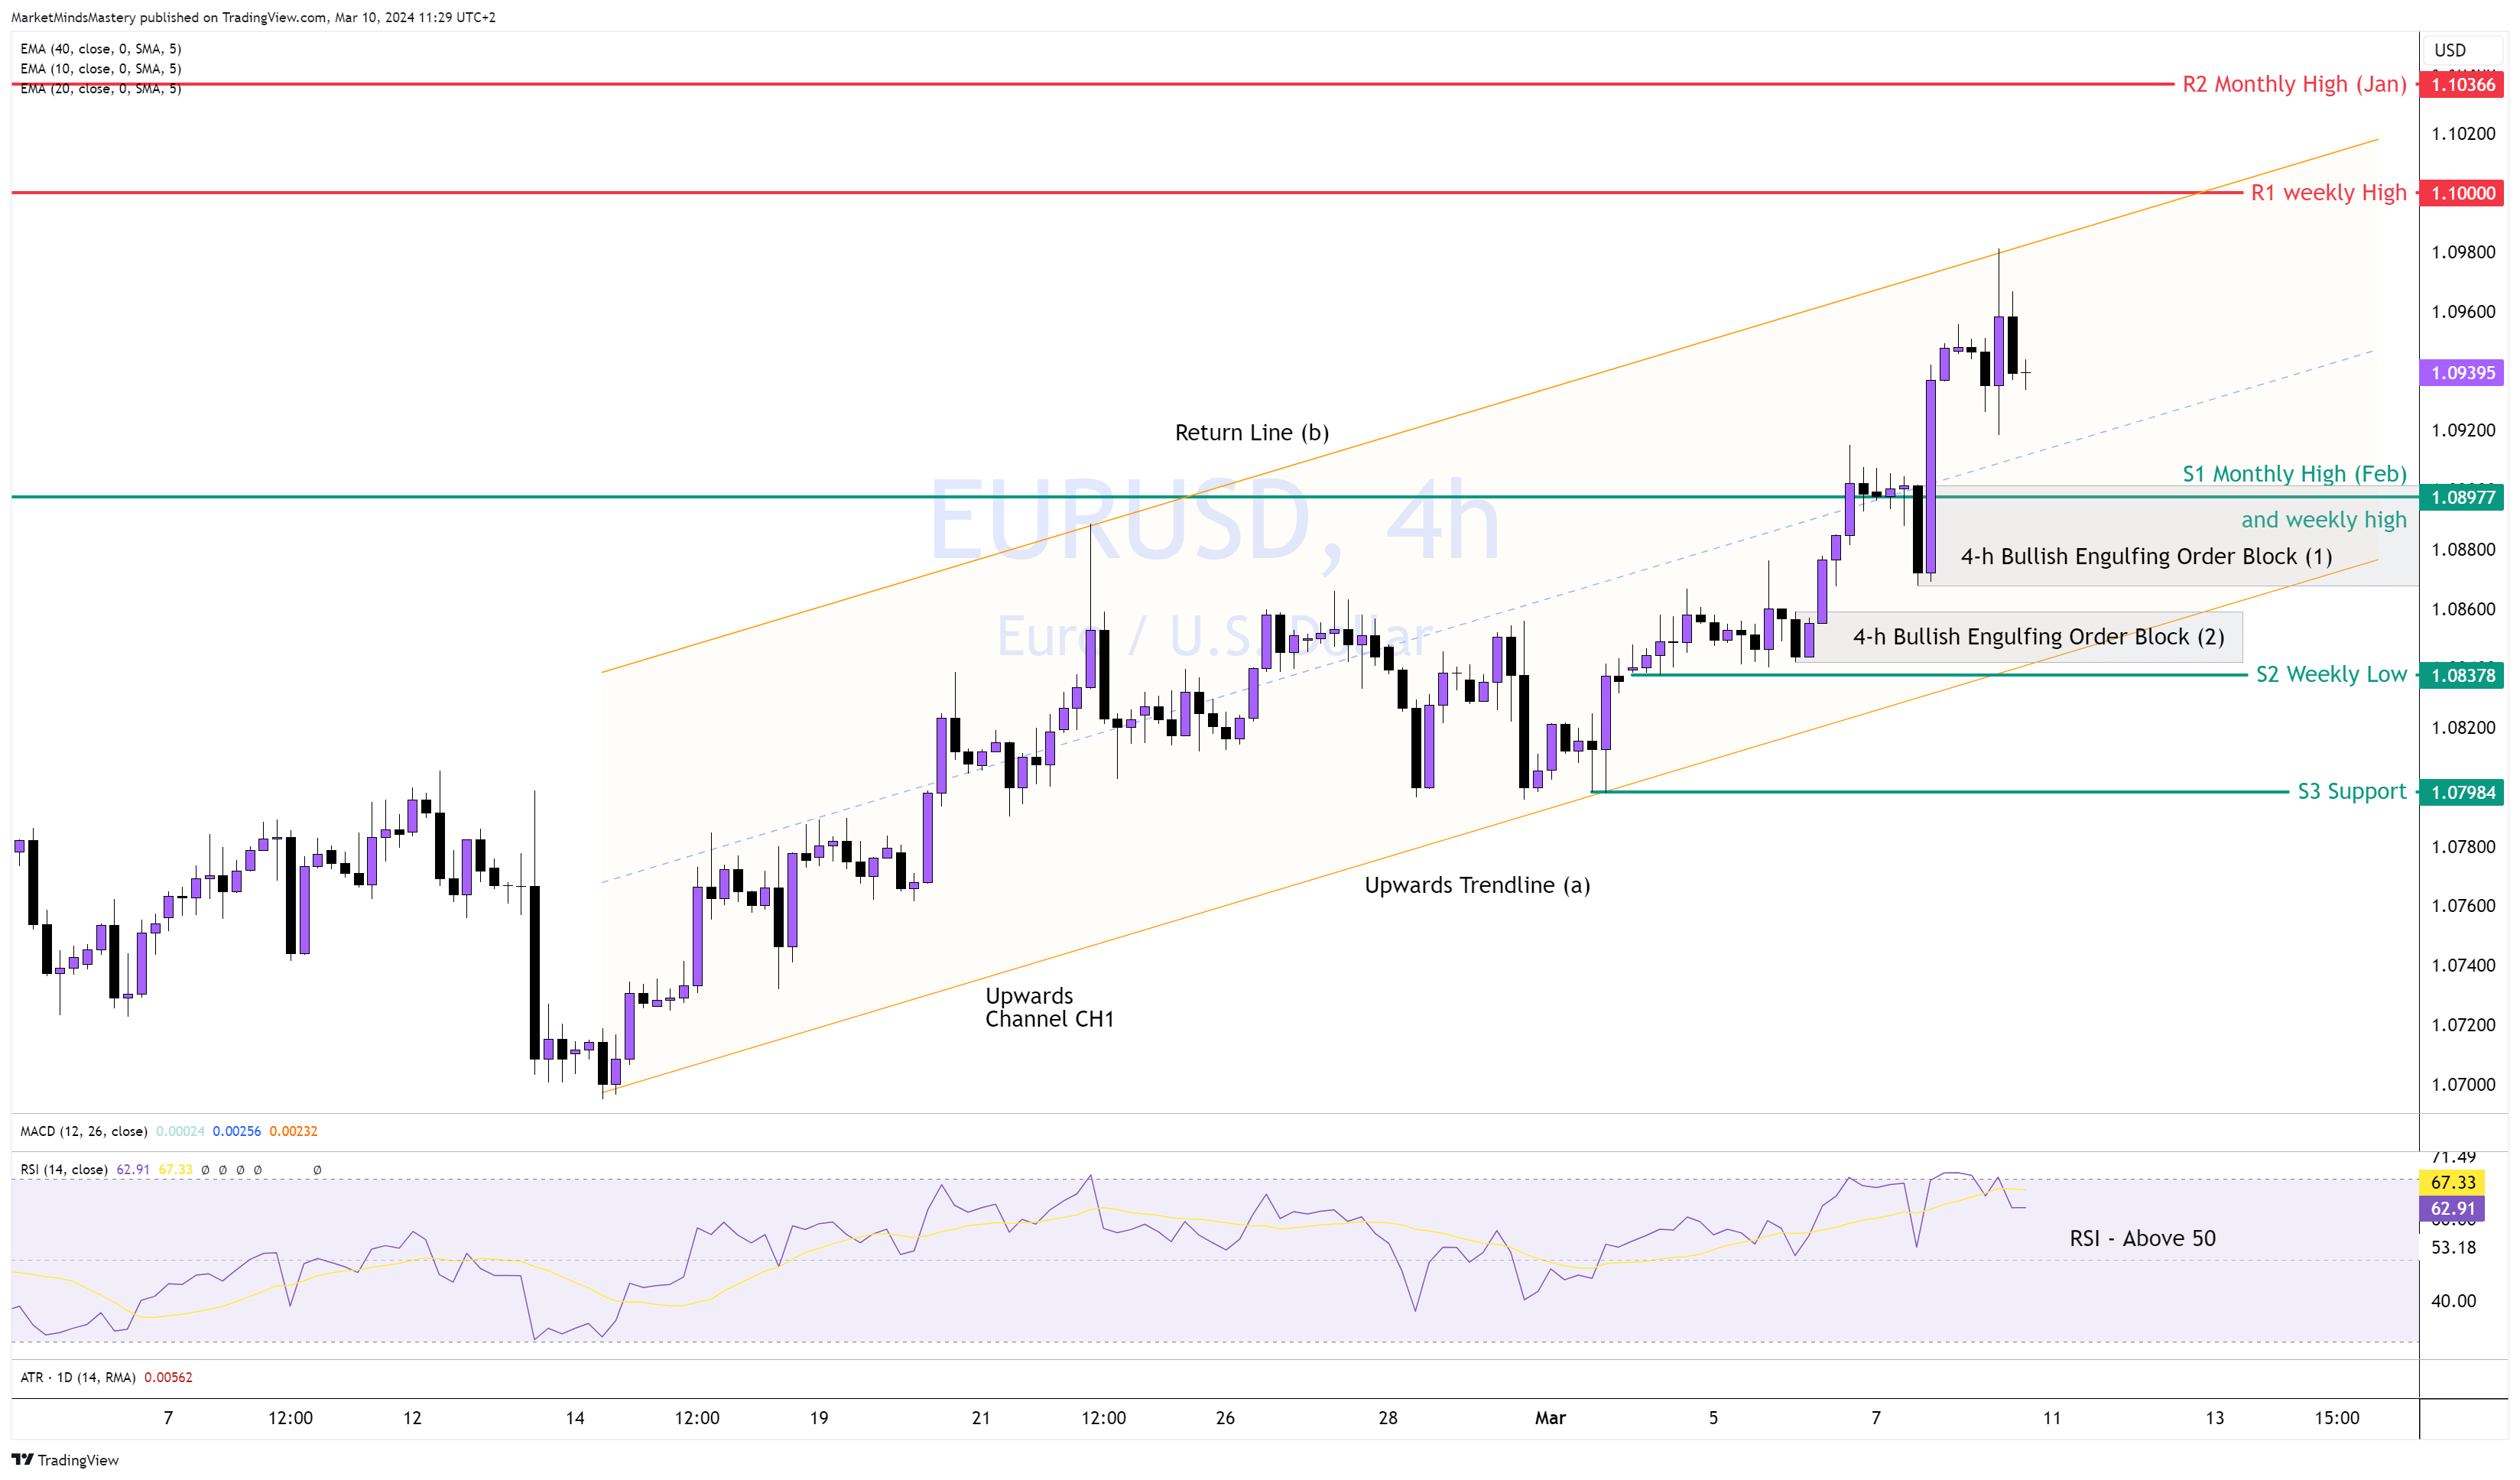
Following last week’s daily chart analysis, the price created a new high after the non-failure swing pattern we explained. Looking down to the 4-h time frame, an upwards channel CH1 is established with the upwards trendline (a) and the parallel return line (b). The price created a higher high and a higher low, indicating a bullish market.
Additionally, the RSI is above 50, suggesting a bullish market—the price left behind two well-established Bullish Engulfing Order Blocks. If the price continues upward, the 1.1000 area is the first resistance, R1. It is considered a round number and a psychological number for traders. Therefore, an intense trading activity is expected to occur. If the price penetrates the R1, closes above it and keeps moving upwards, the next resistance, R2, is approximately 1.10366, which is January’s high price.
Conversely, if the price declines and moves lower, the first support S1 is February’s high, broken recently. The breakout occurred under a solid Bullish Engulfing Order Block (1).
If the price declines further, another 4-h Bullish Engulfing Order Block will be at point (2).
This last Order Block was created above the S2 weekly low, approximately at 1.08378.
GBPUSD, 4H
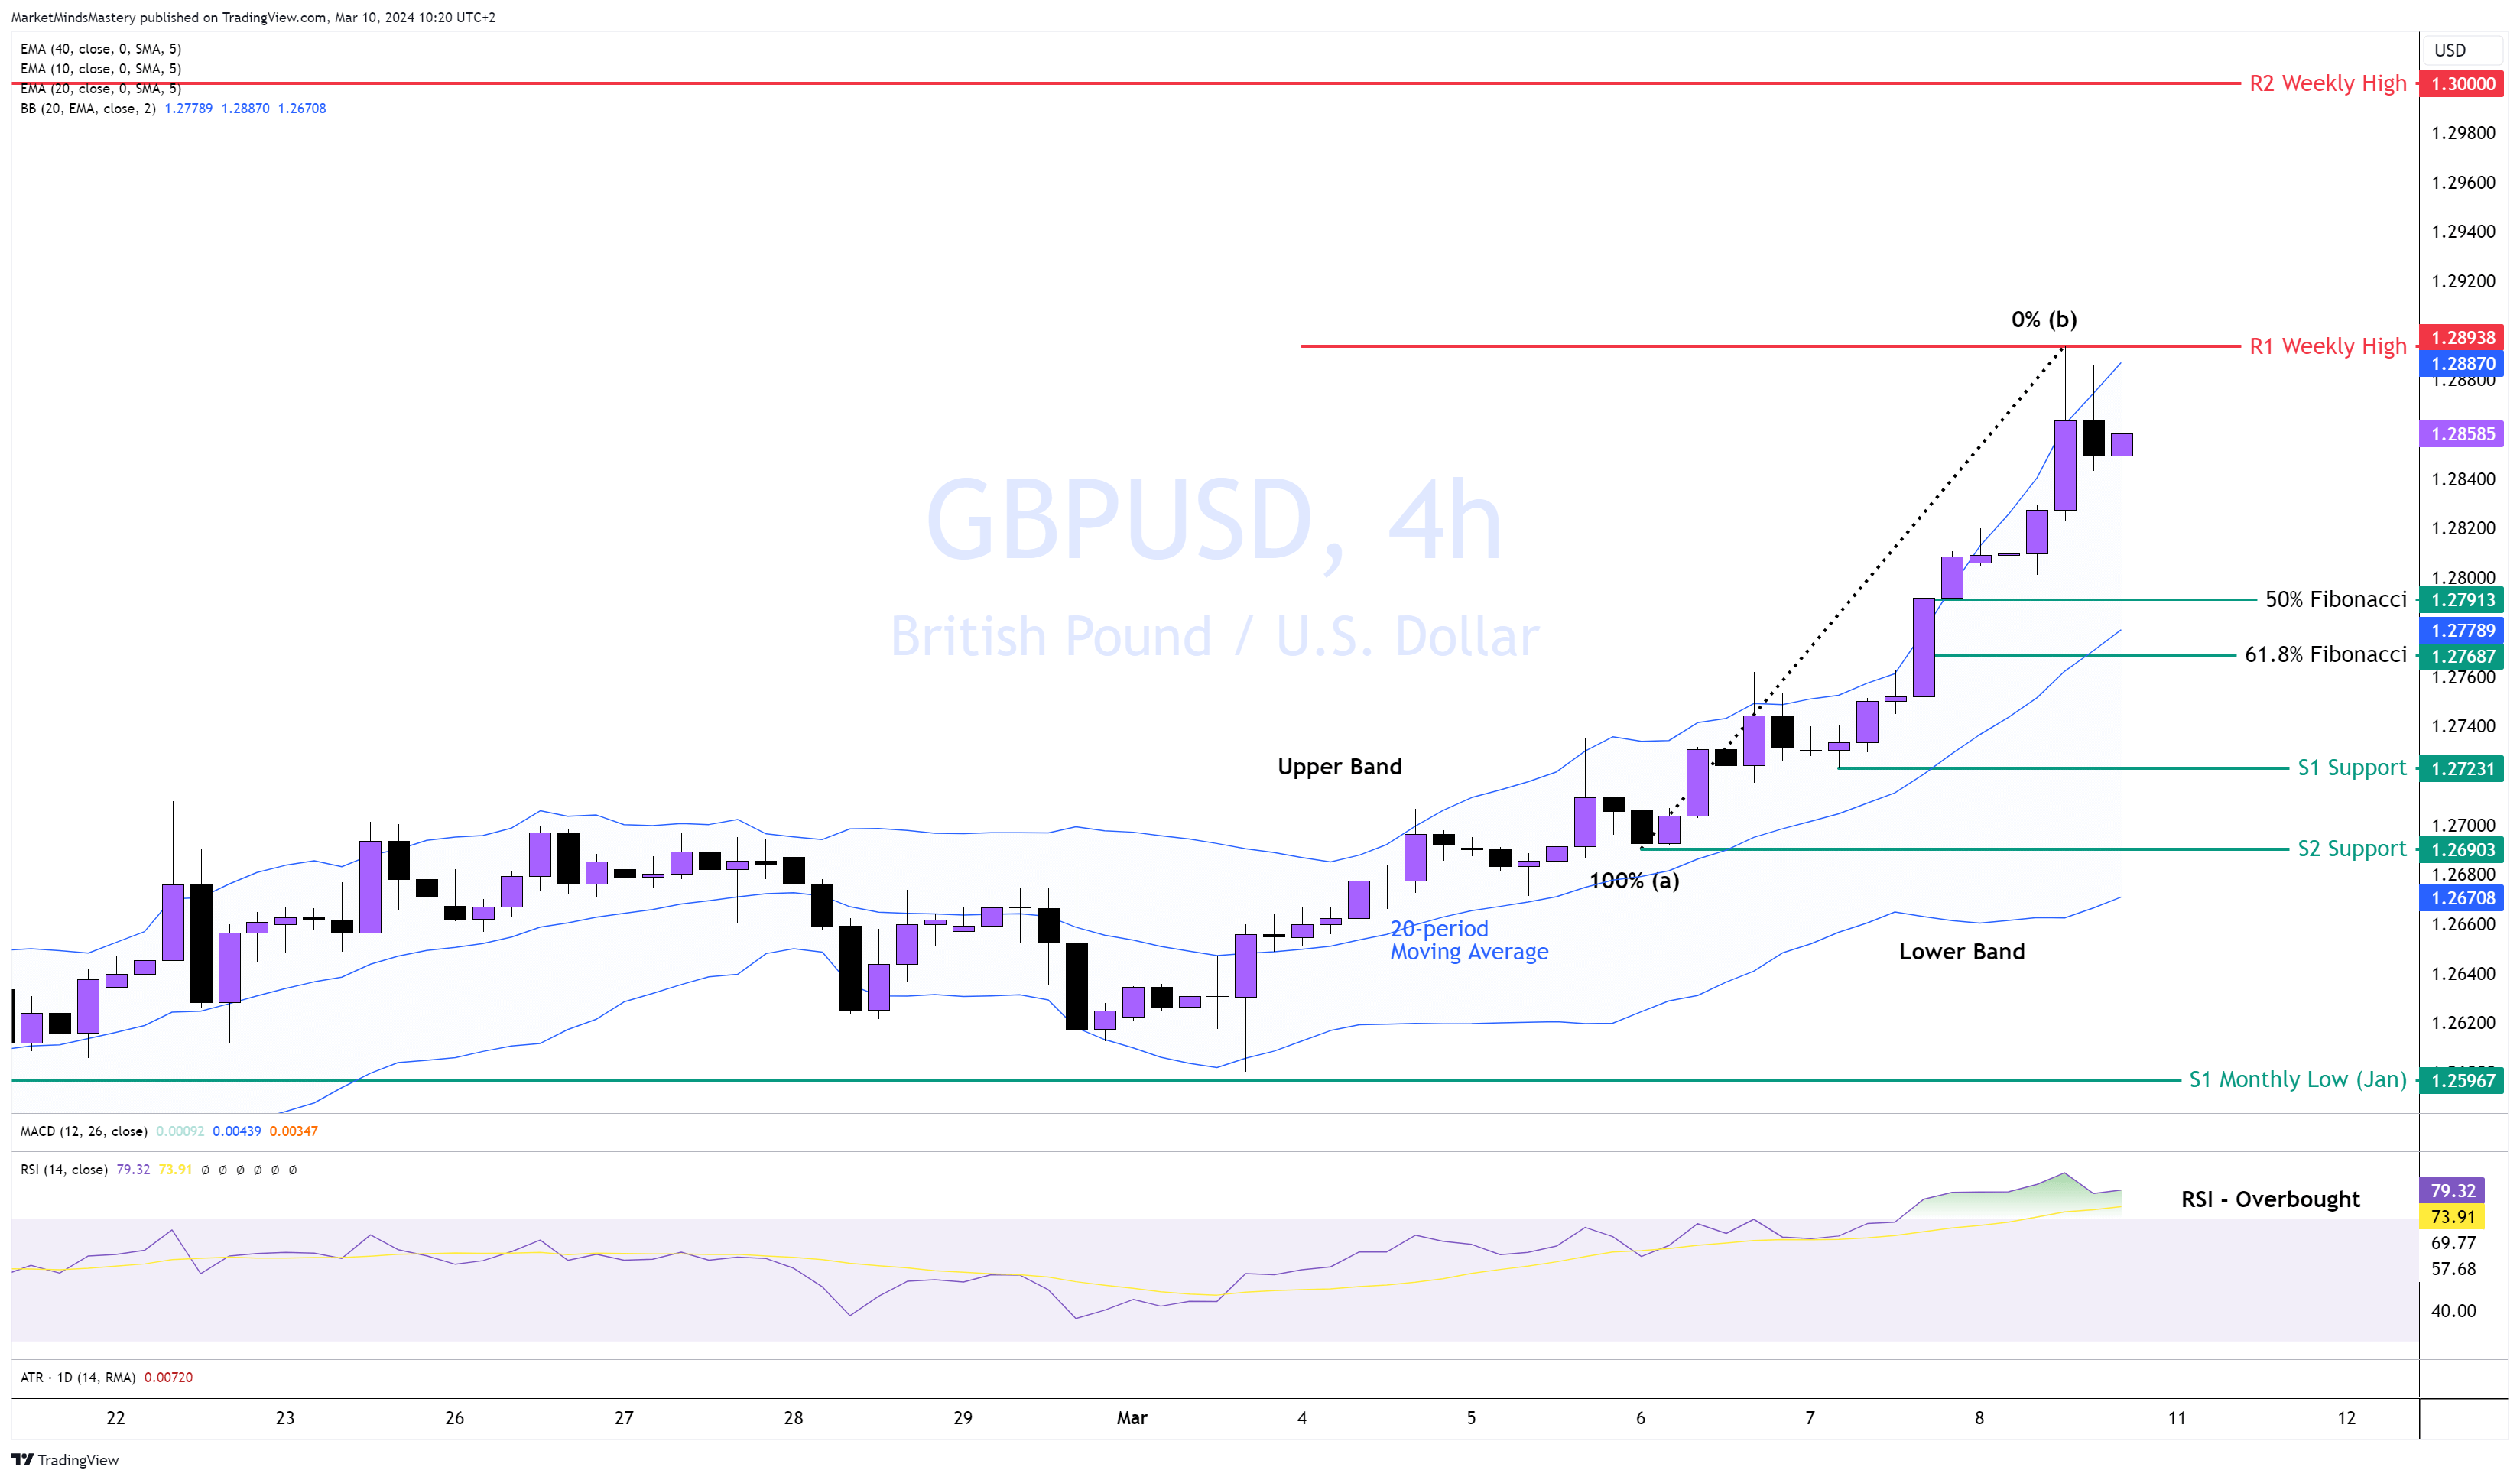
Following the bullish break out on the daily chart last week, the price sustained a bullish momentum, forming higher highs and higher lows, defining a solid uptrend. Analysing the 4-h time frame, the price remained above the middle of the Bollinger band, the 20-period moving average, which is a bullish indication—the price trades alongside the upper band, indicating a bullish move with shallow retracements.
Additionally, the RSI is in an overbought condition, confirming the strength of the buyers. Therefore, if the price continues moving upwards, there is the last week’s high as the R1 resistance, around 1.28938. If the price surpasses and moves higher, the next resistance, R2, is approximately 100 pips away at around 1.3000.
On the other hand, if the price declines and moves downwards, the 50% and 61.8% Fibonacci retracements from the low point at (a) to the high point at (b) are in the region of 1.27500-1.28000. If the price doesn't find support to bounce off and keeps declining, the S1 horizontal support is around 1.27231, and the next S2 support is around 1.26900.
USDJPY 4H
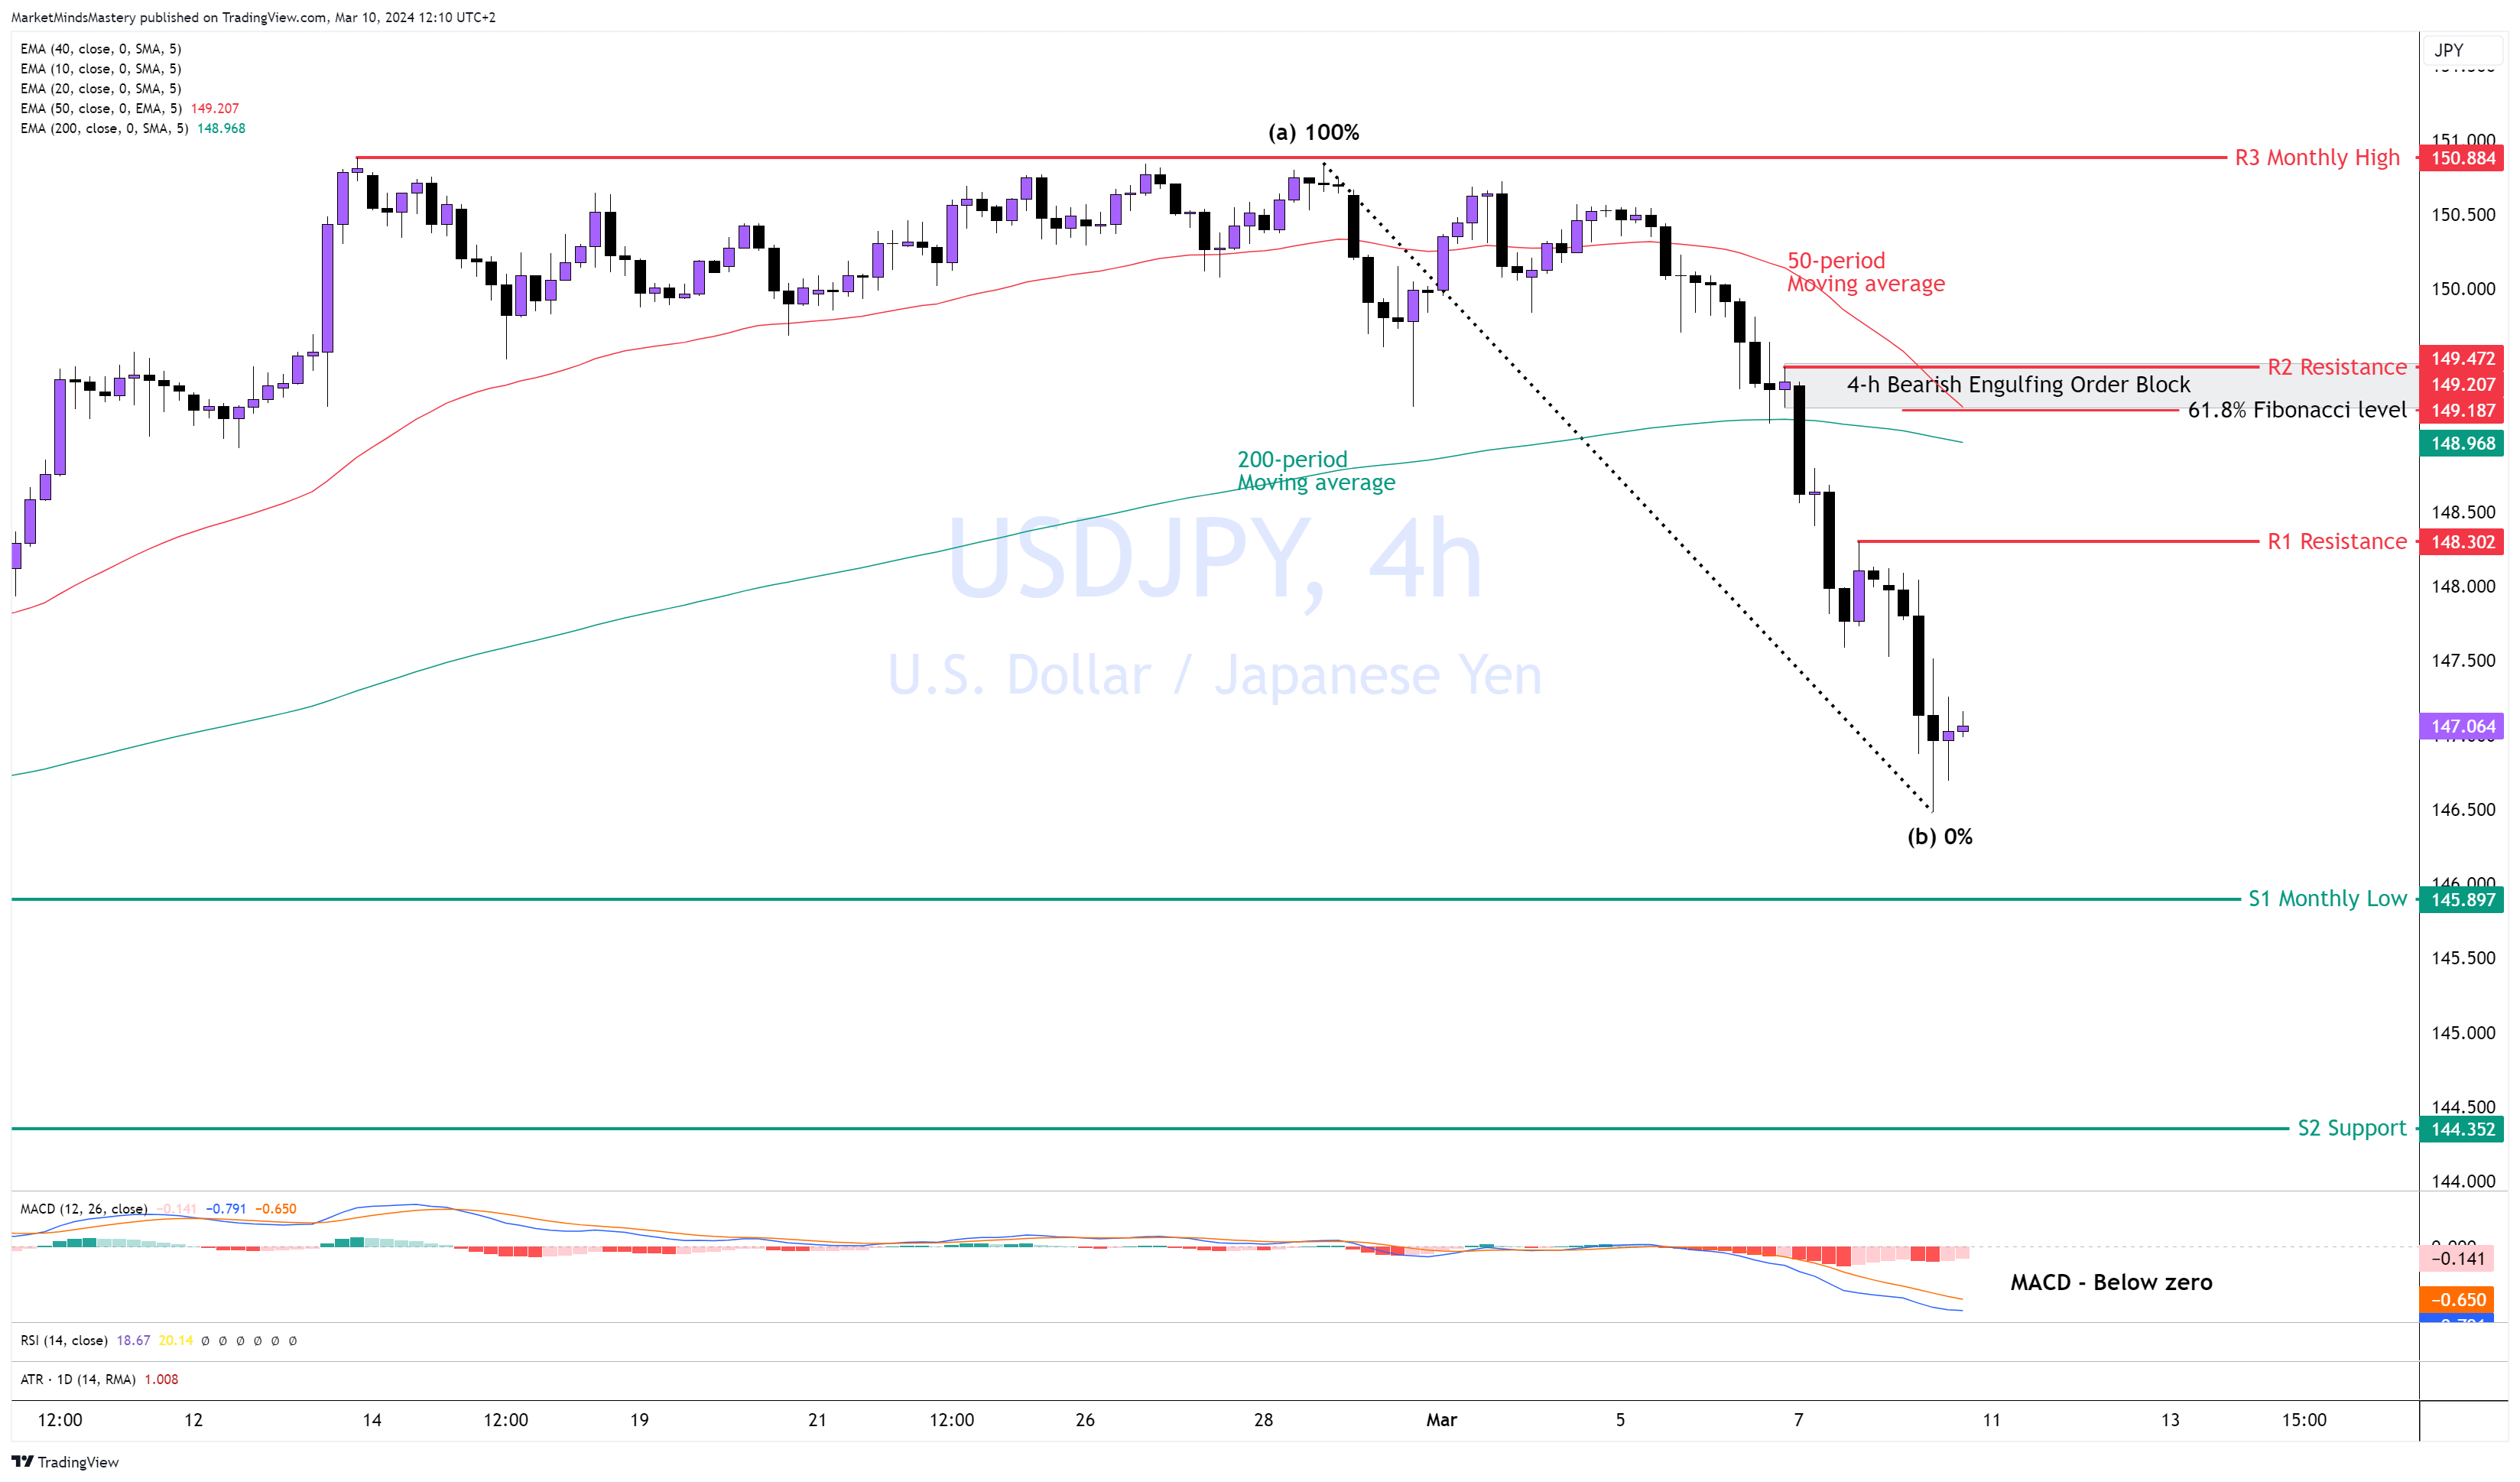
The market declined aggressively last week, as expected, due to the Bearish Engulfing weekly price action. On the 4-h chart, the price created a strong downtrend. We call this downtrend “strong” since the retracements on every minor correction were shallow, and the bearish candles were almost unnoticeable. The 50 is above the 200 period moving average, which is expected as there are lagging indicators. They follow the price—the fact that the price makes lower highs and lows indicates a bearish market. The MACD is well below its zero line, which is also a bearish indication. If the price continues to decrease, the first area of support, S1, is the previous month's low, approximately 145.879. A move below it finds the next area of support, S2, around 144.352.
On the other hand, if the price bounces off and moves upwards, the first resistance R1 is at a level of around 148.302. If the price surpasses it and moves even higher, there is an R2 resistance of around 149.20. This area is significant because a Bearish Engulfing Order Block was never tested. There is also the 61.8% Fibonacci retracement level from the high at point (a) to the low at point (b) taken from the Daily chart,
AUDUSD 4H
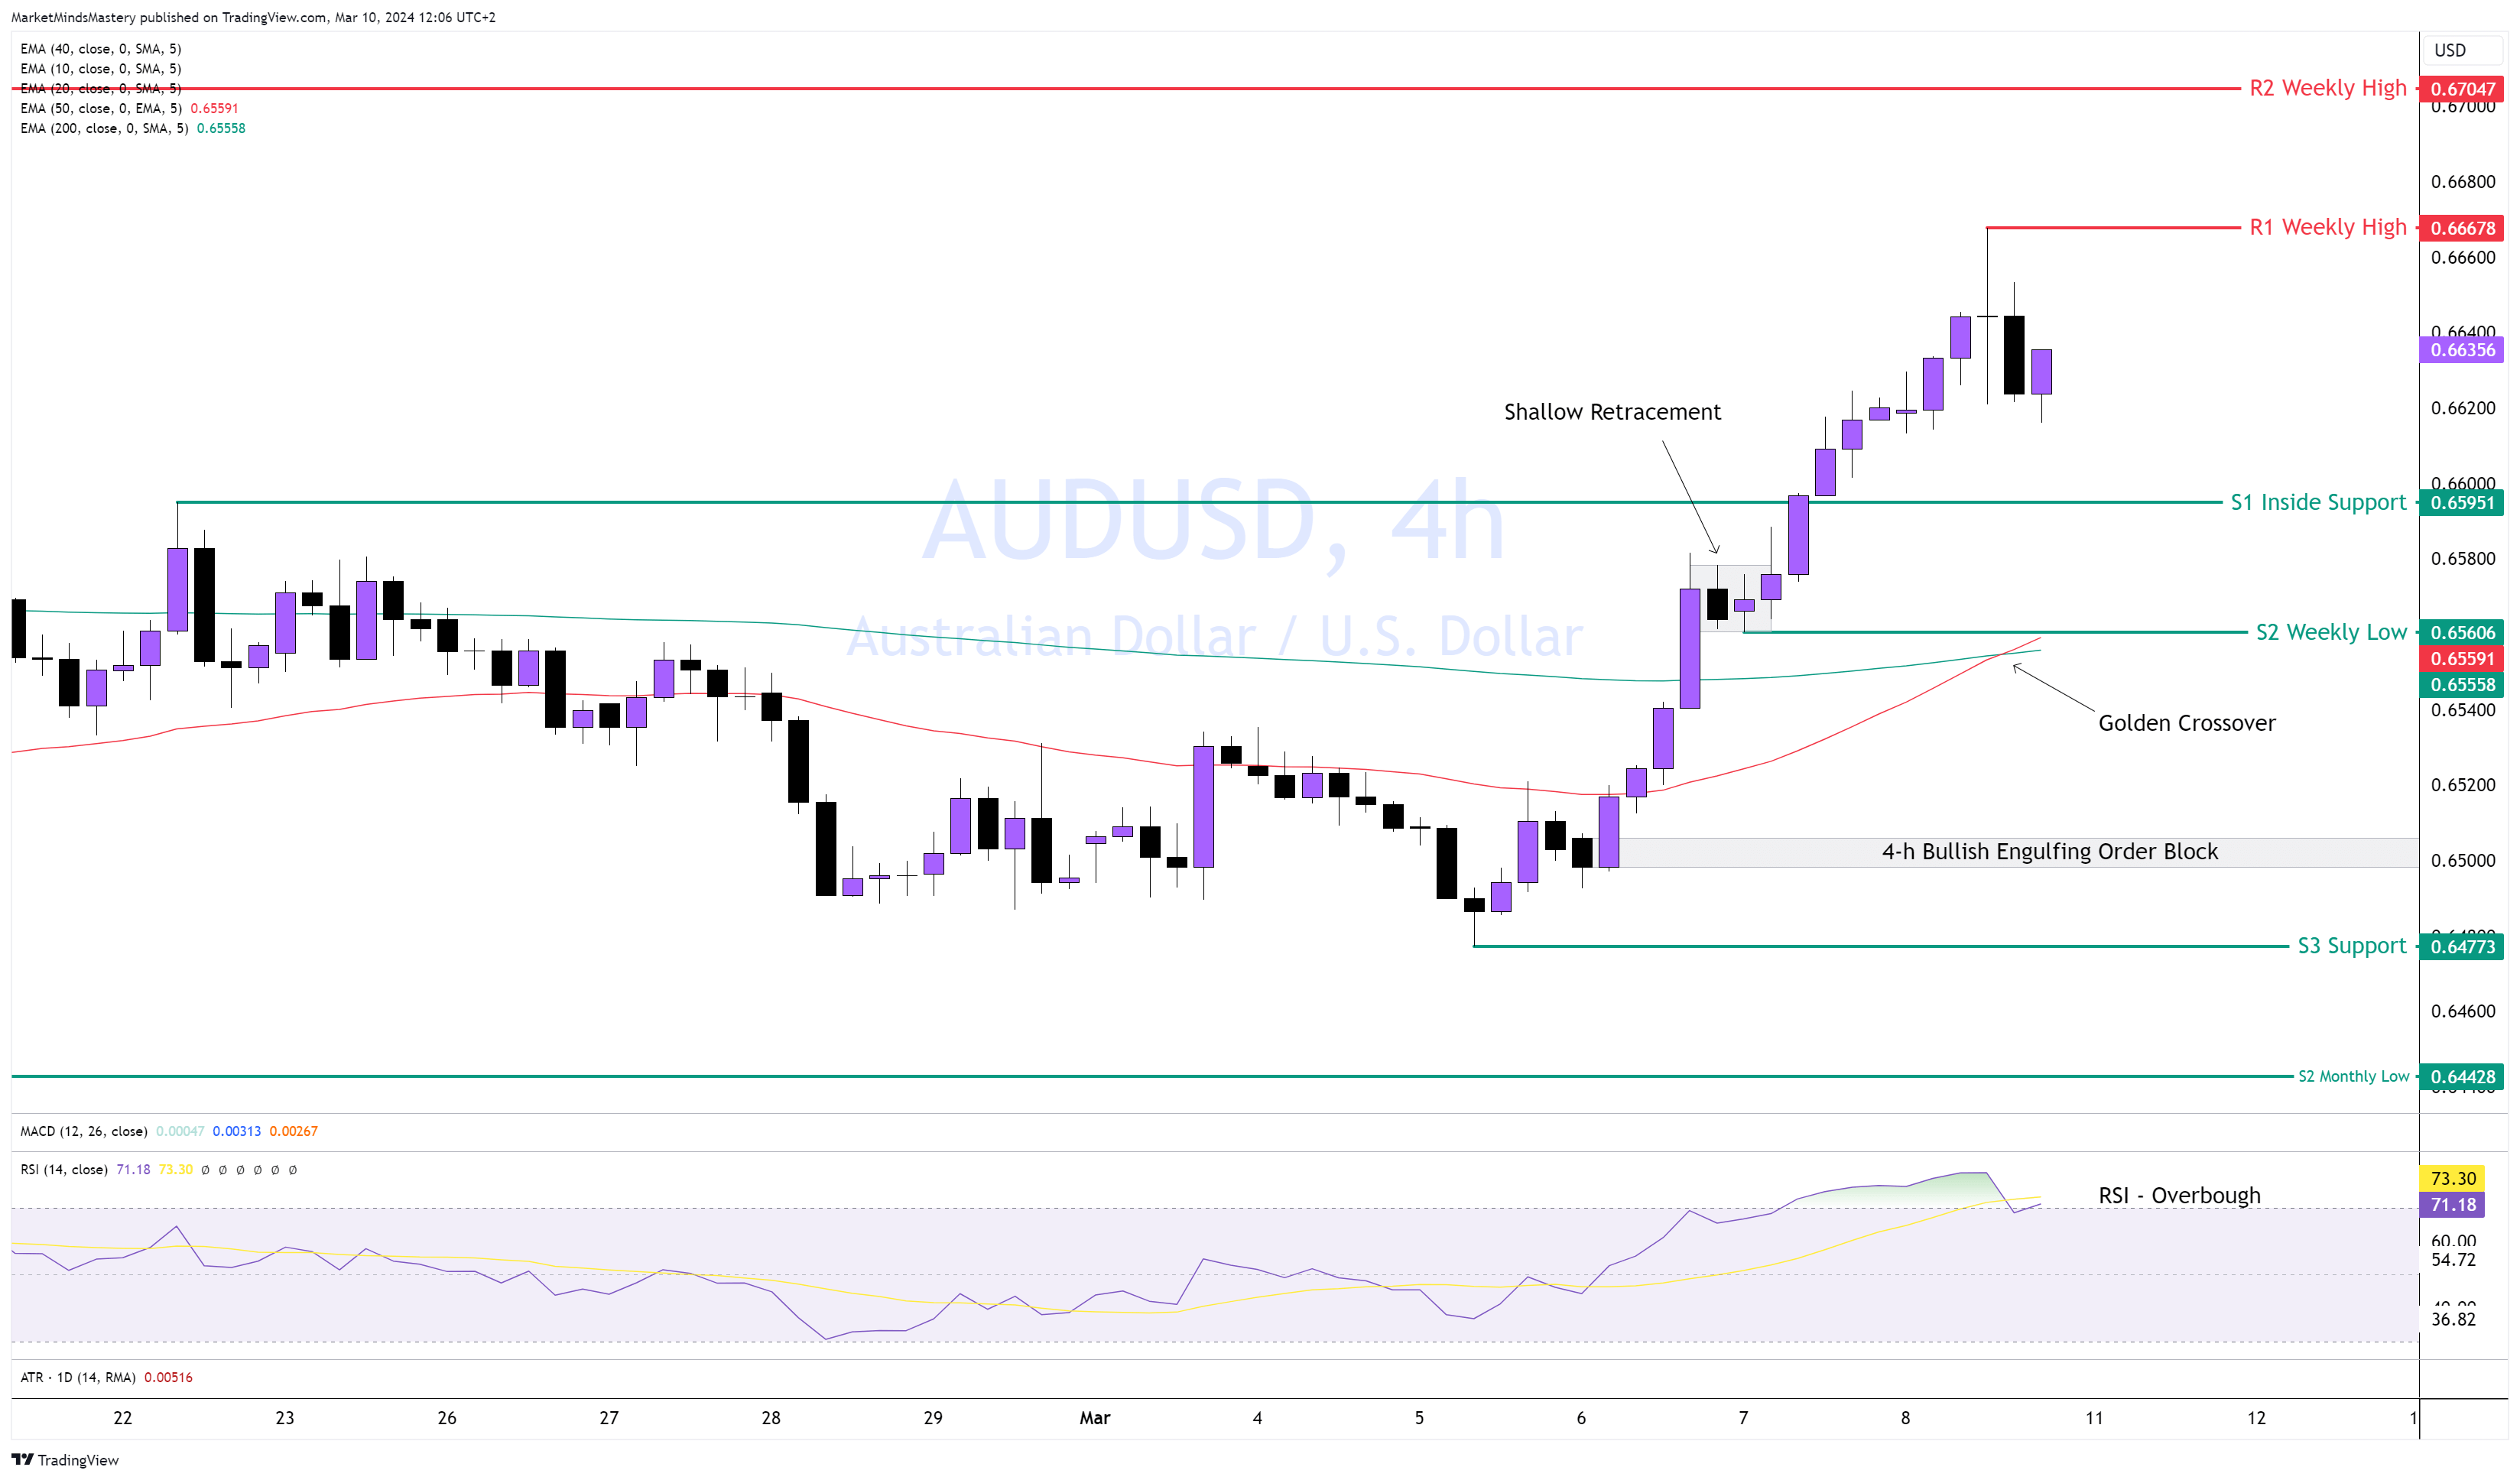
Following last week's bullish move on the AUDUSD, the price broke above 0.6600, creating a higher high and a confirmed higher low. In the 4-h time frame, the price is in an uptrend. Also, the 4-h RSI is overbought, which has bullish implications. The 50-period moving average crossed above the 200-period moving average, known as a Golden Cross-over, which indicated a bullish market. Therefore, if the price maintains upward momentum by moving higher, the first resistance R1 is the previous week’s high, around 0.66678. If the price closes above the R1 and keeps increasing, the next resistance, R2, is a weekly high, approximately around 0.67047.
On the contrary, if the price declines and moves downwards, the first support level is inside support, S1, around 0.6600. If the price closes below it and moves downwards, the next support area, S2, is around 0.65606. This price level hosts a shallow retracement in the market, indicating a strong buying interest at this level.
A 4-h Bullish Engulfing Order Block is shown below for further decline.
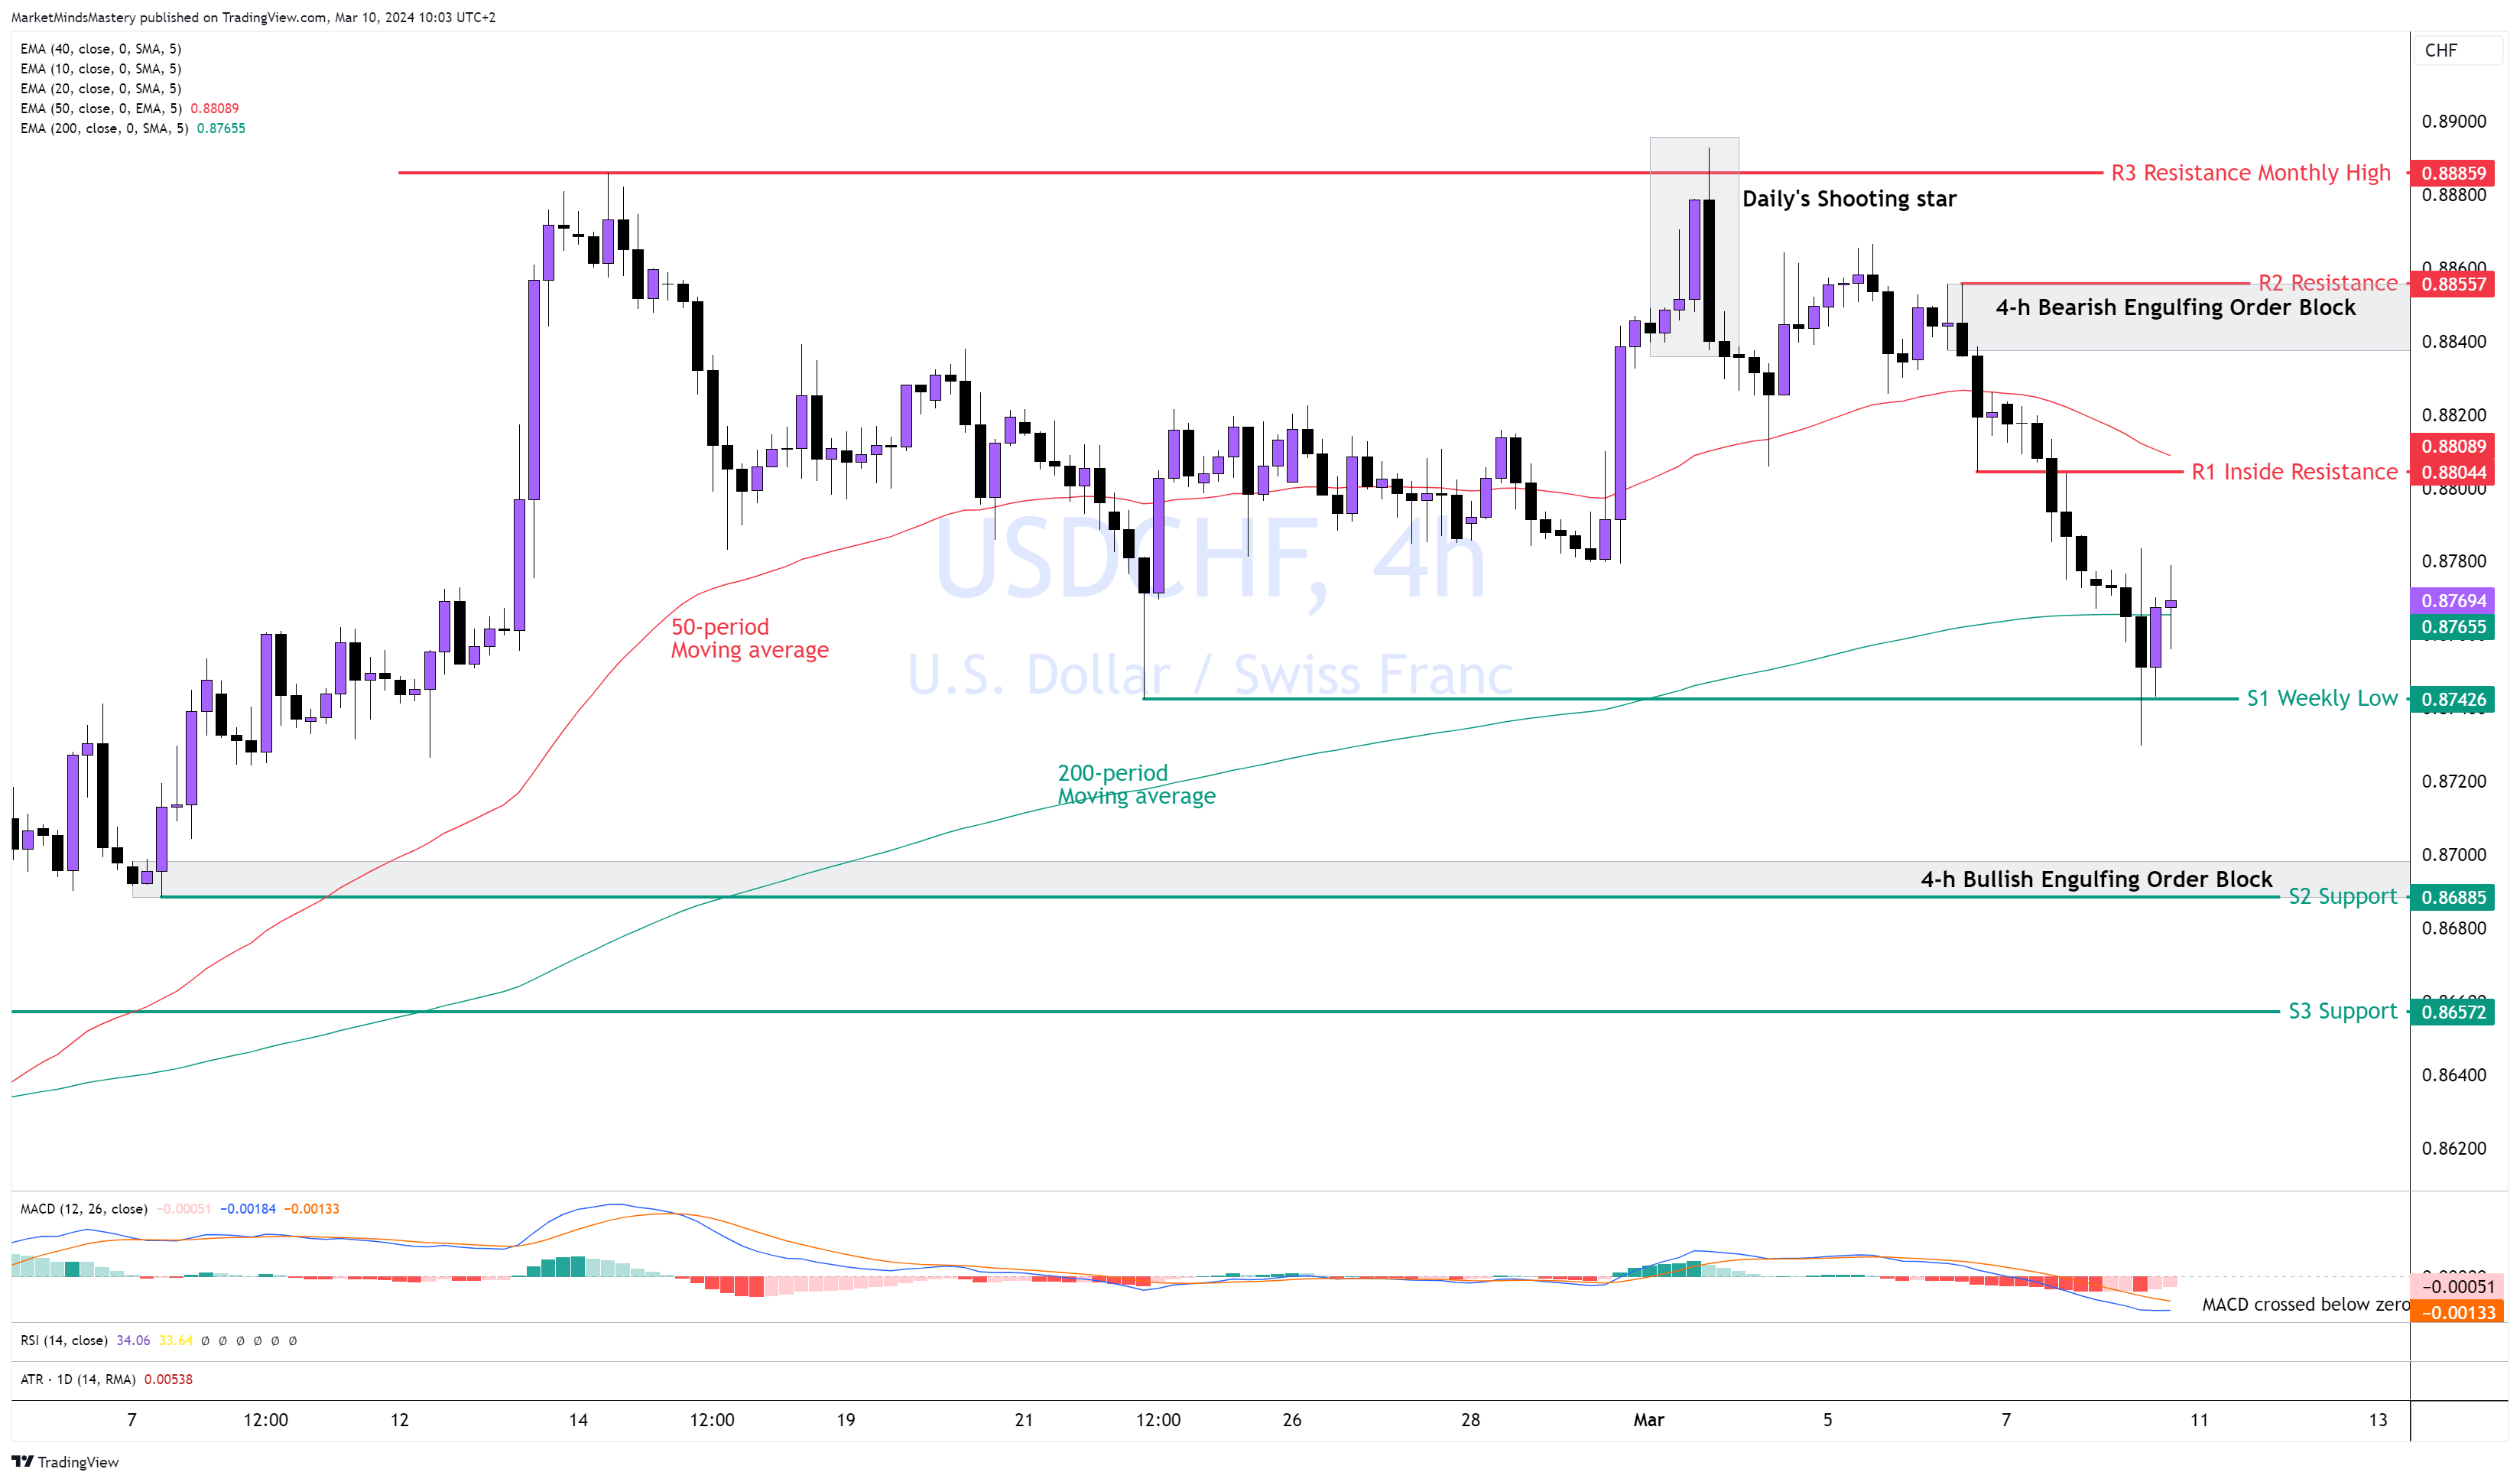
USDCHF 4H
Following the Daily’s Shooting Star reversal, which appeared at a monthly high, the price on the 4-h left behind a Bearish Engulfing Order Block that successfully, after resting, forced the price to decline and move downwards. Last week, the price created the first low. Confirmation of a lower high is needed before an established downtrend. Currently, the price is around the 200-period moving average. The MACD crossed below the zero line, which indicates bearishness in the 4-hour time frame.
Starting Monday, if the price continuously moves lower, the first support is the S1, around 0.87426. If the price penetrates the S1 and closes below it, the next support, S2, is found to be around 0.86885. Right in this area, a 4-h Bullish Order Block has been founded.
On the other hand, if the price bounced off and moved upwards the first resistance, R1, is an inside resistance, around 0.88044, close to the dynamic 50-period moving average, which can also act as a resistance. If the price penetrates the R1 and moves upwards, it will find the next resistance, R2, around 0.88557, with a 4-h Bearish Order Block that initially caused the downward move.
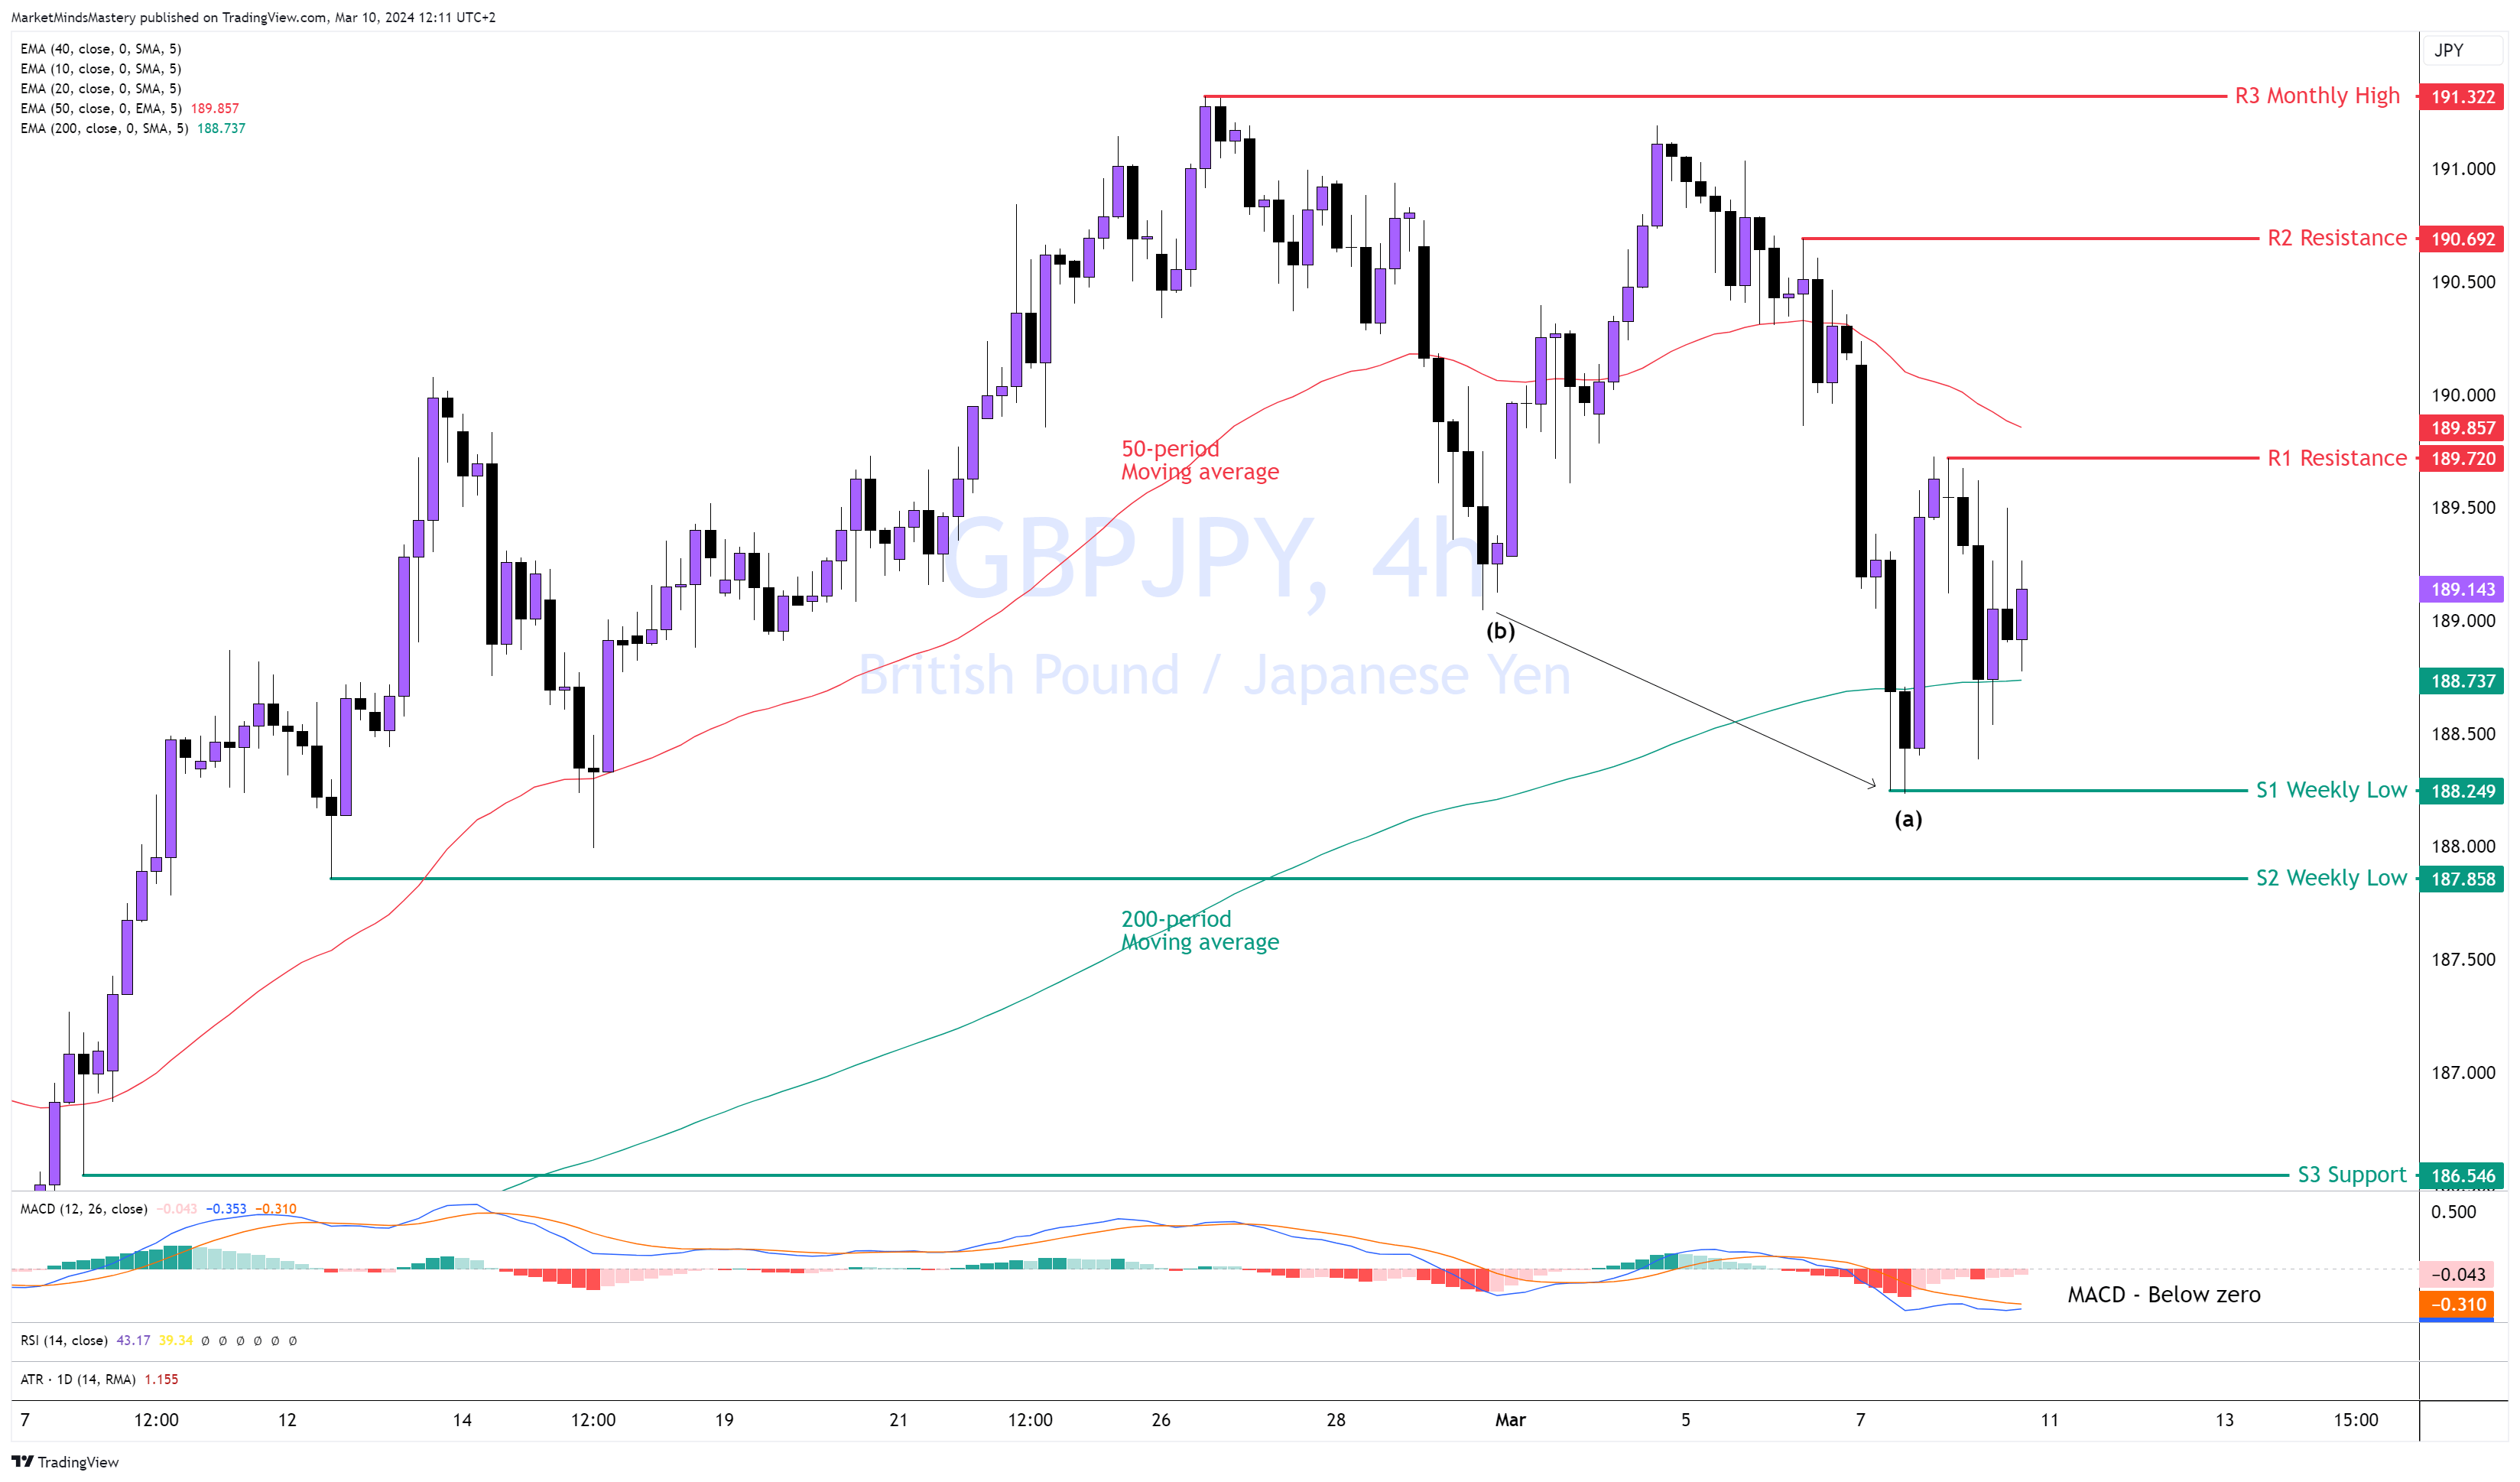
GBPJPY 4H
Following last week’s bearish reversal price action, the price declined and found support at the 200-period moving average. The price created a new low at point (a). Since then, the price bounced off and pushed upwards, remaining below the 50-period moving average. It is a bearish indication. The MACD is below its zero line, with the MACD line (blue) below the Signal line (orange), which is also a bearish indication.
Therefore, if the price continues to move downwards and surpasses the 200-period moving average, the first support will become the recent swing low at point (a). We call this S1 support; it was the previous week’s low at around 188.249. If the price closes under it afterwards and moves lower, it will find the following support, S2, around 187.858. This price level is also a weekly low price.
If the price moves upwards, the first resistance, R1, is around 189.720. It is just below the 50-period MA. A further upward move will find the next resistance, R2, approximately 100 pips above the R1, around 190.692.
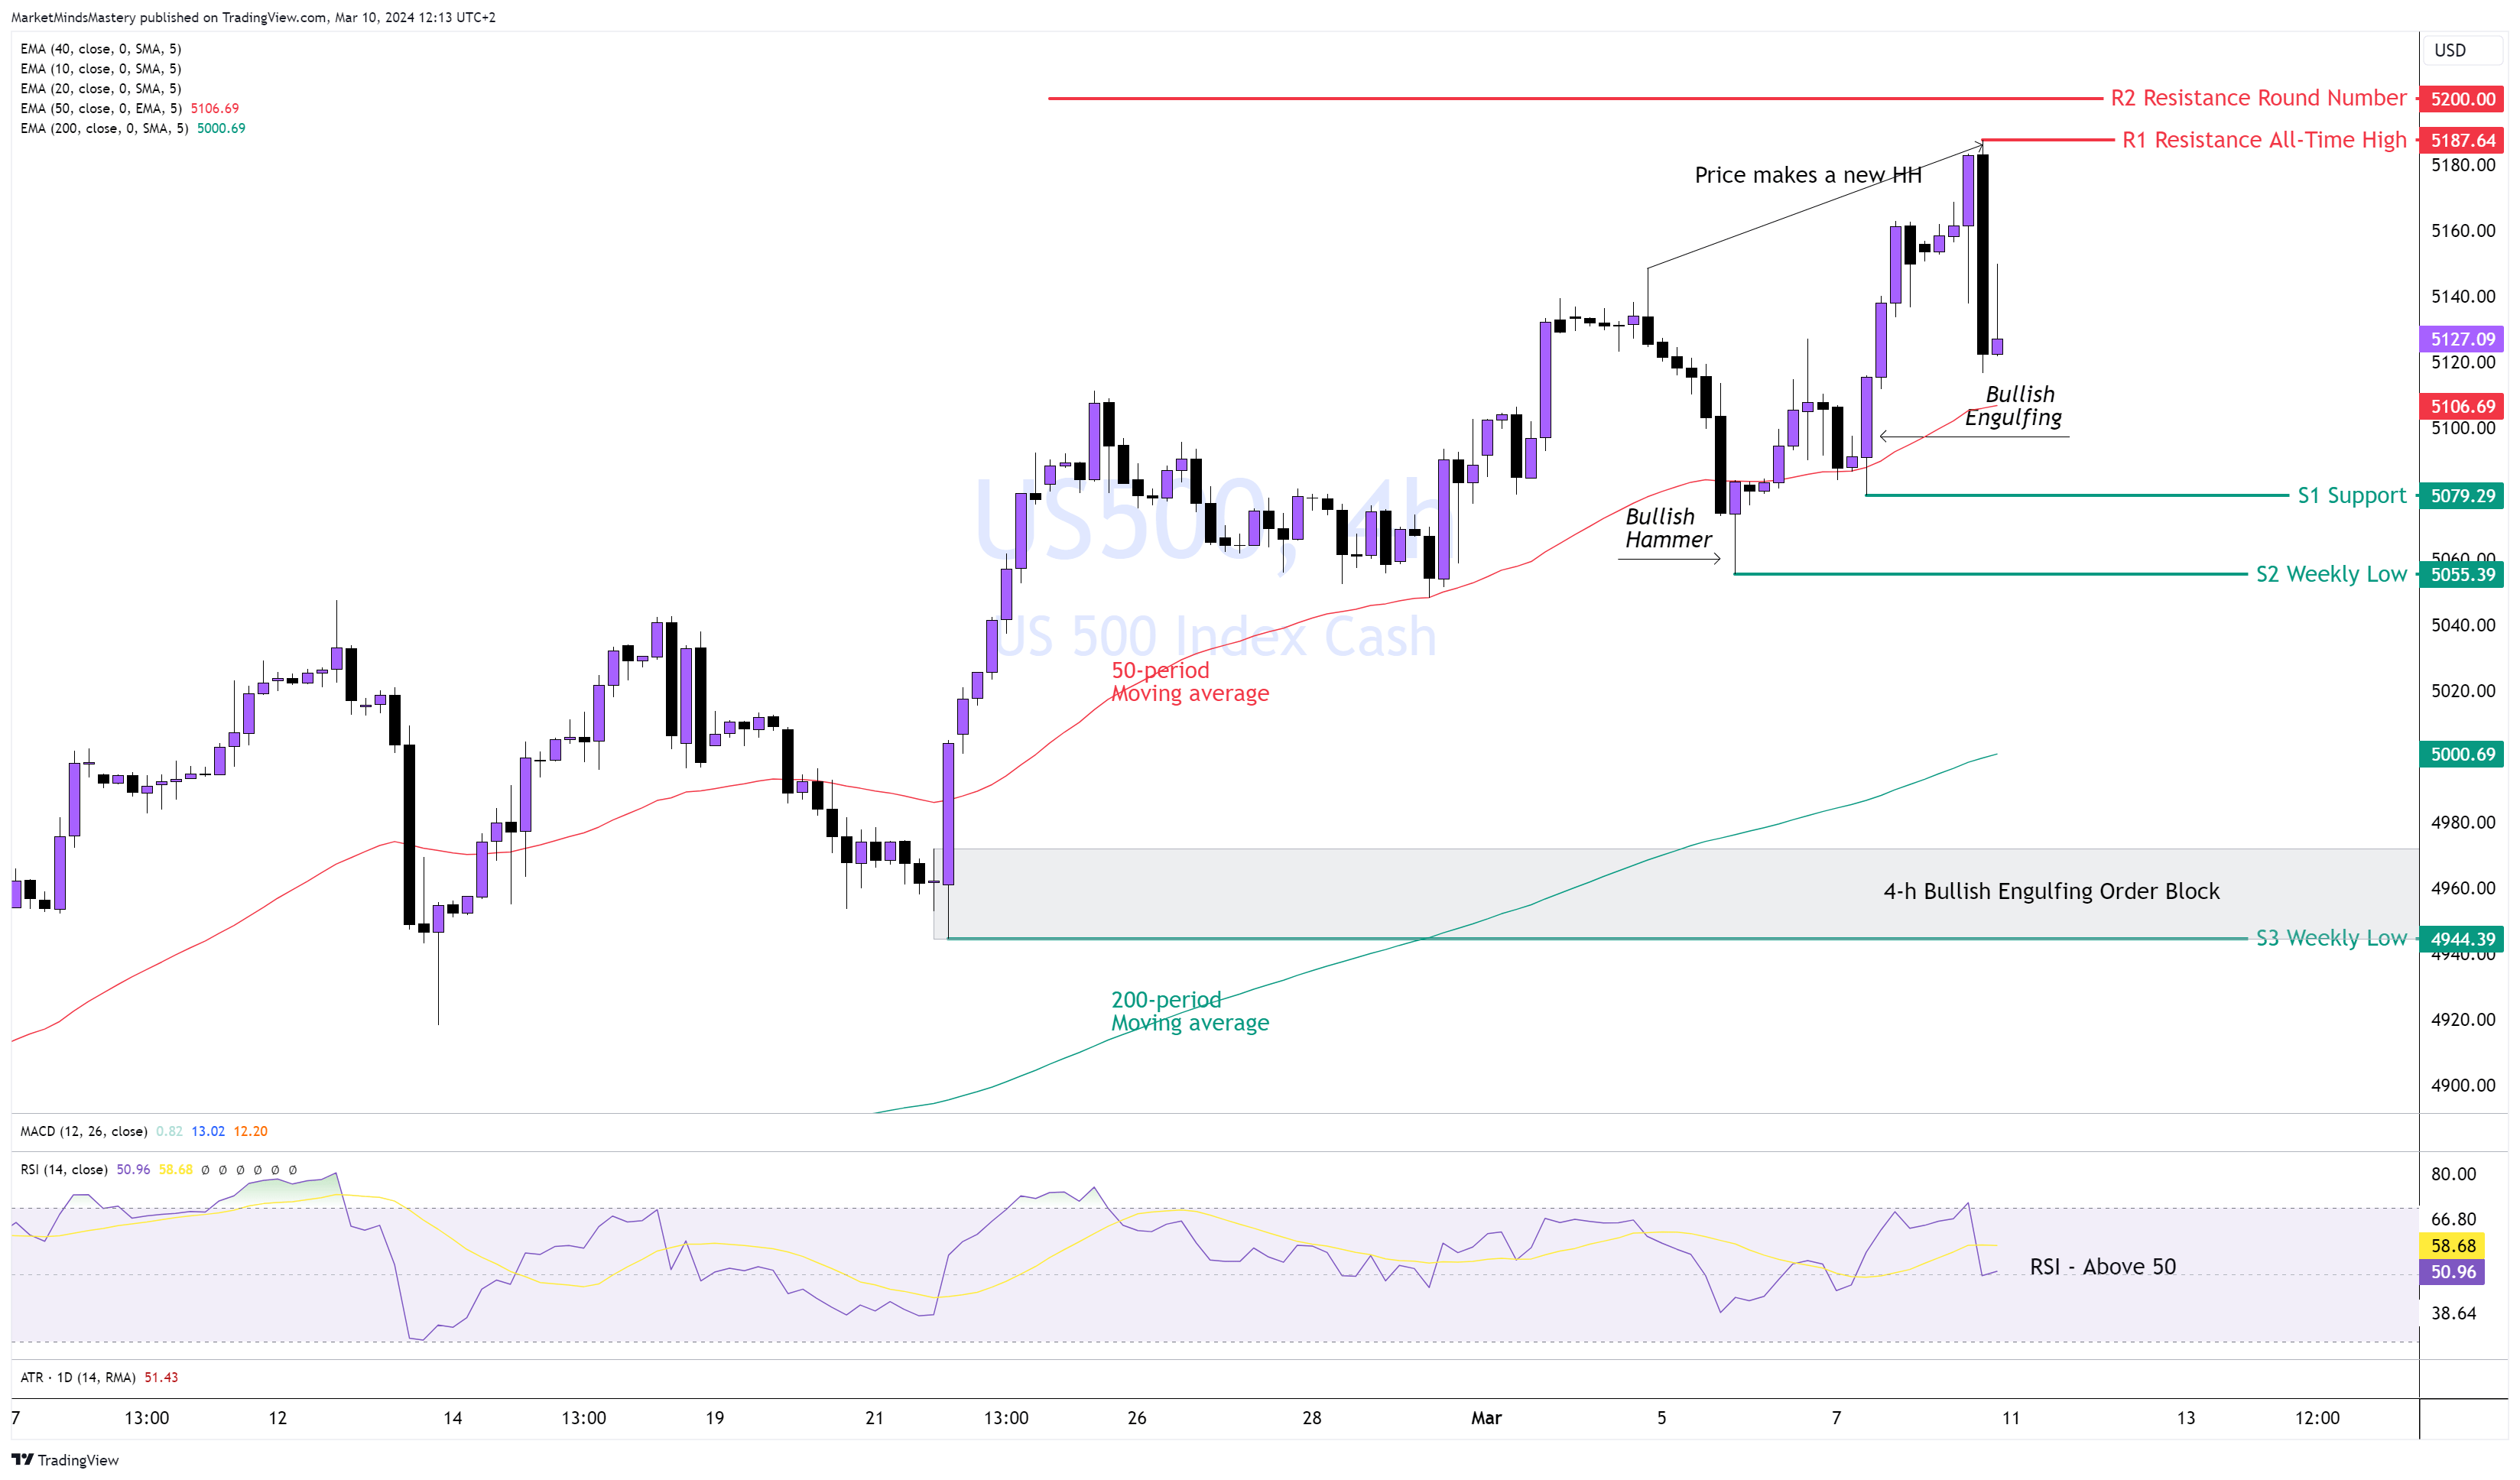
SP500, 4H
Following last week’s move, last Wednesday's price entered into the Bullish Engulfing Order Block area we marked on our analysis last week and bounced off, moving upwards, creating a new All-Time high, around 5187. This happened during the New York trading session after the NFP was announced last Friday.
The weekly price action is a Doji candle. If this week the price declines and moves downwards, the first area of support, S1, founded around 5079, An area which created a Bullish Engulfing candle. If the price keeps lowering, the next support, S2, is the area around 5055, which is the low of the bullish hammer shown on the chart.
A move lower can find the 200-period moving average among the Bullish Engulfing Order Block created at S3, in the area 4944. The RSI is above 50, which indicates bullishness, and the 50-period is above the 200-period moving average, which is also a bullish indication. If the price bounces off and moves upwards, the R1 resistance becomes an All-Time high, around 5187. A close above the R1 can lead to the price of testing the R2, round number 5200.
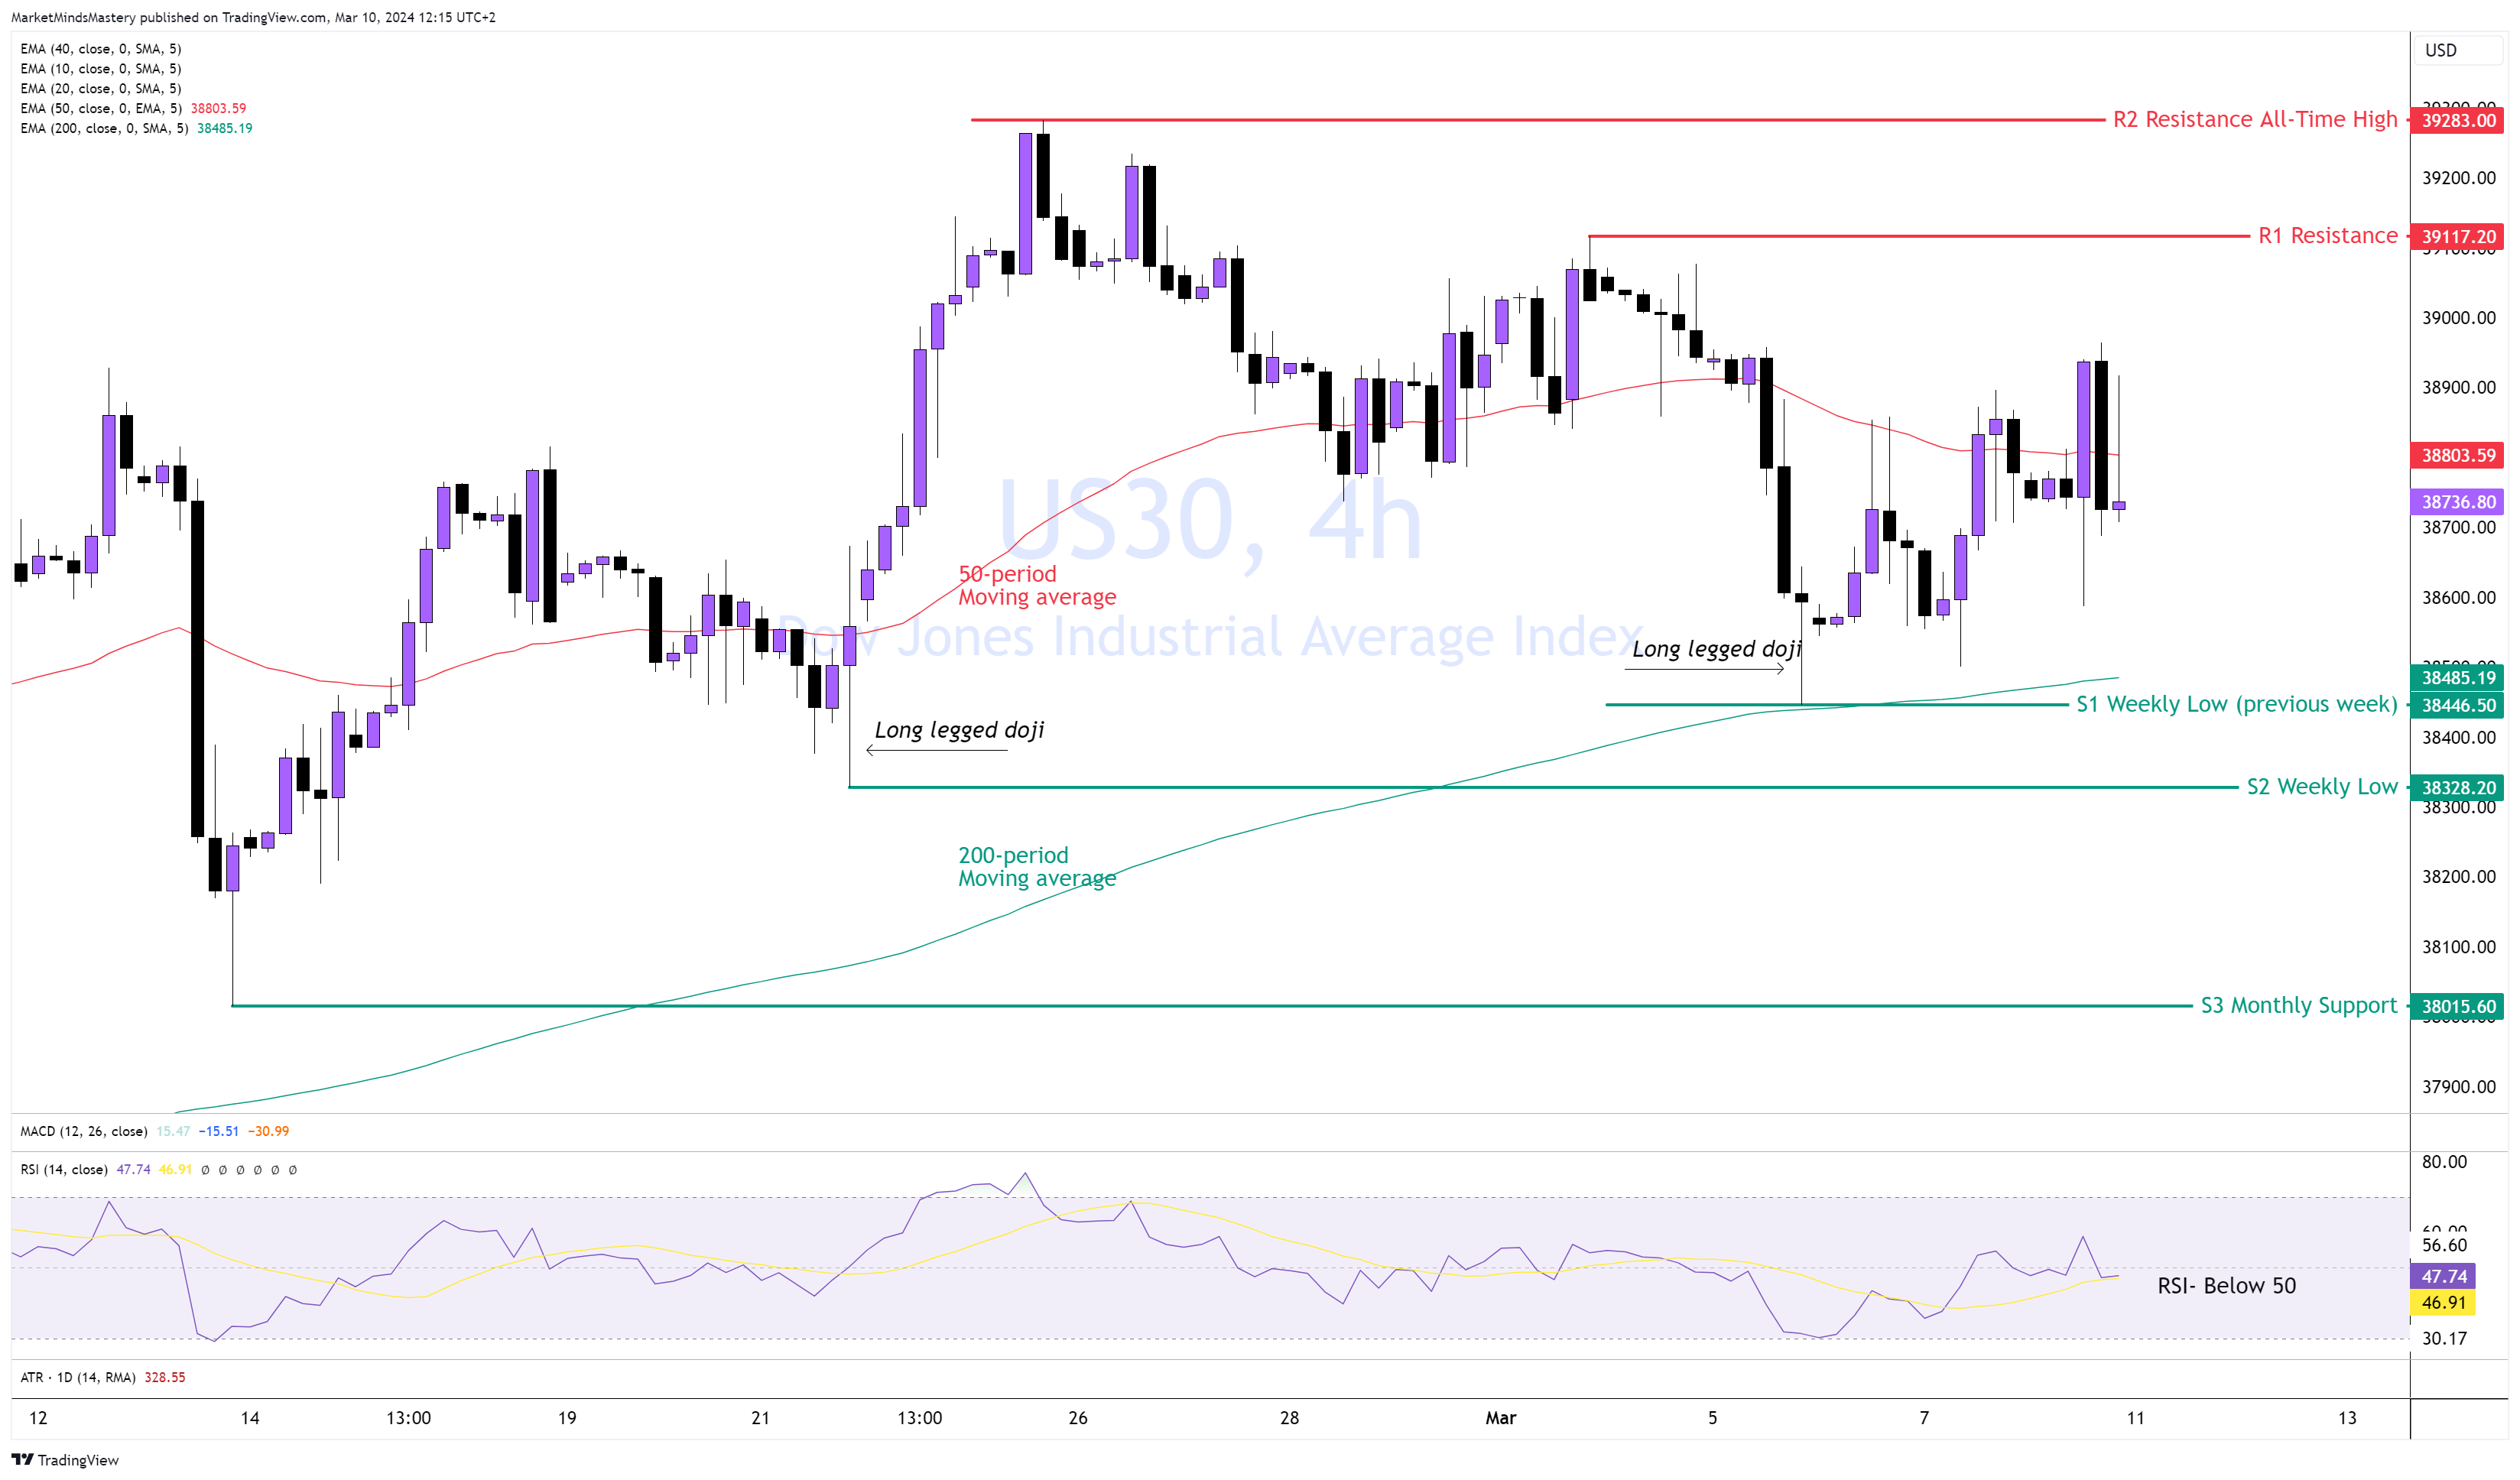
US30, 4H
Following the successful price decline from the 4-h Order Block of last week, the price moved downwards, bounced off the 200-period moving average and moved upwards. The week ended with a bearish candle, which had the most extended bearish body size since the last 19 weekly candles. This might be a clue to an upcoming price decline. The RSI on the 4-h is below 50, which is bearish, and the price is between the 50 and the 200 period moving average, showing a sideways move. Therefore, if the price moves lower, the first area of support S1 will be the lowest last week, approximately 38446. If the price penetrates the S1, it will find the S2 support to be at an old weekly low of around 38328. Long-legged doji candles create both supports.
On the other hand, if the price moves upwards, the first resistance, R1, is around 39117.
A further upward move will find this All-Time high at around 39283.
GER40 4H
Based on the weekly chart, the GER40 price created a new higher high and higher low for the 6th week. Last week’s price action was a doji candle, which shows indecision primarily from the buyers as they are the dominant force.
Consequently, a correction may be made this week. On the 4-h chart, MACD showed negative divergences while the price registered a higher high. This disagreement between price and MACD can add more confidence to a price correction. If the price moves downwards this week, the 50-period moving average can act as dynamic support, and it is sitting just above the S1 support, which is the previous week’s low of around 17636. If the price declines further, the next support, S2, is approximately 17379.
Conversely, if the price moves upwards, the first resistance, R1, is the All-Time high price of around 17925.
A further upward push can force the price to test the 200% Fibonacci extension from price (a) to (b), around 18014.
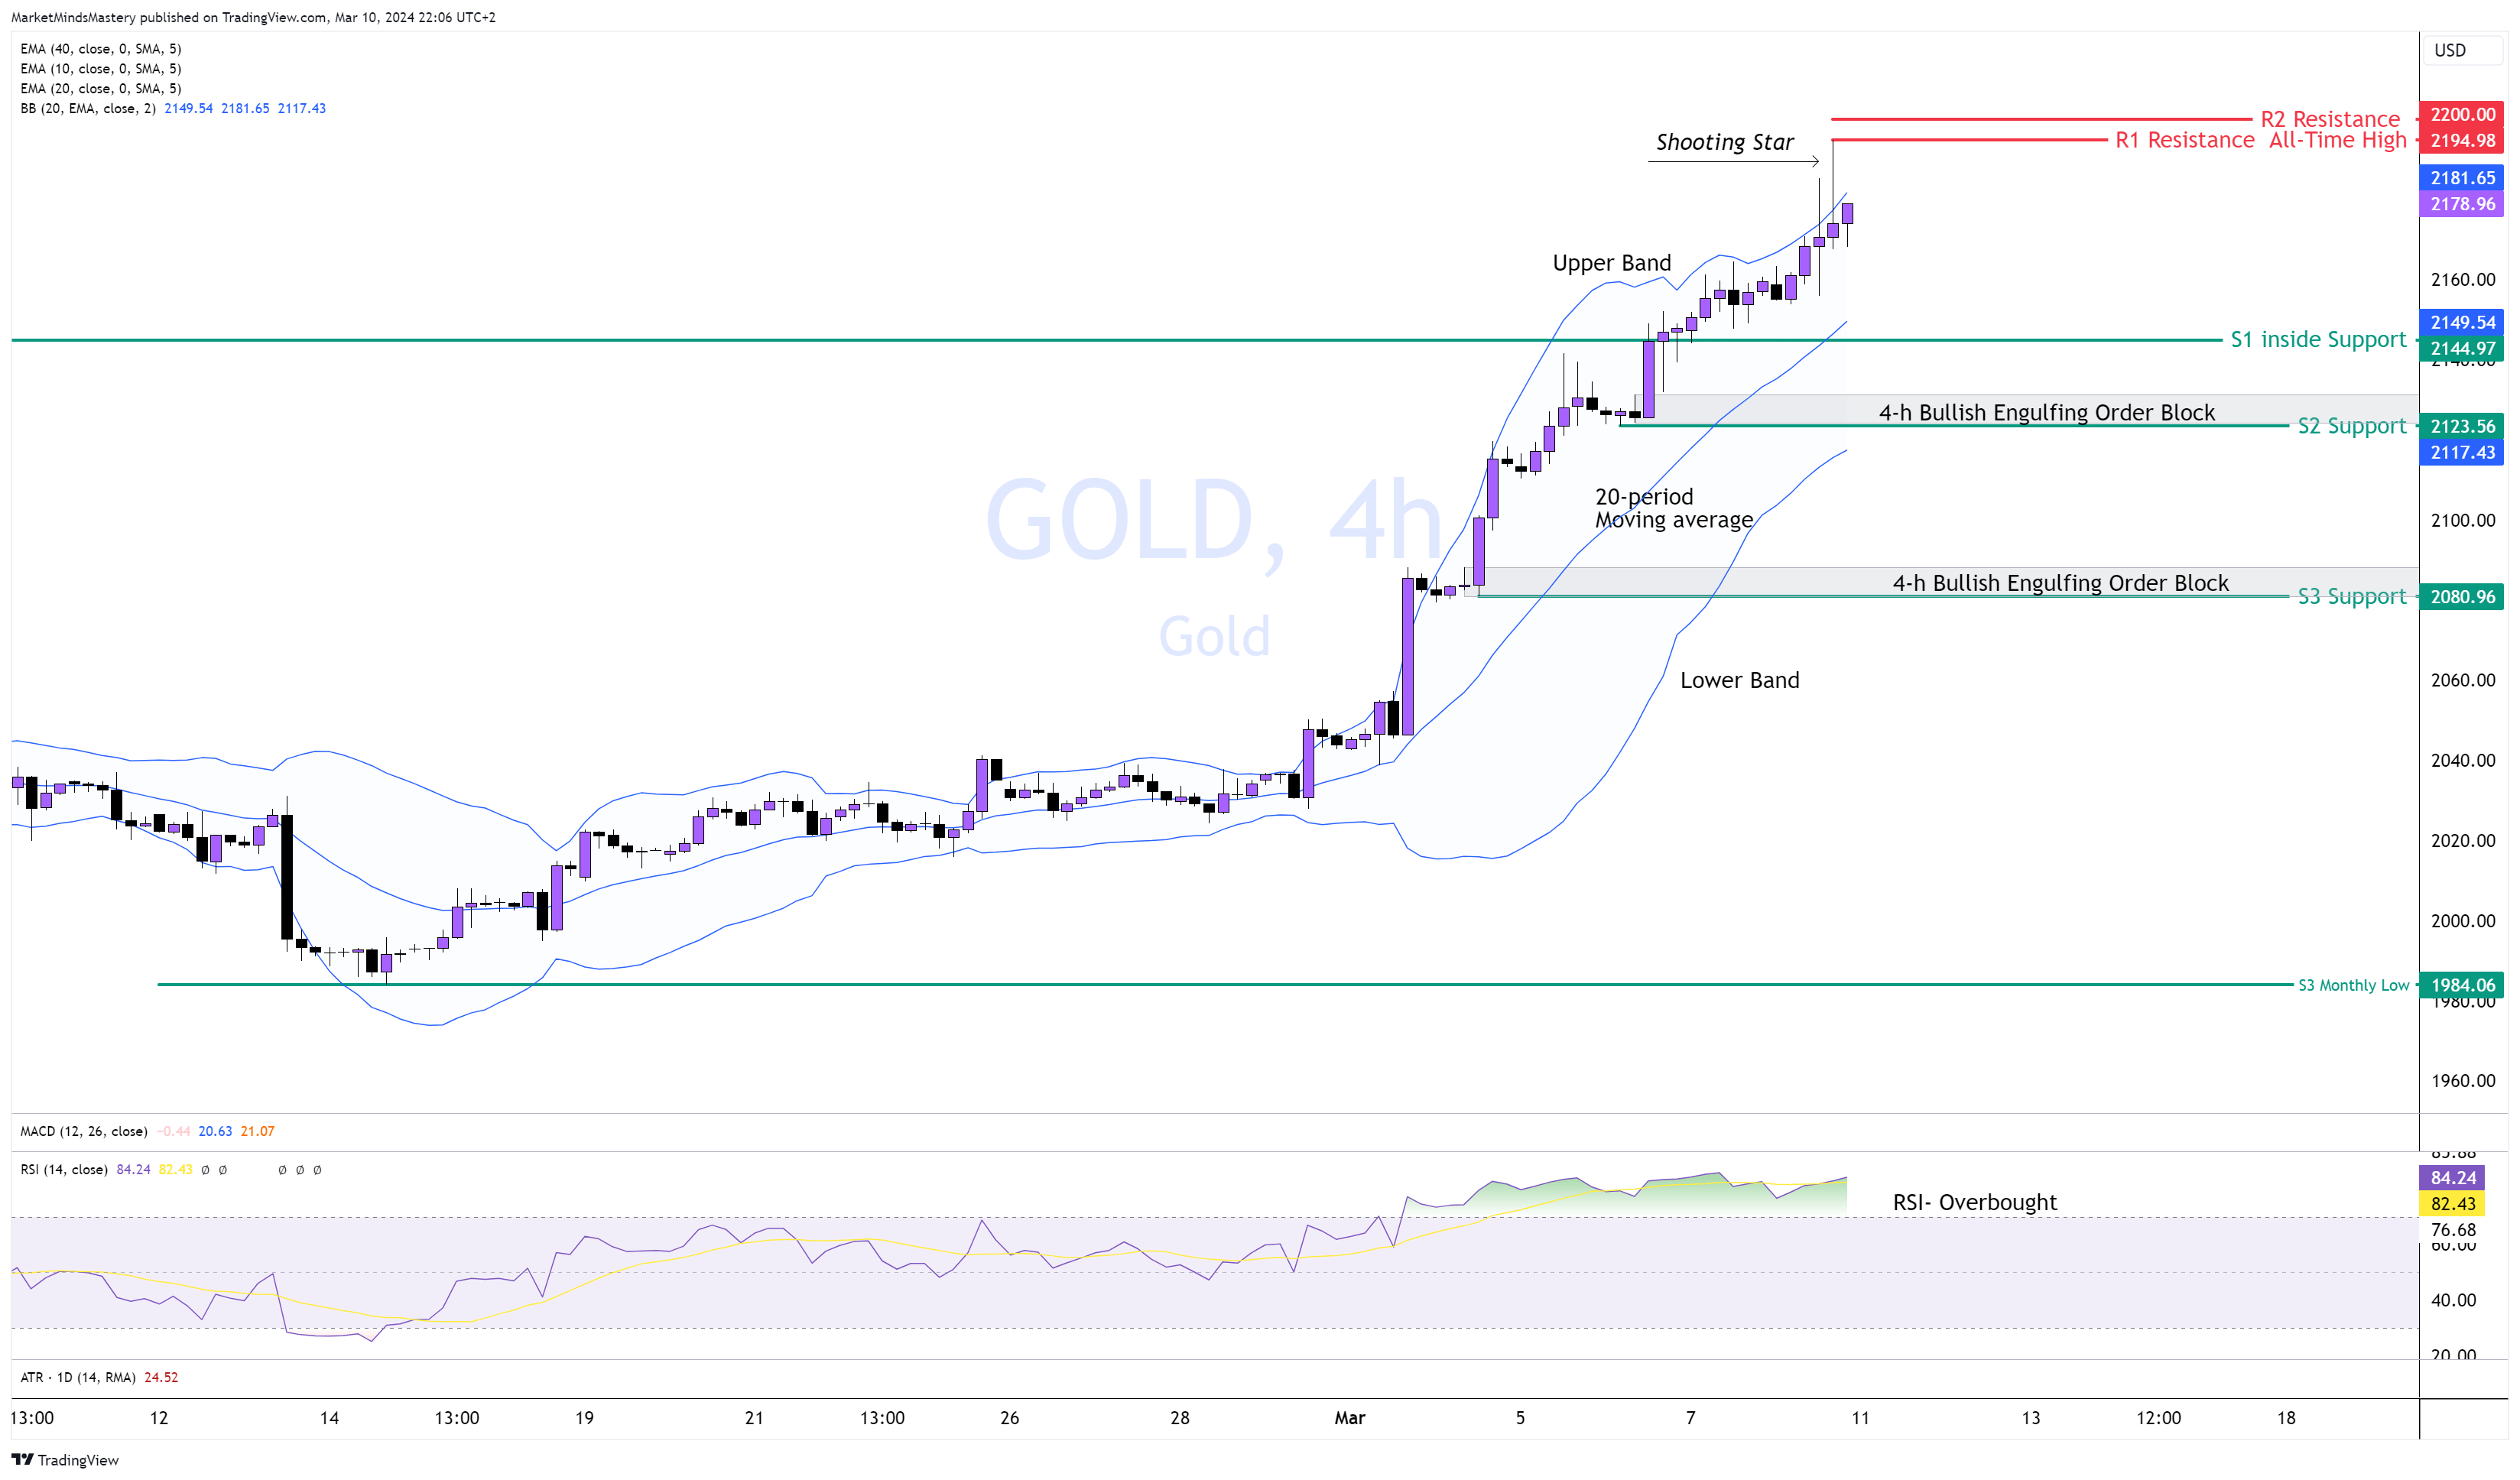
GOLD, 4H
By looking at the weekly candles, Gold had a bullish run last week, one of the biggest in the previous year. Gold created an All-time high, around the $2194. Even during an upbeat NFP, Gold prices didn’t decline noticeably. Since last week, the price on the 4-h chart had shallow retracements. This is a sign of a robust and bullish market.
The RSI is been overbought since the 1st of March, indicating bullishness. The Bollinger Bands keep the price around the upper Band, which is also bullish. Therefore, if the price continues to increase, the All-Time high price will be the first resistance in the Glod market. A new All-Time high will be created if the price successfully penetrates it and closes above it. We will use the round number close to the current price, the 2200. Oppositely, if the price declines and moves downwards, the first support will be the S1 inside support, around 2144. A further decline will find the following support, S2, approximately at 2123. A Bullish Engulfing Orcer Block was created on the 4-h chart at this support.
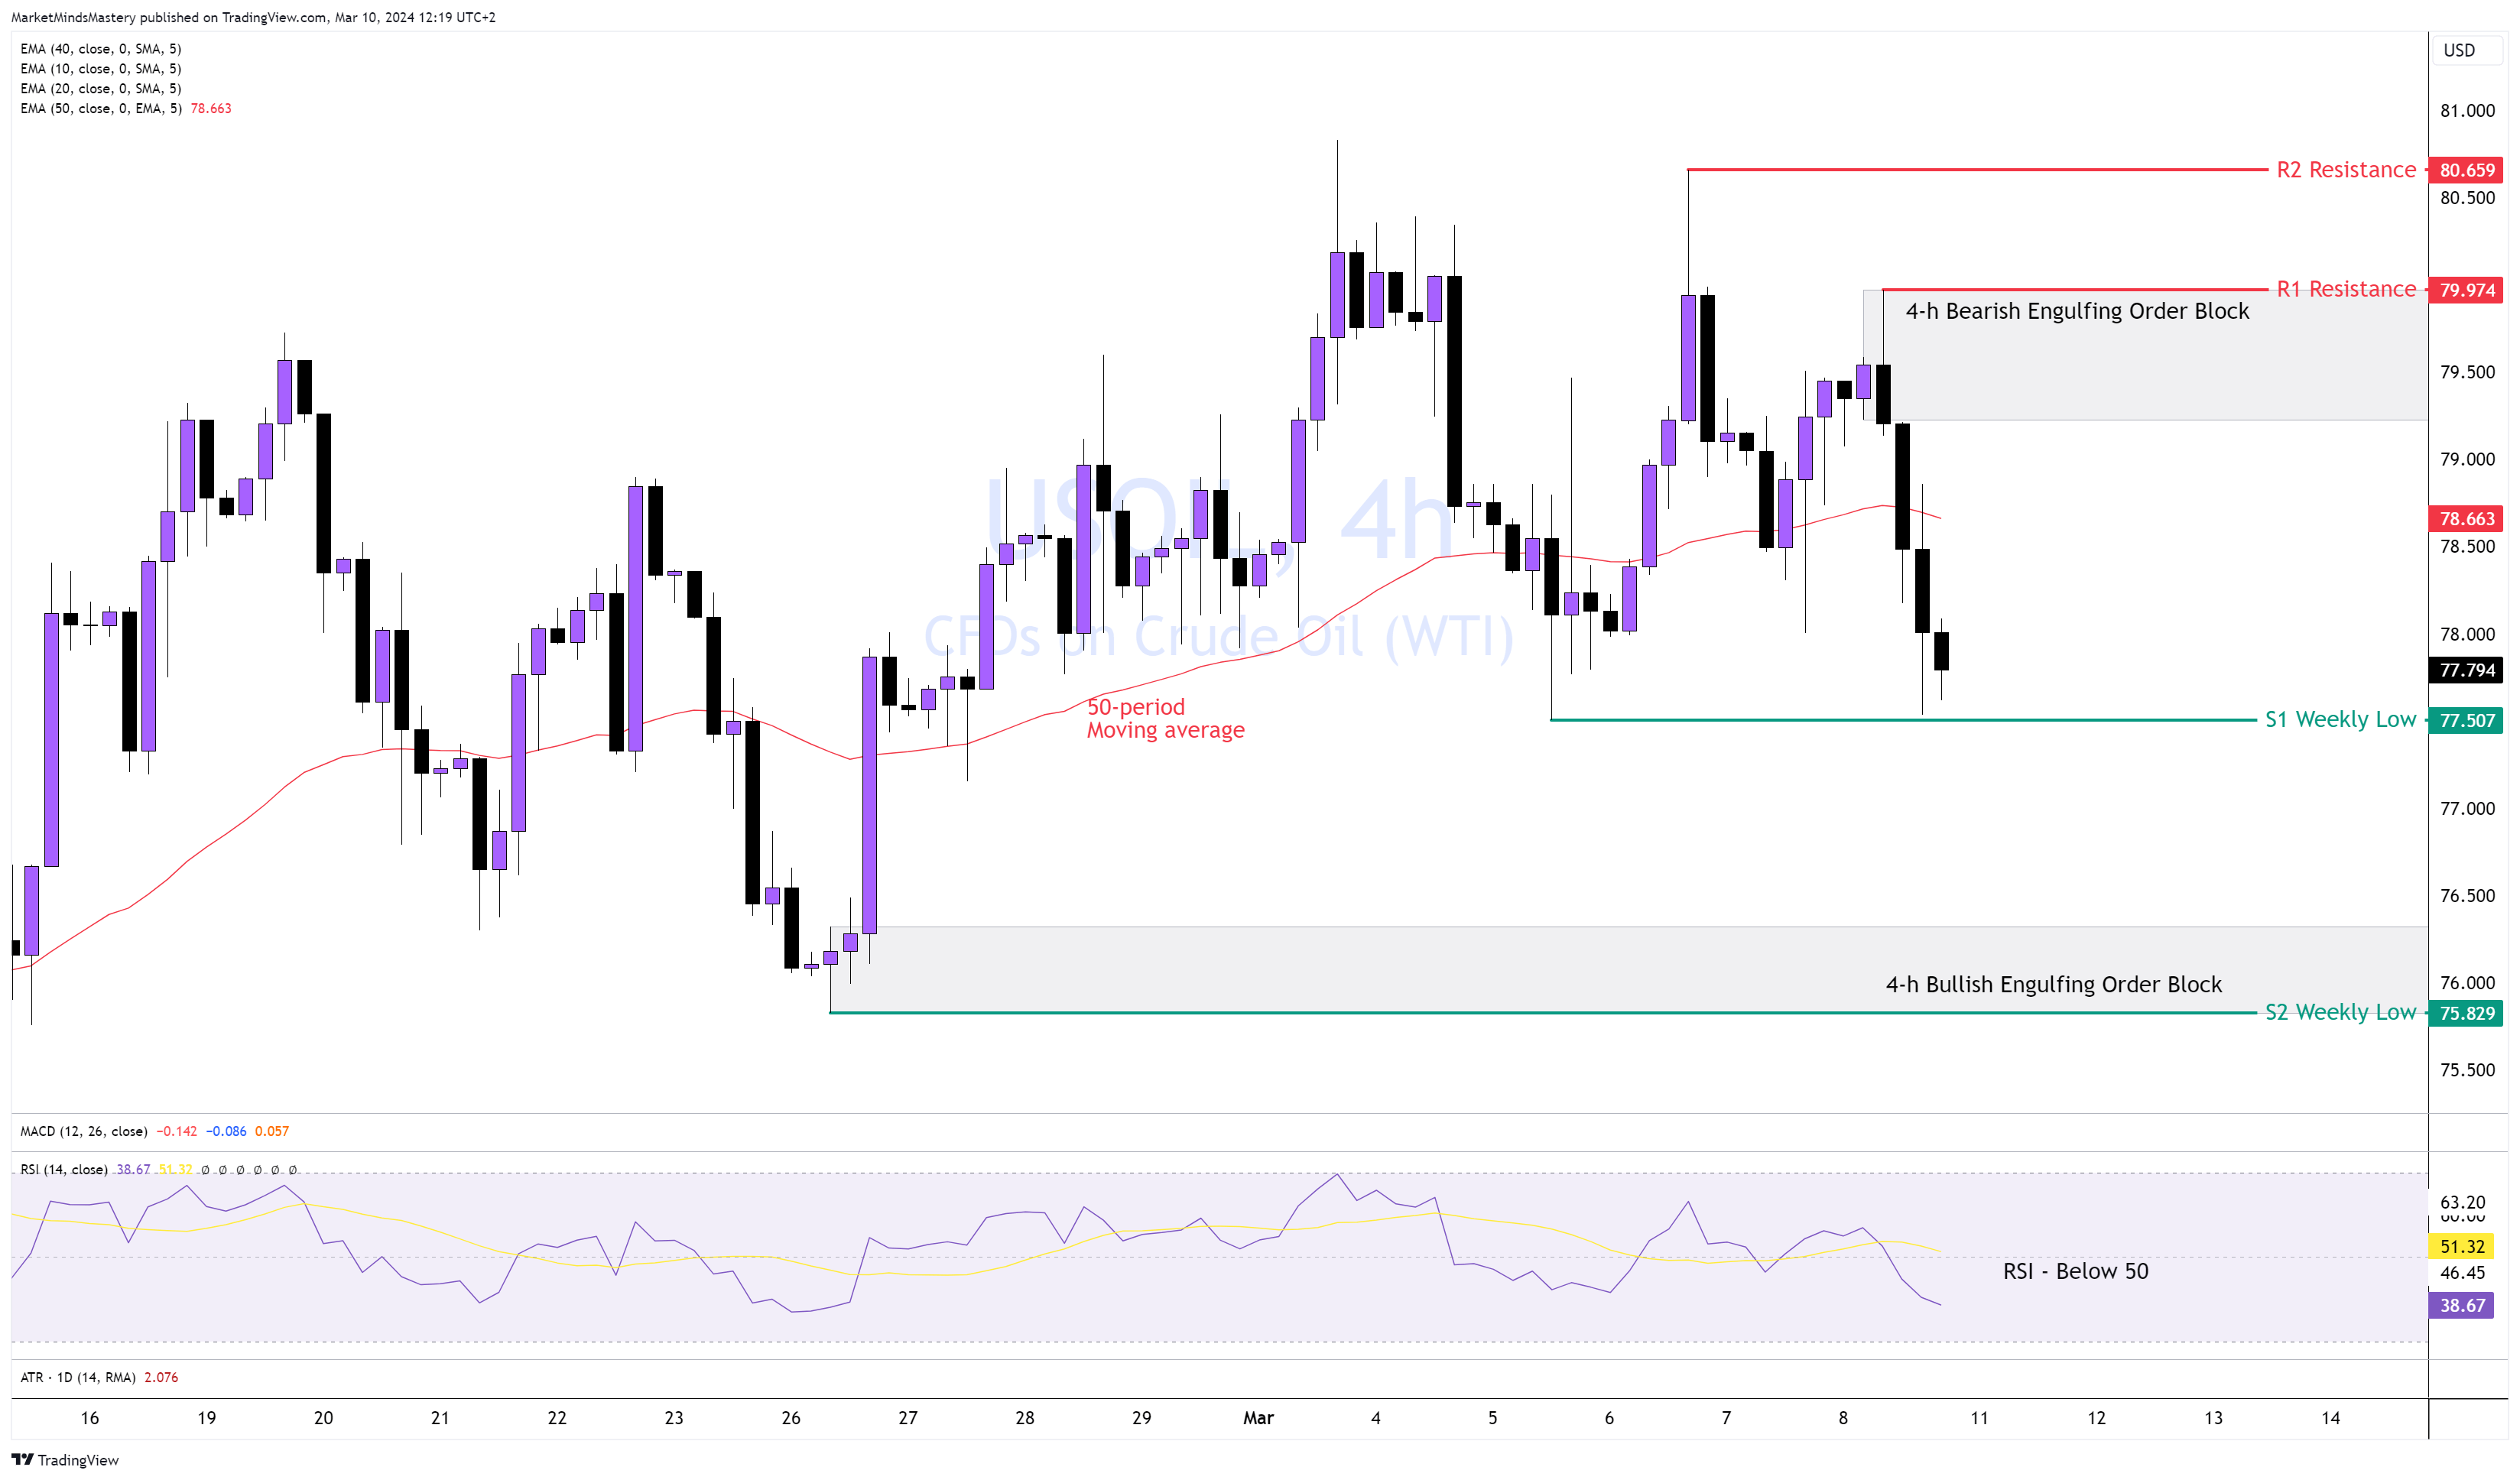
USOIL, 4H
The USOIL hardly made it above $80 last week, and on the 4-h, we utilised the Order Block we marked last week for getting into some bullish moves. The market is trading between the $77.50 - $80.50 area. The price is below the 50-period moving average, which is bearish.
Additionally, the RSI is below 50, indicating bearishness. Based on the 4-h analysis, the first support area, S1, will be around $77.50 if the price moves downward. If the price breaks, closes below it and continues moving lower, the next area of support, S2, is the area of $75.80. In this area, the Bullish Engulfing Ordfer Block was created last month and has never been tested yet.
On the contrary, if the price bounces off any supports and moves upwards, the R1 resistance is around $80.
The market finds a recent Bearish Engulfing Order Block. If the price successively penetrates the R1, closes above it, and moves upwards, the next resistance, R2, is around $80.65.
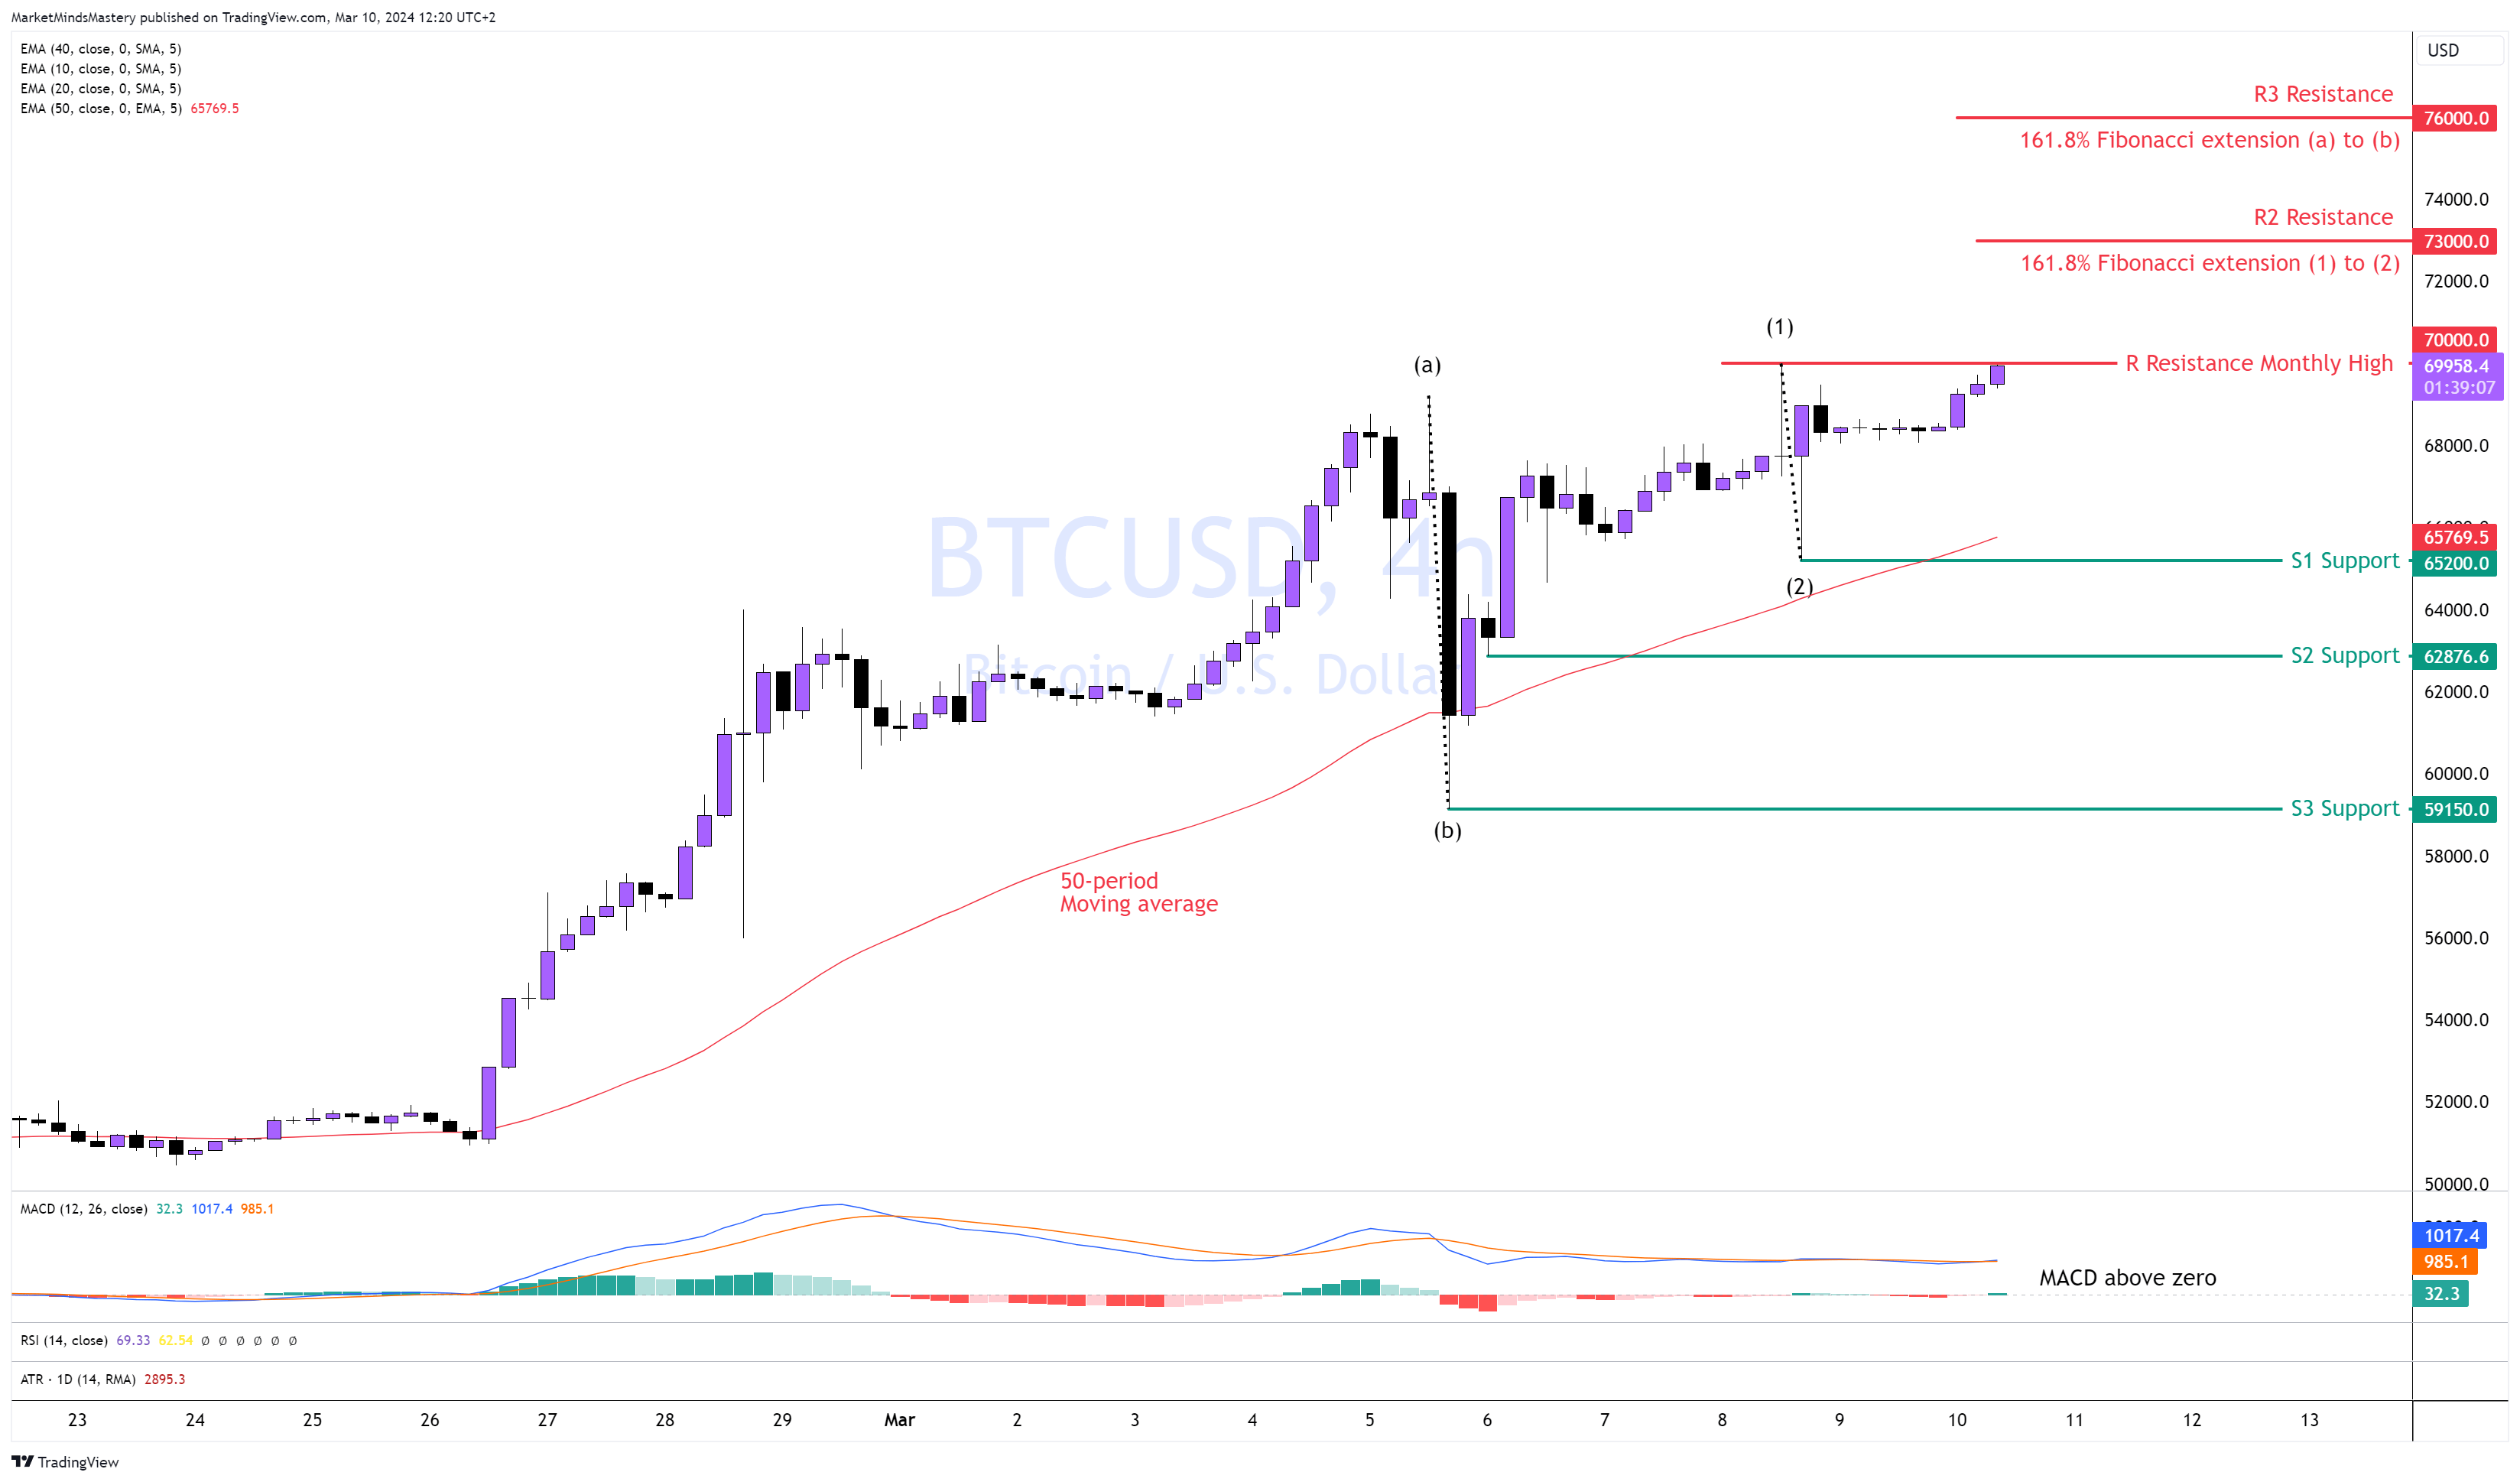
BTCUSD, 4H
Bitcoin created a new All-Time High at around $70000. Last Tuesday, an enormously long Bearish Engulfing candle printed on the Daily chart - right after the minimum target we estimated reached based on the Bullish Pennant pattern, the price, instead of correcting itself, continued its upward move. The weekly candles are still indicating bullishness.
However, a possible retracement can happen, considering the price is at a new all-time high. The price is above the 50-period moving average, indicating bullishness. The MACD is still above the zero line, indicating a bullish market. Therefore, if the price continues to increase, the first resistance area is the R1, around $70000. Using the Fibonacci extension, we estimated two possible targets if the price continues upward.
Measuring the swing (1) to (2), the resistance R2 is approximately $73000, and measuring the swing (a) to (b) indicated the next resistance R3, approximately $76000. On the other hand, if the price declines and moves downwards, the First support area, S1, is around $65200. A further decline is found in the following support S2, at around $62876.
👉 Click here to check our Challenges
👉 Don’t miss our Free Live Webinars
👉Join us on Discord
Risk Disclosure:
The Trading Pit offers only demo accounts to all users within the Challenges and Signal Provider Agreements (Scaling Plan). All assets and trading activities are purely virtual. Please note that we do not offer CFD (Contract for Difference) challenges to residents of Canada and the United States. All content and information on this website is for informational purposes only and should not be interpreted as financial advice. Also, remember that results achieved in the past are no guarantee of future results. It is essential to understand the risks associated with trading. If you are unsure, always consult an independent financial advisor.