The Trading Pit Week Ahead Market Outlook (March 18 – March 24)
The Positive CPI announcement in the US set up the markets with a bullish Greenback, and traders took advantage of momentum moves, primarily in the major pairs. Towards the end of the week, the weakness of the Kiwi boosted the NZDUSD to sell off. Due to Major Banks ' Interest Rate announcements, the markets will experience enormous volatility this week.
On Monday, they will report the Retail Sales in China, and the forecast is expected to decrease the number. The last report was at 7.4%, which is likely to drop to 5.2% this time. We don't usually trade the Chinese Yan, so it won't affect our trading activity.
On Tuesday, volatility will pick up as the Bank of Japan reports its Interest Rates in the early Asian session. This time, they forecast a rate hike from -0.1% to 0%. The BoJ has changed its Interest Rates since 2016. If the rates increase and the market follows through, major reversals are expected on the Japanese Yen pairs as, for now, most of the currencies are pressing the Jen lower. It will be the only significant event for the Japanese Yen.
Next, the Reserve Bank of Australia will report its Interest Rates and the forecast estimates to keep them unchanged at the current rate of 4.35%. Usually, a depreciation follows the currency if the rates remain the same.
Moving forward into the New York trading session, the Bank of Canada will report the February CPI (Consumer Price Index). Currently, it is at 2.9%, and the forecast estimates a rise to 3.1%. If the forecast is confirmed and the market follows through, a strength in the Canadian Dollar might be seen. As the EURCAD is hoovering around a Monthly Resistance, this may offer tradable opportunities.
The CPI number will be reported in the UK on Wednesday. Currently, it is at 5.1%, and as per the forecast, a drop to 4.6% is expected. The market might see a weak sterling if the actual number confirms the prediction.
All the attention for the day will be primarily on the USD, as towards the end of the New York trading session, the FED will report the Interest Rates. They are expected to keep them at the current 5.5%. The FOMC Press Conference will follow.
Last week, all the majors created inside candlestick price action on their weekly chart, which led to market indecision and no new highs or lows registered. The outcome of this event is likely to point to directional moves in the major currencies. New Zealand's GDP (Gross Domestic Product) will be reported on Thursday. The forecast estimated an increase from -0.3% to 0%, which can be bullish for the Kiwi.
Next, in Australia, they will report the Unemployment Rate, and the current 4.1% is expected to decrease to 4%.
The next major event will be the Interest Rates in Switzerland. Currently, the rates are 1.75%, and there is no forecast number per your calendar. If the Switzerland National Bank increases its rates, the Swissy will gain strength. Next, in Germany, three events will be announced. The Composite, Services and Manufacturing PMI are expected to remain below the Benchmark 50, which is considered bearish for the Euro. The same precisely three events will also announced 30 minutes later by the Eurozone. Similarly, all three are expected to remain below 50, which is also considered bearish for the Euro.
The last significant event for the day will be the announcement of Interest Rates in the UK. The majority of the Members, actually six, voted for unchanged rates, two for a rate hike, and one for a rate cut.
It will be interesting to see any sudden surprise in the outcome.
The week will end on Friday, with the UK reporting on its Retail Sales. The consensus estimated a drop in the number, from 3.4% to -0.3%, which can add to Sterling's weakness. The last event for the week will be the S&P Global Services PMI in the US.
Currently, the available number is the previous report, which was 52.3.
EUR USD 4H

As per our analysis last week, the price entered the 4-h Bullish Engulfing Order Block and bounced off, moving upwards, creating the R1 resistance around 1.08997. As the price on the 4-h chart declines, the RSI is below 50, indicating bearishness in the market. If the price continues to move downwards, the S1 weekly low of around 1.08730 will be the first support. If the price declines further and penetrates the S1, the next support, S2, is another weekly low of around 1.08402. At this level, we identify a 4-h Bullish Engulfing Order Block.
Conversely, if the price moves upward to resume the daily uptrend, the R1 resistance of around 1.08997 must be broken. If the price closes above R1 and moves upwards, the next resistance, R2, at approximately 1.09639, will be the next important area in this market. That is a weekly high, and it adds significance to that level.
GBP USD, Daily
Out of all major pairs, the Sterling shows overall strength against the US Dollar, as observed in the weekly chart. The two moving averages on the weekly chart show an uptrend.
However, last week’s price action was an inside candle, crediting strength to the US Dollar.
The daily chart creates higher highs, which is a potential development of a new uptrend. The RSI oscillator is above 50, supporting a bullish bias.
From the low at point (c) to the high at point (b), the Fibonacci retracement level of 61.8% is around 1.27.
Consequently, if the price moves upwards, the first resistance area, R1, is approximately 1.28231. On the 4-h chart, a Bearish Engulfing Order Block was developed in that area. If the price penetrates R1 and closes above it, the next resistance, R2, is around 1.28705.
On the other hand, if the price declines further, the S1 support is the first level at which the price might find some buyers, as it aligns with the 61.8% Fibonacci retracement.
A confluence like this attracts many traders. If the price moves below S1, the next support, S2, is a weekly low of around 1.26508.
AUD USD 4H
Following the recent upward move on the Daily chart, the price entered into a correcting phase last week, and on the 4-h chart, it created a series of lower highs and lower lows, indicating a bearish market. The RSI is currently below 50, supporting the bearish bias. If the price on the 4-h chart continues to move downwards this week and penetrates the previous week’s low of around 0.65522, it will find the next support around 0.64927.
A Bullish Engulfing Order Block was created at this price level, which can cause a market reaction. If the price respects the daily uptrend, then this price area will likely become a high-probability turning point to resume the daily uptrend. Therefore, if the price bounces off from this level and moves upwards, it can meet the first resistance R1, an inside resistance of approximately 0.65845. A move beyond this finds the next resistance, R2, to be the previous week’s high, around 0.66389.
USD JPY 4H
Last week’s price action was an inside candle closing above the 10-period weekly moving average. The 4-h chart shows an upward move while the price created a series of higher highs and higher lows. The RSI is well above 50, almost in an overbought condition. The price currently trades above the 50-period moving average of the 4-h time frame. All these indicate bullishness.
The two Bullish Engulfing candles indicate the buyers' control of the market. Starting Monday, if the price enters into the 4-h Bearish Engulfing Order Block, which consists of the previous week’s high and the 61.8% Fibonacci retracement, declines and moves lower, it may move until the S1 support, approximately 148. If the price declines further and keeps lowering, the next support, S2, is around 147.234.
Opposivly, if the price surpasses the R1 resistance and moves upwards, the next resistance area, R2, is around 149.47. If the price closes above it, the next resistance, R3, is around 150.565.
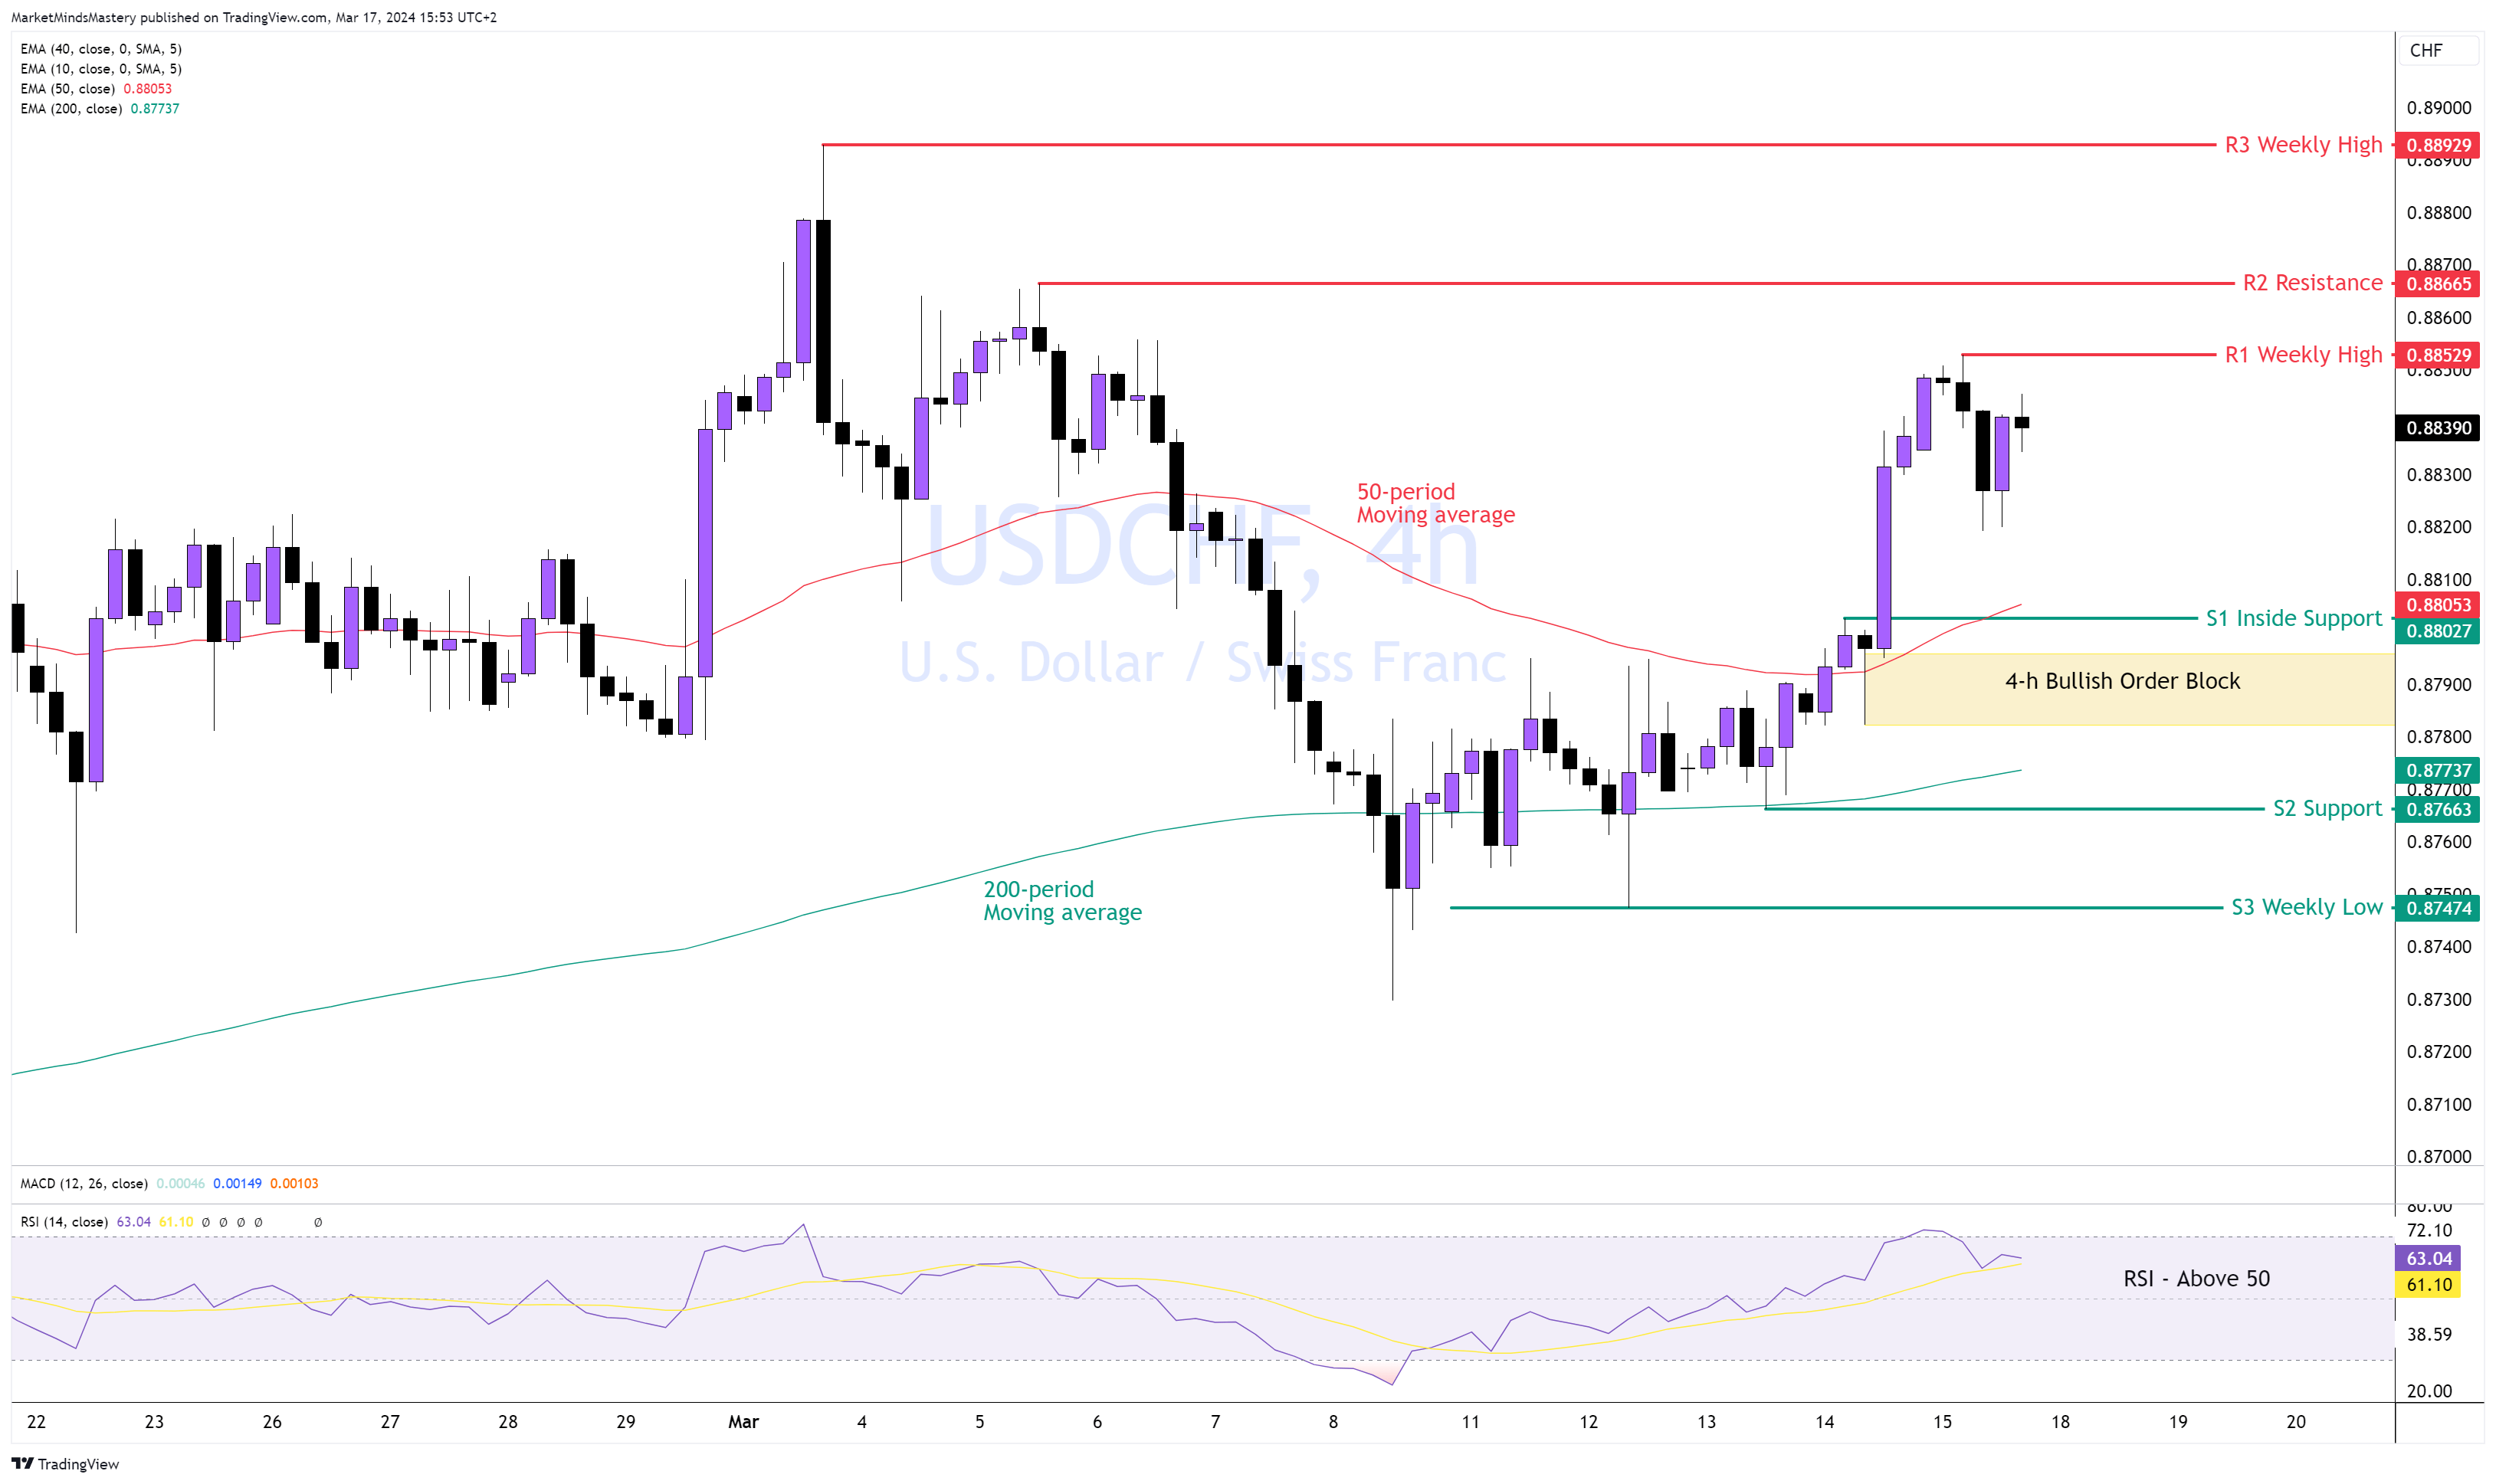
USD CHF 4H
Following last week’s rejection of the 200-period moving average on the 4-h chart, the price found support and bounced off upwards, creating a 4-h uptrend with prominent higher highs and higher lows. The price is trading well above both the 50- and 200-period moving averages. The RSI is above the 50, indicating bullishness.
Therefore, if the price continues to move upwards, the previous week’s high, around 0.88529, becomes the R1 resistance. If the price surpasses it, closes above it, and moves upwards, the next resistance, R2, is around 0.88665. A move higher than the R2 finds the R3 resistance, approximately 0.88929.
On the other hand, if the inside weekly candle (the previous week's candle was inside) ends up being a short-term retracement, the Price will decline and move downwards, finding the first support, S1, as inside support at approximately 0.88053. A move below will find the S2 support around 0.087663, almost at the same level as the dynamic support of the 200 4-h moving average.
GBPJPY 4H
Last week’s price action ended as a Bullish hammer candle, rejecting the 10-period weekly moving average( equivalent to the 50-period daily moving average).
On the 4-h chart, the price broke and closed above the 50-period moving average, indicating bullishness. The RSI is also above 50, which is bullish. The price increased, indicating the potential development of a new uptrend.
Starting Monday, if the price continues to increase, the 190 level, which is last week’s high, will serve as the first resistance, R1. If the price penetrates R1 and moves higher, the next resistance area, R2, is approximately 190.692.
On the contrary, if the price declines and moves downwards, the first support area, S1, is the low of the Bullish Engulfing candle that created the impulse upward move, approximately 188.594. A refined 4-h Bullish engulfing Order Block developed at that price level. If there is any further decline and move below the S1, find the next support area, S2, at approximately 187.962.
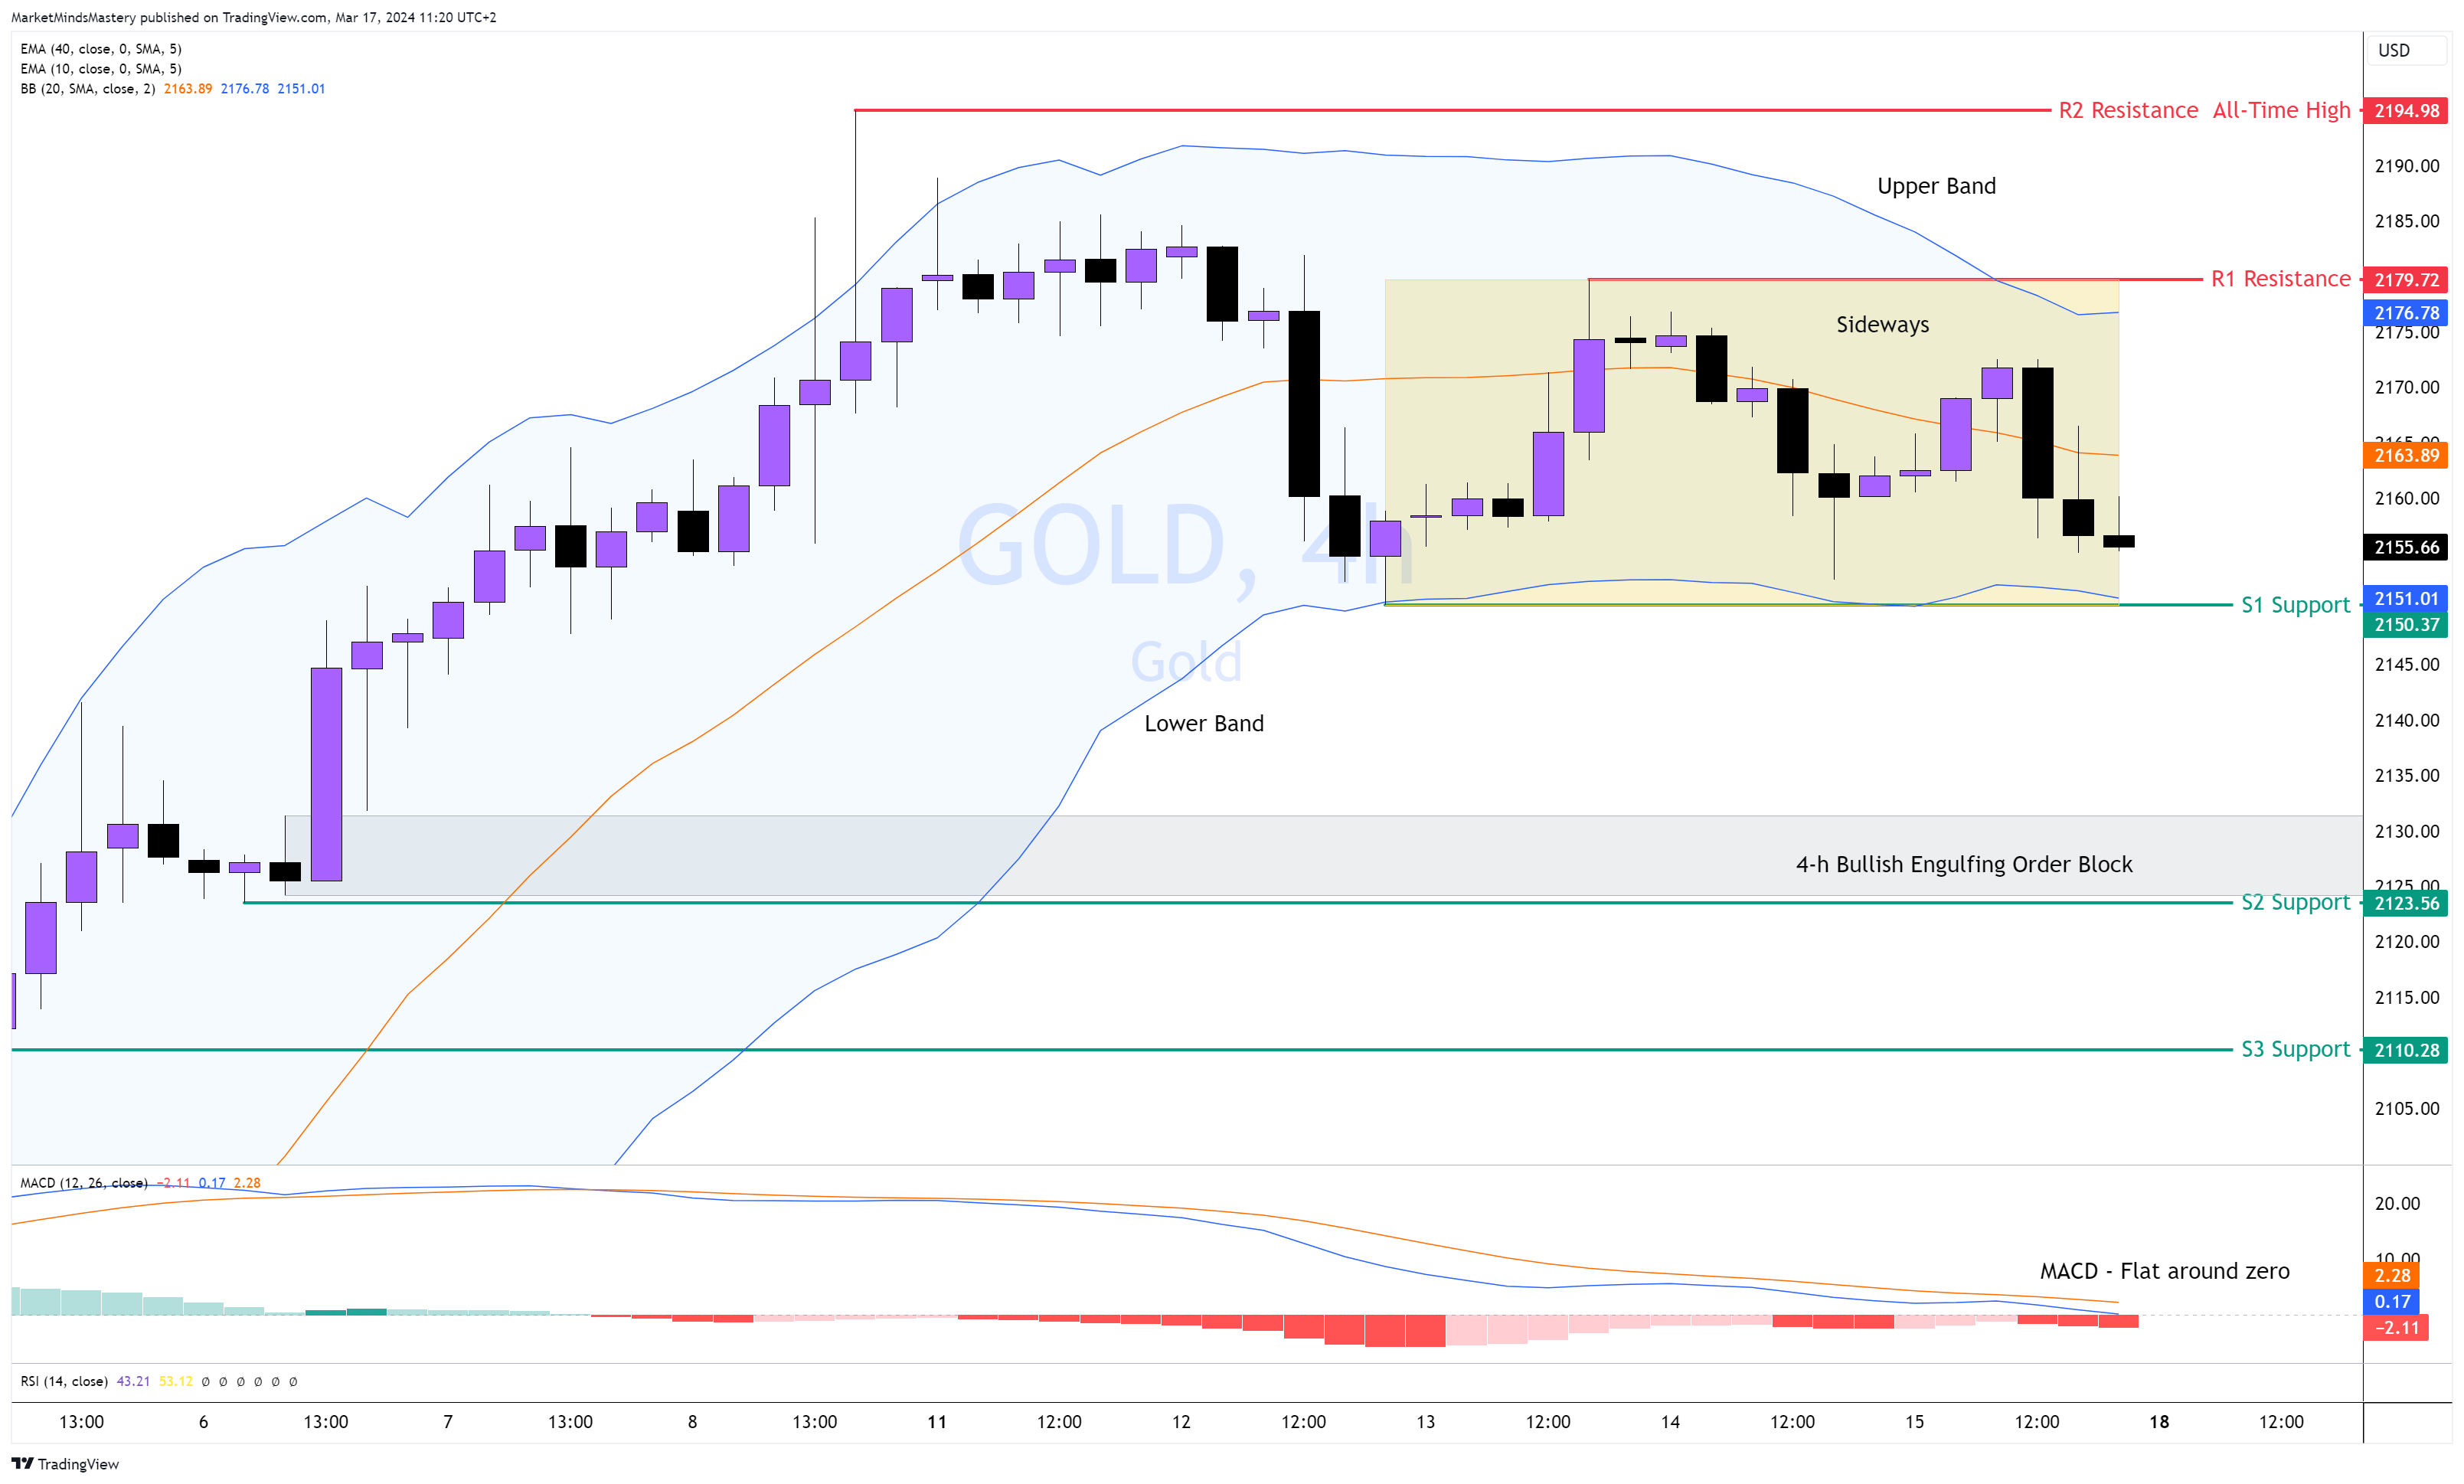
GOLD, 4H
Last week, Gold created an inside candle on the weekly chart without any sign of buying pressure in the market. Analysing the 4-hour chart, the price traded sideways, remaining within the upper and lower bands of Bollinger Bands. Consequently, the MACD returned to zero. As the markets ebb and blow, and this is how they operate, if a weekly chart enters a corrective phase, the price on the 4-h chart will decline. If the price breaks below the yellow rectangle and closes under the S1 support, around $2150, as shown on the chart, it may travel to the next area of support, S2, around $2123. A bullish engulfing Order Block has been constructed around the same level since the beginning of the month. A further decline can meet the next area of support, S3, approximately at $2110.
On the other hand, if the price penetrates the upper part of the Bollinger band, it will fund the first resistance R1, around $2179. If the price moves above it and closes higher, the next resistance area is R2, around $2194, which is an All-Time High.
USOIL, 4H
Following the support price of around $77.50, the Price bounced off and moved beyond the $80.5 resistance last week. As the Price has reached a new high, the market anticipates a new uptrend. The Price is above the 50-period moving average, which is bullish. At the same time, the MACD is trading well above its zero line, which is also a bullish indication. Currently, the Price is consolidating around $81. It is worth mentioning that last week's price action was a Bullish Engulfing candle. Consequently, if the Price moves upwards, the previous week's high will be the first resistance, R1, around $81.59. If the Price penetrates and closes above it, the next resistance, R2, is a monthly high of around $83.57.
On the contrary, if the Price declines further for a correction, the previous month's high can act as a support, S1, at around $80. At the same price level, a Bullish engulfing Order Block was created. A deeper correction can find a confluence of supports around the 50-period moving average, the 61.8% Fibonacci retracement and the S2 inside support.
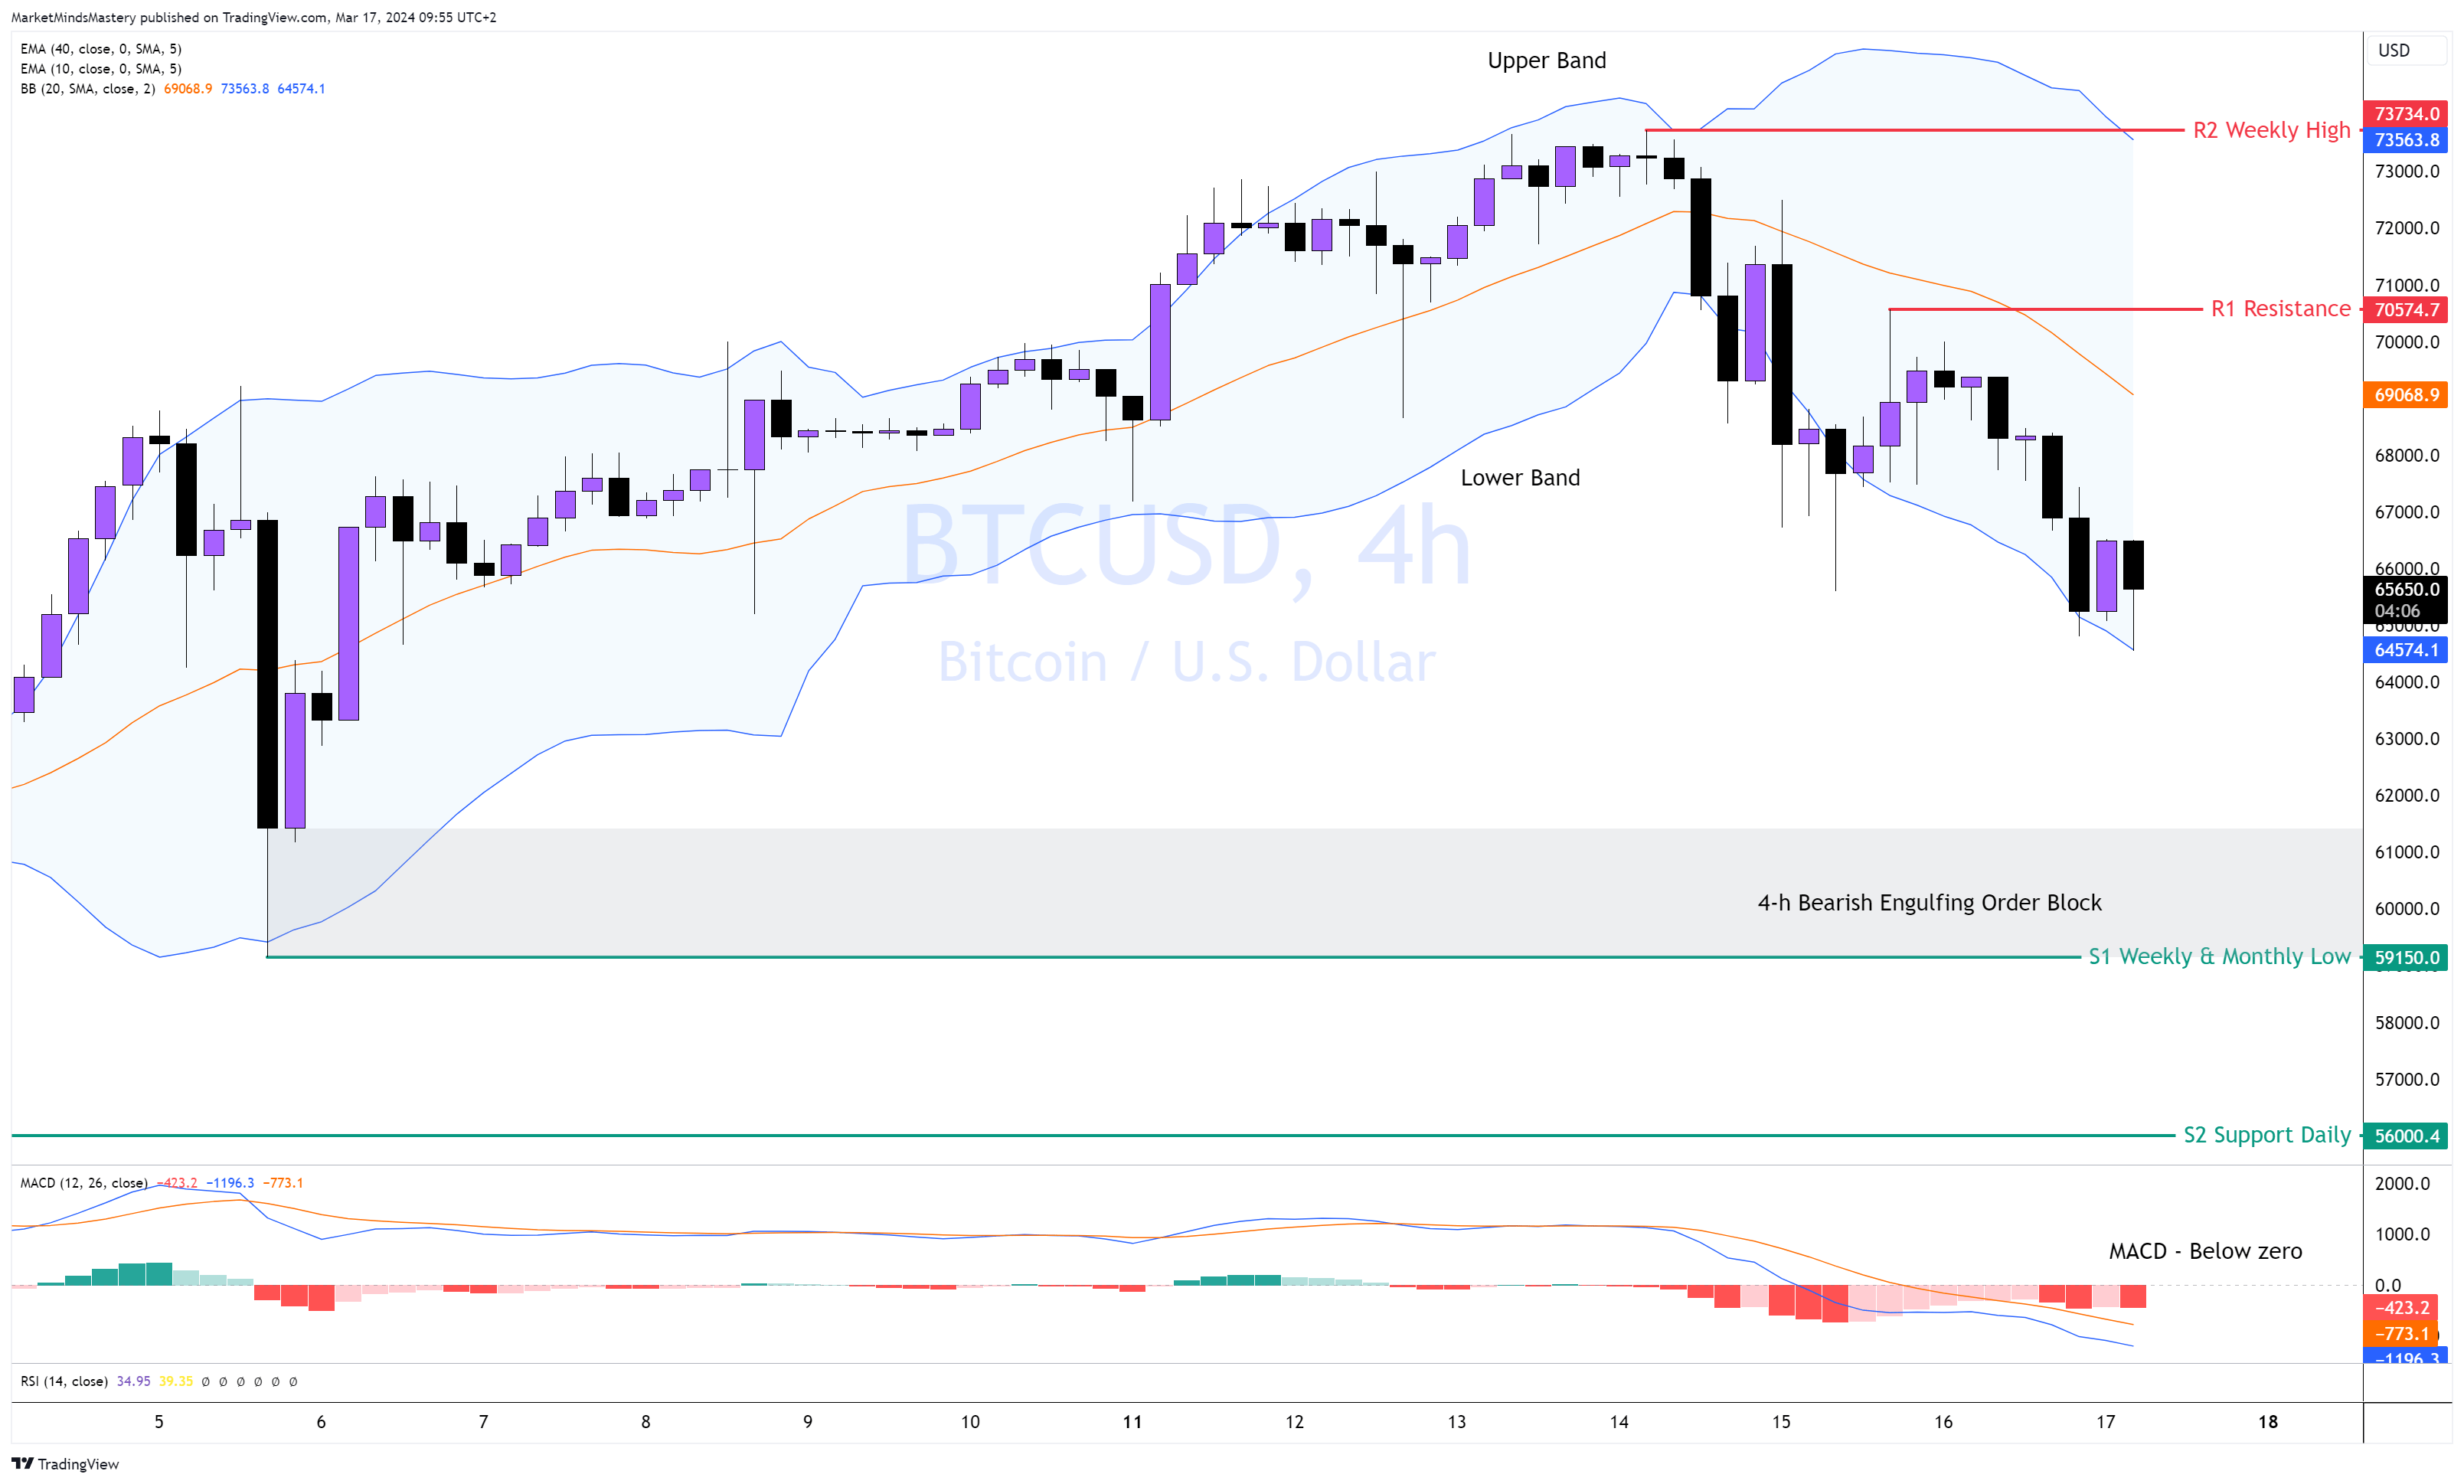
BTCUSD, 4H
Following the upward move per last week’s analysis, Bitcoin created a new All-Time High of around $73700, falsely breaking to the upside of the 161.8% Fibonacci extension (as we marked resistance last week) and moved downwards.
Using the Bollinger Bands, the price trades below the 20-period moving average (orange line) in lower highs and lower lows, indicating bearishness. The MACD is trading below its zero line, which is also a bearish indication. The Bollinger bands don’t show signs of price contraction at the current time, and the bearish candles have noticeably longer bodies than the bullish ones.
Therefore, if the price continues to lower, the next support, S1, is a weekly and monthly low of around $59150. Looking on the left of the chart, the price left an unmitigated Bullish Engulfing Order Block. If the price penetrates it and moves lower, the next support, S2, is a Daily low found at approximately $56000.
Conversely, if the price finds bullish pressure and advances, the first resistance, R1, is approximately $70574. A further rally will meet the R2 resistance at its All-Time high of around $73700.
SP500, 4H
Despite the weekly price action being, for the second week in a row, a long-legged doji, the Price created a new All-Time High of around 5196. As the Price could not maintain robust bullish price action above $5190, the Price experienced a false break out and rapidly declined, forcing the RSI to create negative (bearish) divergences. Looking at the chart, the retracements are "deep" and not "shallow", which is another sign of market weakness. The long, black, bearish candles reveal that sellers are in control. Entering this week, if the Price moves downward, the first support, S1, is last week's low, approximately $5091. If the Price penetrates the S1 and closes beneath it, the next area of support, S2, is around $5058, another weekly low price. Oppositely, if the Price moves upwards, the first resistance R1, is around $5174. There is a 4-h Bearish Engulfing Order Block that can cause traders attention. If the Price surpasses R1 and moves higher, the next resistance is R2, an all-time high price of around $5196.
US30, 4H
Following a retest of the high price of All-Time last week, around 39280, the price declined with a few noticeable long bearish marubozu candles—both these candles developed by Order Blocks as shown on the chart. The RSI is below 50, indicating selling pressure in the 4-hour time frame. The daily chart created an equal top price formation, accompanied by negative RSI divergences, which have bearish implications.
Hence, if the price continues to lower this week, the area around $38500 hosts a Bullish Engulfing Order Block and a weekly low, which can be the S1 support. If the price closes below the S1 and moves lower, the next support, S2, is around $38327. If the price moves to the upside, the first resistance, R1, is approximately 39000, a round number that traders might be interested in. At the same price level, a Bearish Engulfing Order Block was developed. If the price penetrates the R1, closes above it, and moves higher, the next resistance, R2, is the previous week’s high, at around $39283. Another well-defined and unmitigated Bearish Engulfing Order Block was created.
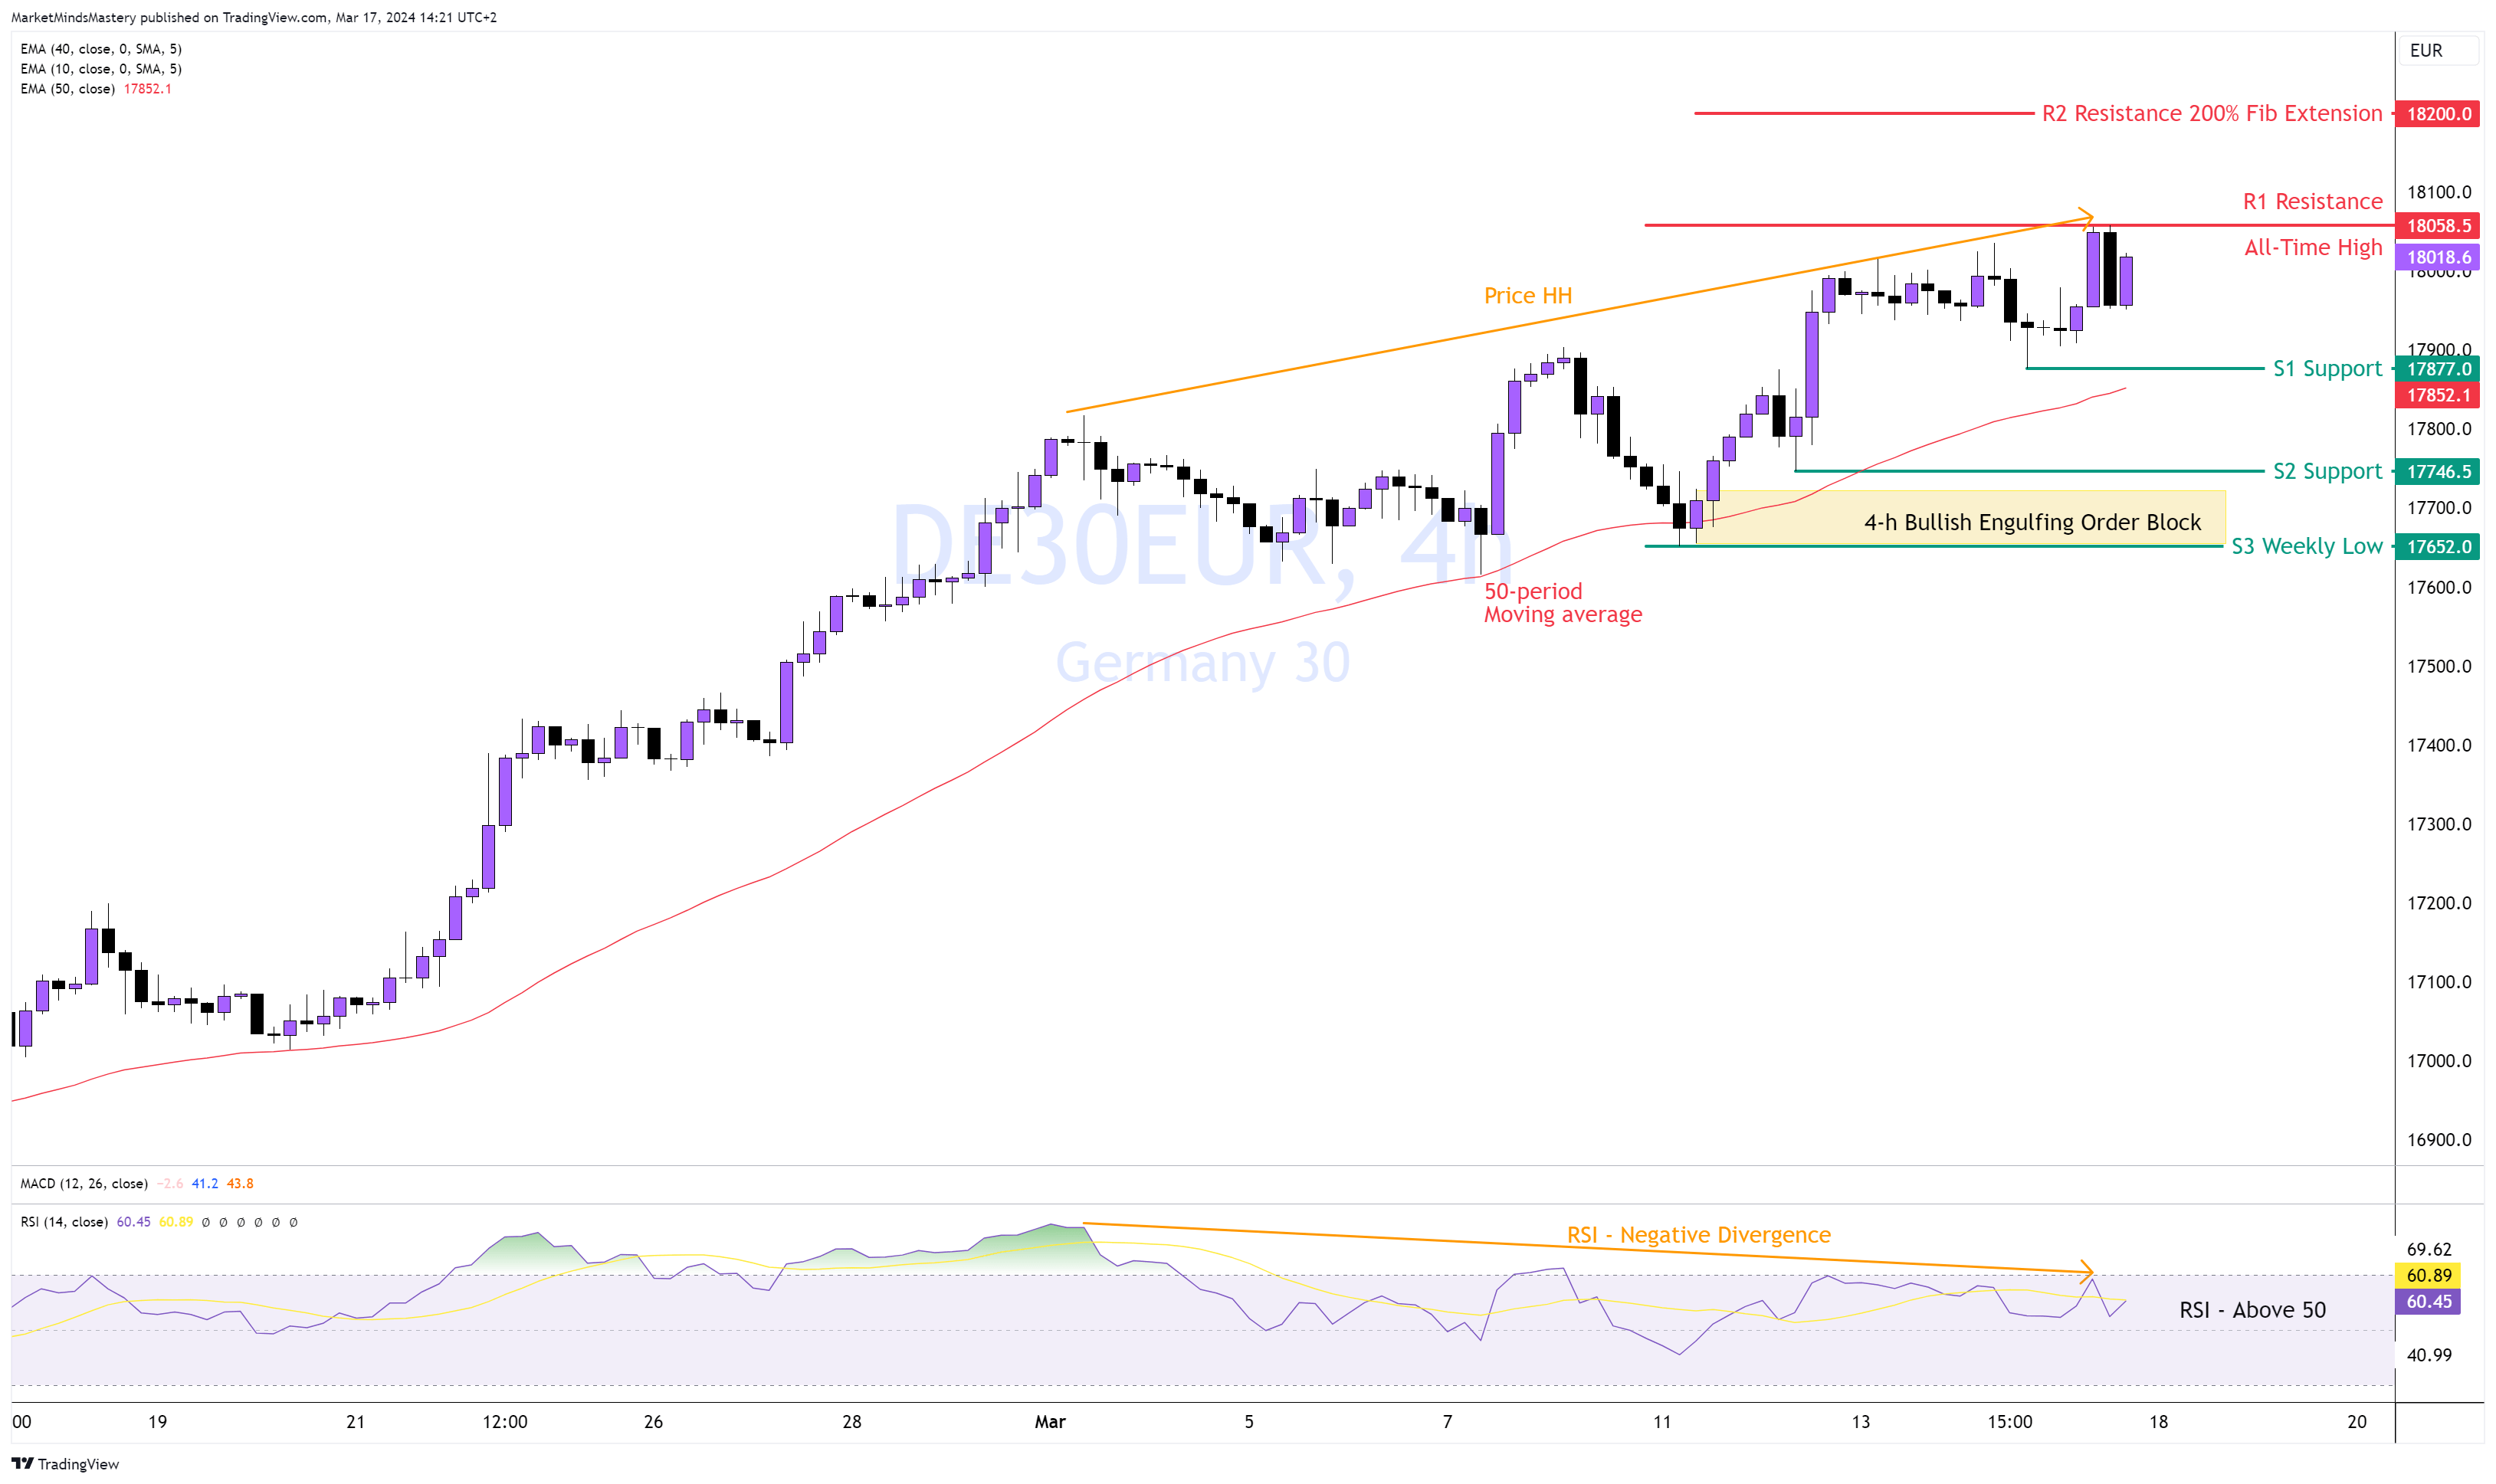
GER40 4H
Although a few weeks ago, on the weekly chart, an uptrend preceded a doji candle, the market continued its upward move last week, creating a new All-Time High price of around 18500. Last week’s price action was a bullish candle. The price on the 4-h chart makes higher highs and higher lows, which is bullish. The Price is trading above the 50-period moving average, which is also bullish. The RSI is above 50, showing buying pressure. Therefore, if the price continues to move upwards, the first resistance is the last week’s high, around 18058. A close above it and a move beyond it will register a new All-Time High. Using the Fibonacci extension tool, the 200% measuring the last swing of the price retracement finds the next possible resistance R2, approximately 18200.
On the contrary, if the price enters into a weekly correction, the price on the 4-h chart will decline. If the price drops and moves downwards, the first support, S1, is around 17877.
A “deeper” correction finds the low around 17746 as the next support, S2.
👉 Click here to check our Challenges
👉 Don’t miss our Free Live Webinars
👉Join us on Discord
Risk Disclosure:
The Trading Pit offers only demo accounts to all users within the Challenges and Signal Provider Agreements (Scaling Plan). All assets and trading activities are purely virtual. Please note that we do not offer CFD (Contract for Difference) challenges to residents of Canada and the United States. All content and information on this website is for informational purposes only and should not be interpreted as financial advice. Also, remember that results achieved in the past are no guarantee of future results. It is essential to understand the risks associated with trading. If you are unsure, always consult an independent financial advisor.