The Trading Pit Week Ahead Market Outlook (March 25 – March 31)
Last week, the Reserve Bank of Australia kept their Interest Rates unchanged at 4.35%, the Bank of Japan increased their rates to 0%, the Fed kept the rate in the US unchanged at 5.5%, the National Switzerland Bank decreased the rates in Switzerland to 1.5%, and the Bank of England kept the rates in the UK unchanged at 5.25%. At the end of the trading week, the markets appreciated the Japanese Yen, the Greenback, and the dump, the Swissy (short for the CHF).
No significant events will occur on Monday and Tuesday this week.
Starting Wednesday, Australia will report the Monthly Consumer Price Index. The previous CPI report was 3.4%, and the Consensus estimates an increase of the inflationary indication to 3.6%. An increase in the CPI number is always positive for the currency, and if the Aussie follows through with a positive outcome, it might boost the Australian dollar.
On the other hand, positive CPI is not a good indication for consumers as they may need to spend more money to purchase the same products.
Australia will report Retail Sales for February early Thursday morning. In the last report, Retail Sales were at 1.1%, and the Consensus estimated a decrease to 0.4%. If the outcome confirms the forecast, it will show weakness in Australia’s economy, and the Australian dollar may be negatively affected. A potential selling opportunity may arise in the AUDUSD if the Aussie weakens. However, in the case of a strong Australian dollar, the GBPAUD on the short side may also be another pair to keep our attention to as it hit a weekly resistance and might activate selling orders in the market.
During the European trading session in Germany, they will report the Retail Sales for February, and the Consensus estimates an increase from -1.4% to -0.9%. The Euro can be the winner if the actual confirms the forecast and if the Euro follows through.
At the same time, the Gross Domestic Product will be reported in the UK, and the Consensus forecasts an unchanged number of -0.3%. Any surprise outcome that deviates from the forecast can fluctuate the Sterling after the event.
If the outcome is reported as more significant than the forecast, the Sterling may rally and gain strength and oppositely, an outcome much less than the forecast may create a sell-off on the Sterling.
The only major event on Friday will be the Consumer Price Index in Japan. The previously reported number is 2.5%, and the forecast estimates a decrease to 2.4%. As mentioned above, a positive CPI number adds value to the currency and might boost the Japanese Yen, adding to its strength from last week’s Interest Rate hike.
Due to Good Friday celebrations, banks will be closed in Australia, New Zealand, Switzerland, Germany, Spain, the Eurozone, the UK, Canada, and the US.
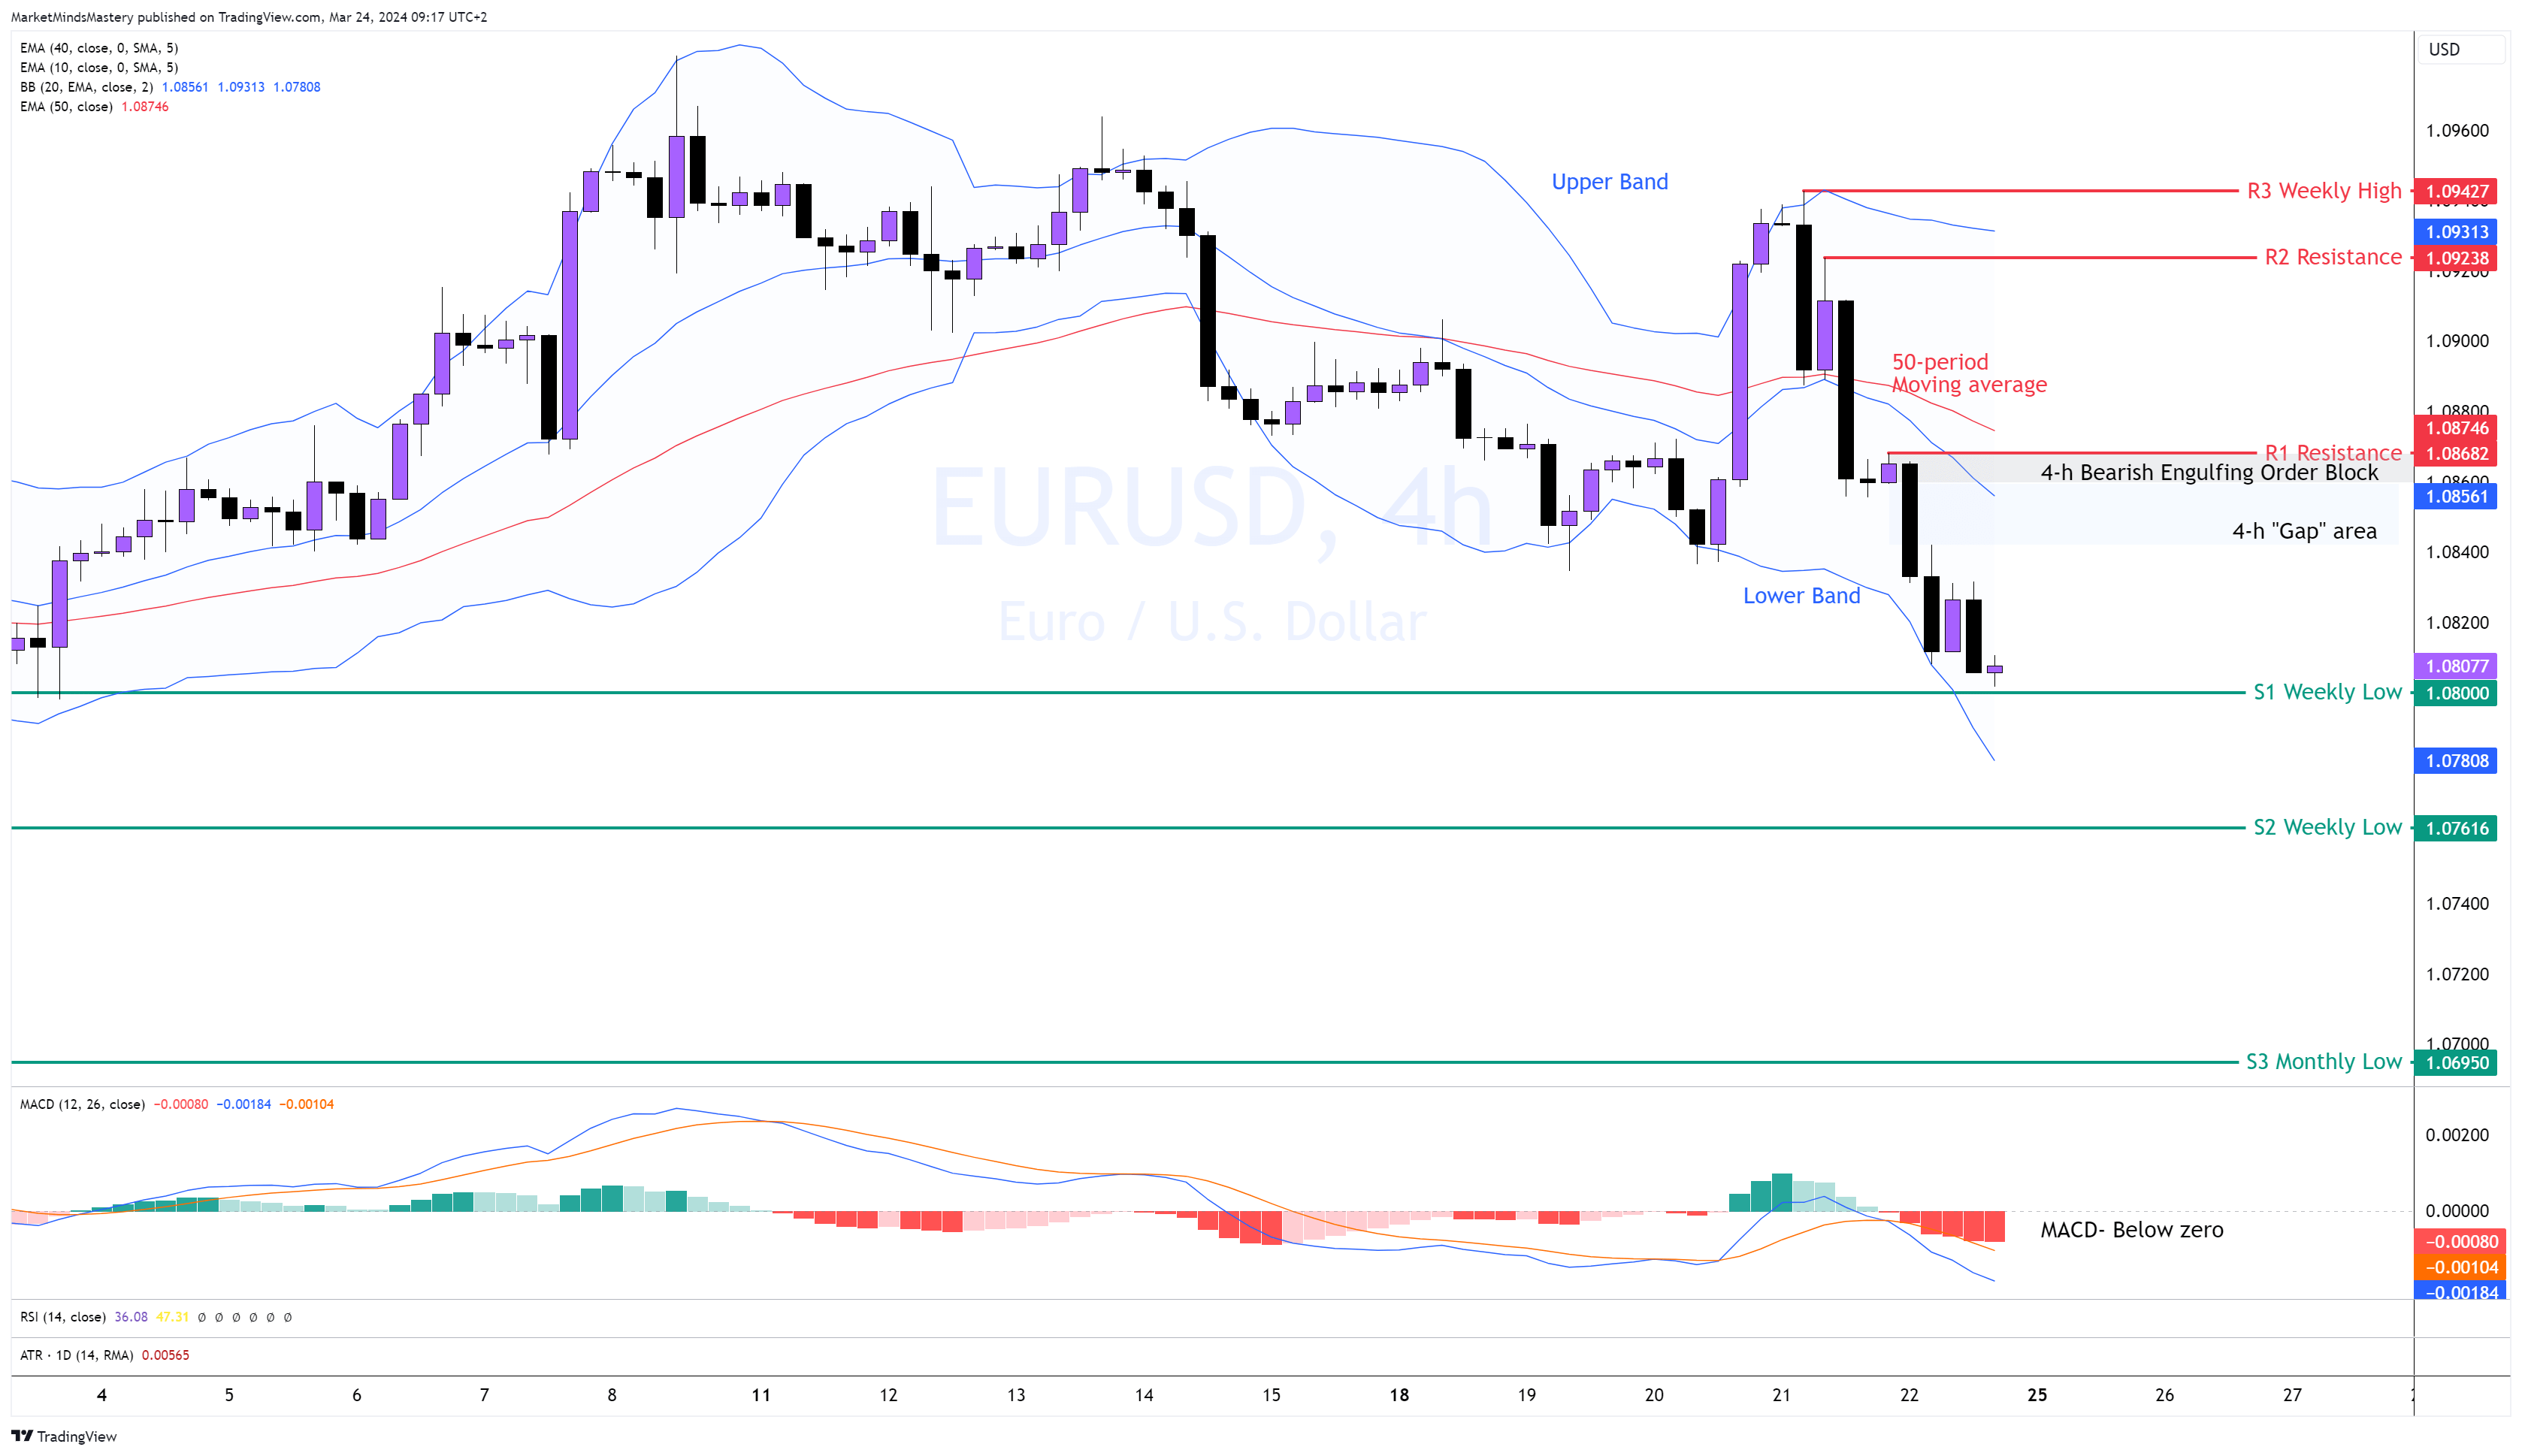
EUR USD,4H

The US dollar’s strength came towards the end of the week even though the Fed kept the interest rates in the US at 5.5%. The price created a lower low and a lower high formation, which shows the shift in the market from buyer to seller and has bearish implications. Additionally, the 20-period moving average (blue line) crossed the 50-period moving average (red line), and the price is trading at the lower band of the Bollinger Bands indicator. Also, the MACD shows bearishness as it moves below the zero line, and the blue line (MACD line) crosses below the orange line (Signal line).
On its way down, the price left behind a “gap” area, where it met significant selling pressure. The origin of the last downward move created a Bearish Engulfing Order Block.
Starting Monday, if the price continues lowering, keeping its LH LL formation, the first support, S1, is the previous week’s low, around 1.08000. If the price penetrates the S1, closes under it and moves downwards, the next support area, S2, is an old weekly low, around 1.07616. The further decline can lead the price to the monthly low, S3 support, approximately 1.06950.
On the other hand, if the price advances and moves upwards, the first resistance area, R1, is approximately 1.08682. If it moves above that, the next resistance, R2, is around 1.09238.
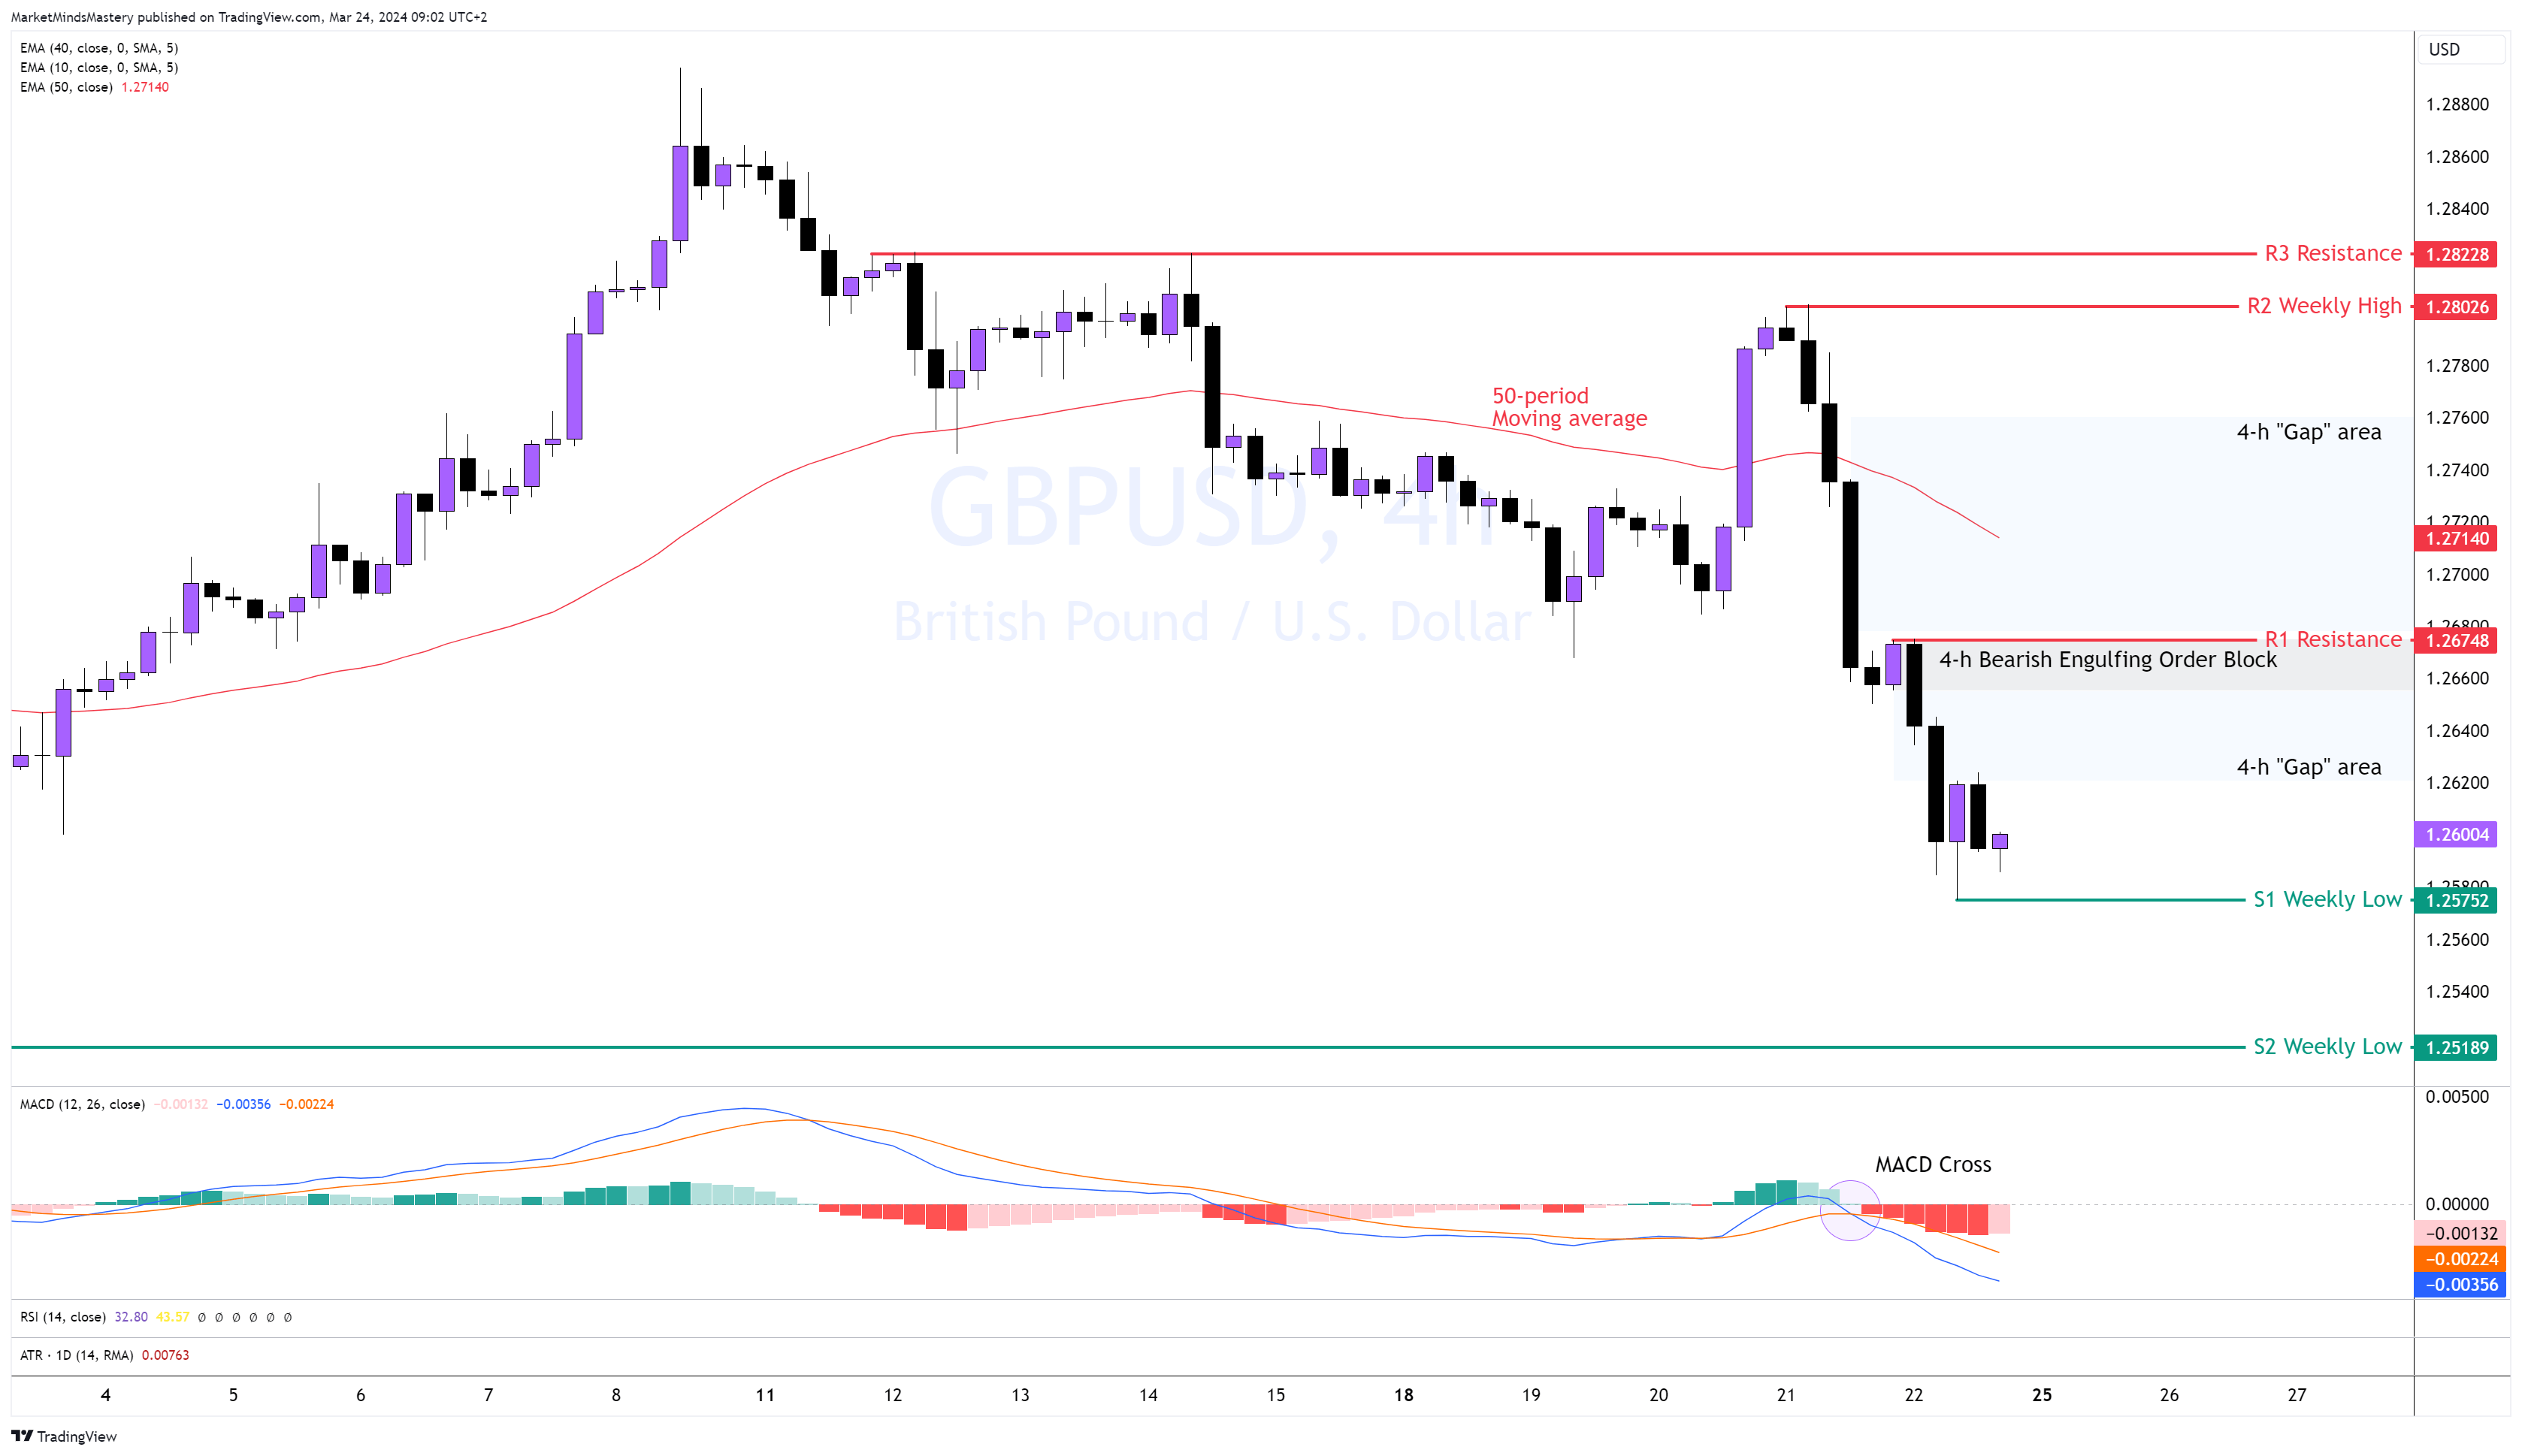
GBP USD 4-h
The 4-h Bearish Engulfing Order Block from last week’s analysis tested successfully. The price declined, moved downwards and created a new market structure in the 4-h time frame. The lower highs and lower lows are accompanied by long bearish candles, indicating that the sellers are aggressive. The price closed below the 50-period moving average, indicating a bearishness and the MACD Line (blue colour) of the MACD crossed below the Signal line (orange colour) and moved under zero, indicating a bearish market. Additionally, the price left behind two areas of 4-h “gaps”.
Starting Monday, if the price continues moving downwards, the previous week’s low, S1, around 1.25800, will become the first support area. If the seller keeps dominating the market, and the price closes under the S1 and moves lower, the next support area, S2, is an old weekly low of approximately 1.25189.
On the contrary, a bounced-off and an upward move can cause a market correction. If the price rally, the first resistance area R1 is approximately 1.26748. At this level, a Bearish engulfing Order Block was found. A further upward move finds the price filling up a “gap” area with the R2 resistance, which is the previous week’s high, to be around 1.23826.
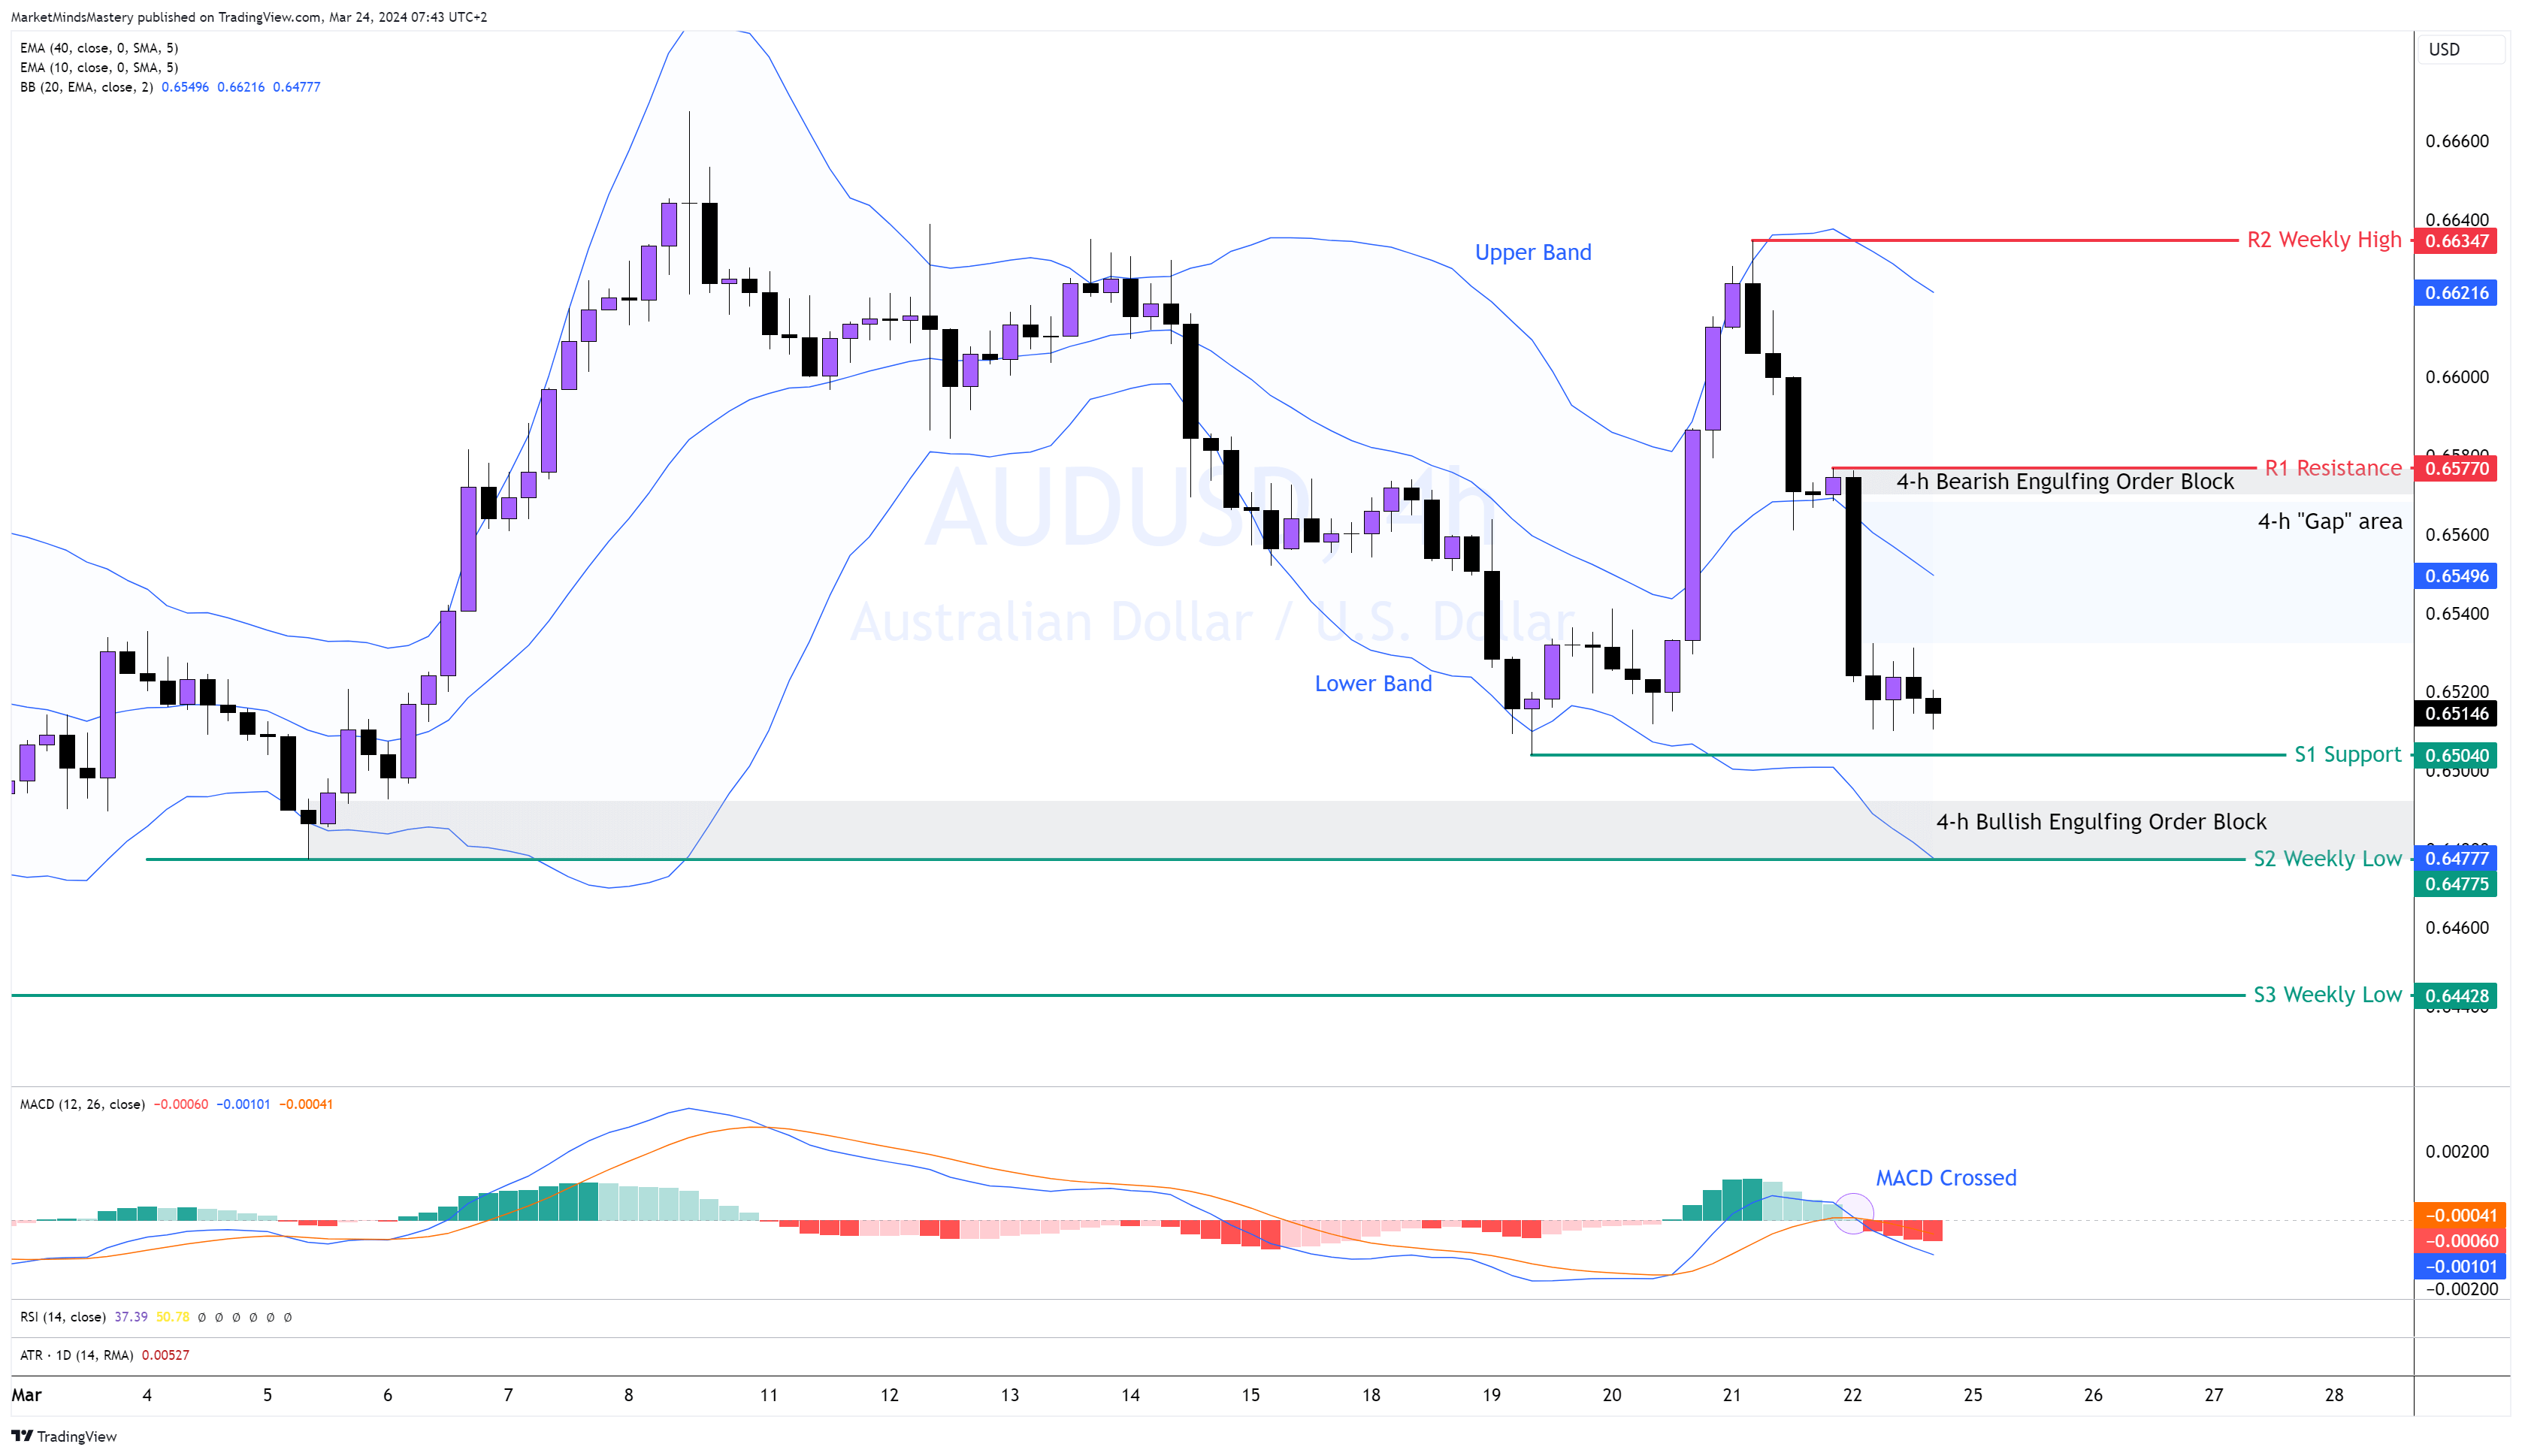
AUD USD 4H
The previous week, the RBA and the FED kept Australian and US Interest Rates unchanged, respectively. Within the same day, the market appreciated the Aussie and created an upward impulsive move and, by the end of the previous week, retraced 100% of the move, moving downwards. On the weekly chart, this price move is shown as a bearish candle with an upper wick rejecting the 10-period and 40-period weekly moving averages. The MACD Line (blue) of the MACD crossed below the Signal line (orange colour) and moved under zero, indicating a bearish market. The price is trading below the middle of the Bollinger Band, which is also a bearish indication. However, the price didn’t make a lower high and lower low formation; therefore, a cautious approach is needed at this stage.
If the price moves downwards, the first support, S1, is approximately 0.65000. A break, close below the S1 and moving away from it, finds the next support area, S2, approximately 0.64777. At this price level, there is a well-defined Bullish Engulfing Order Block.
Opposively, if the price bounces off and moves upwards, the “gap” area is likely to get filled, and the price will find the first resistance area, R1, around 0.65770. If the price continues its upward move, closes above the R1, and moves upwards, the next resistance area, R2, becomes the previous week’s high of approximately 0.66347.
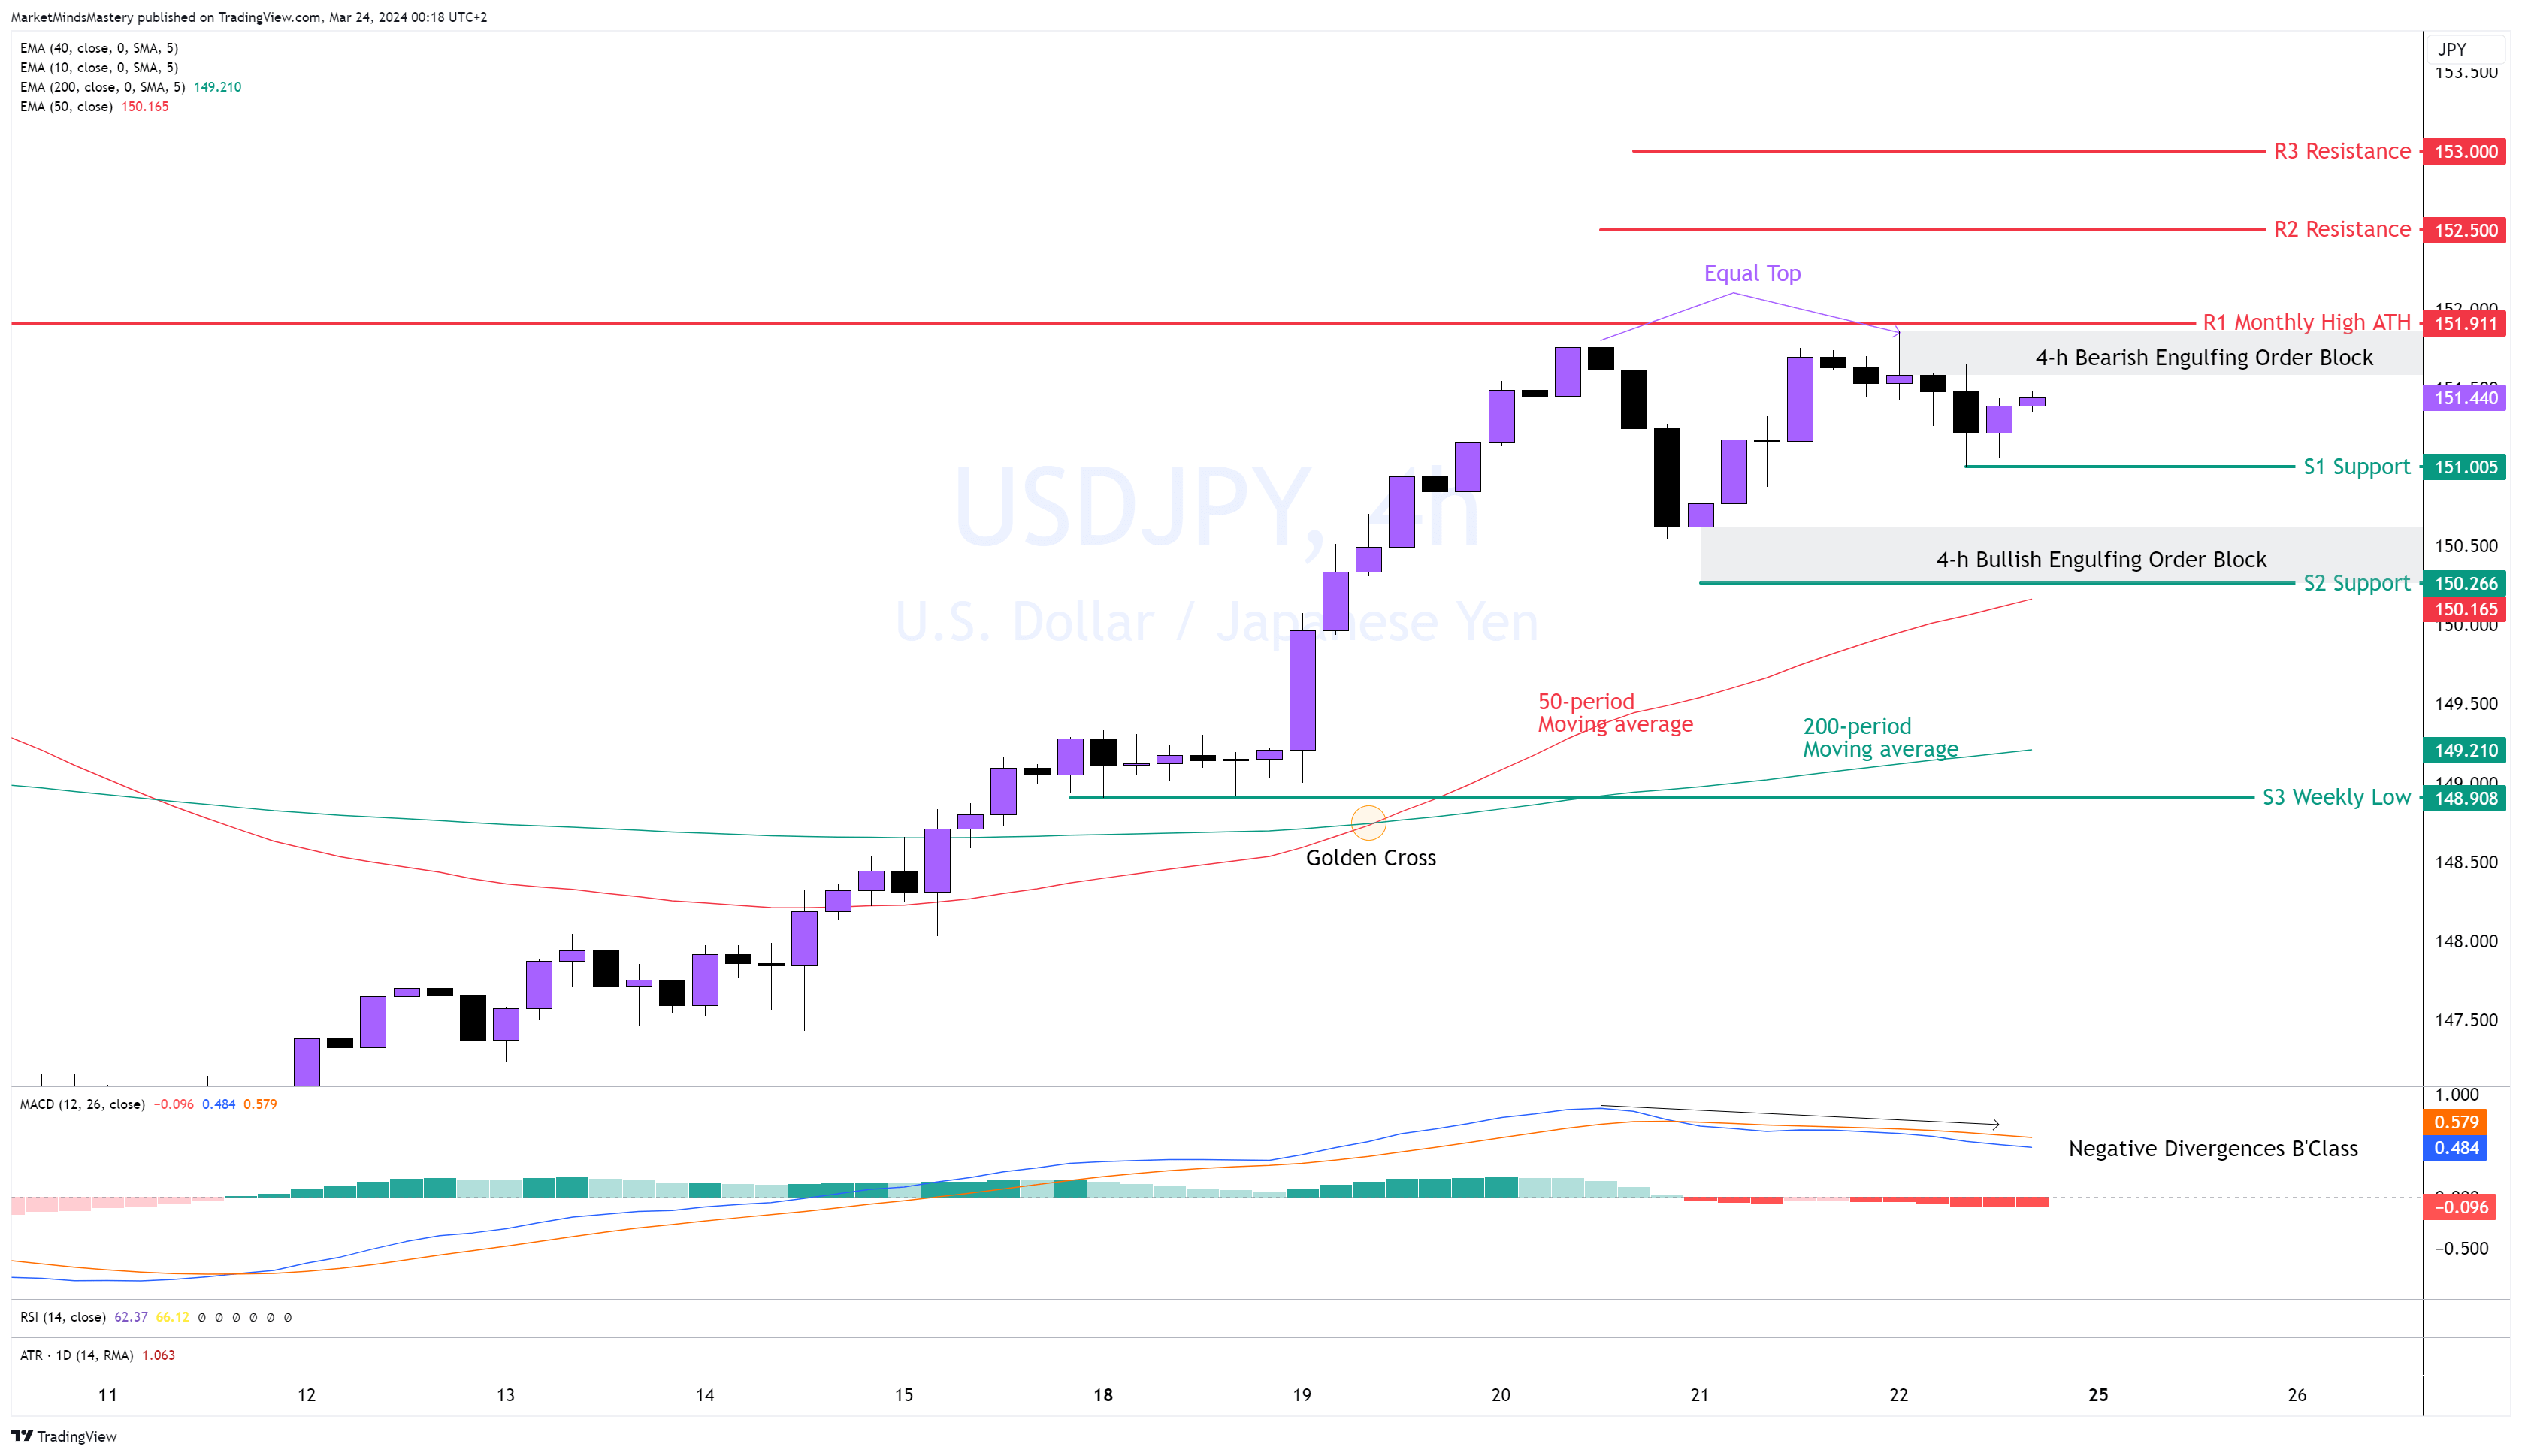
USD JPY 4H
The price action at the end of the previous week created an Equal High (not a Double Top yet) formation last Friday. The significance is the formation's price level falsely breaks above the ATH. The price was rejected and moved away from the level. The MACD printed Negative Divergences B’class while the price tried for a new ATH, indicating that the price could enter into a corrective phase. As the 50-period is above the 200-period moving average, indicating a bullish market, and the price didn't create a downtrend, we can only assume a price retracement at this stage. If the price moves downwards, the first support, S1, is the area around 151.
A close under the S1 and a move lower will lead to the next significant price level, S2, at approximately 150.266. A double-top reversal pattern will only be present if the price breaks below it and moves away from the S2.
Conversely, if the price rallies, it will retest the R1 high at around 151.91. A close above it and a move higher will lead the price to the next resistance area, R2, around 152.500.
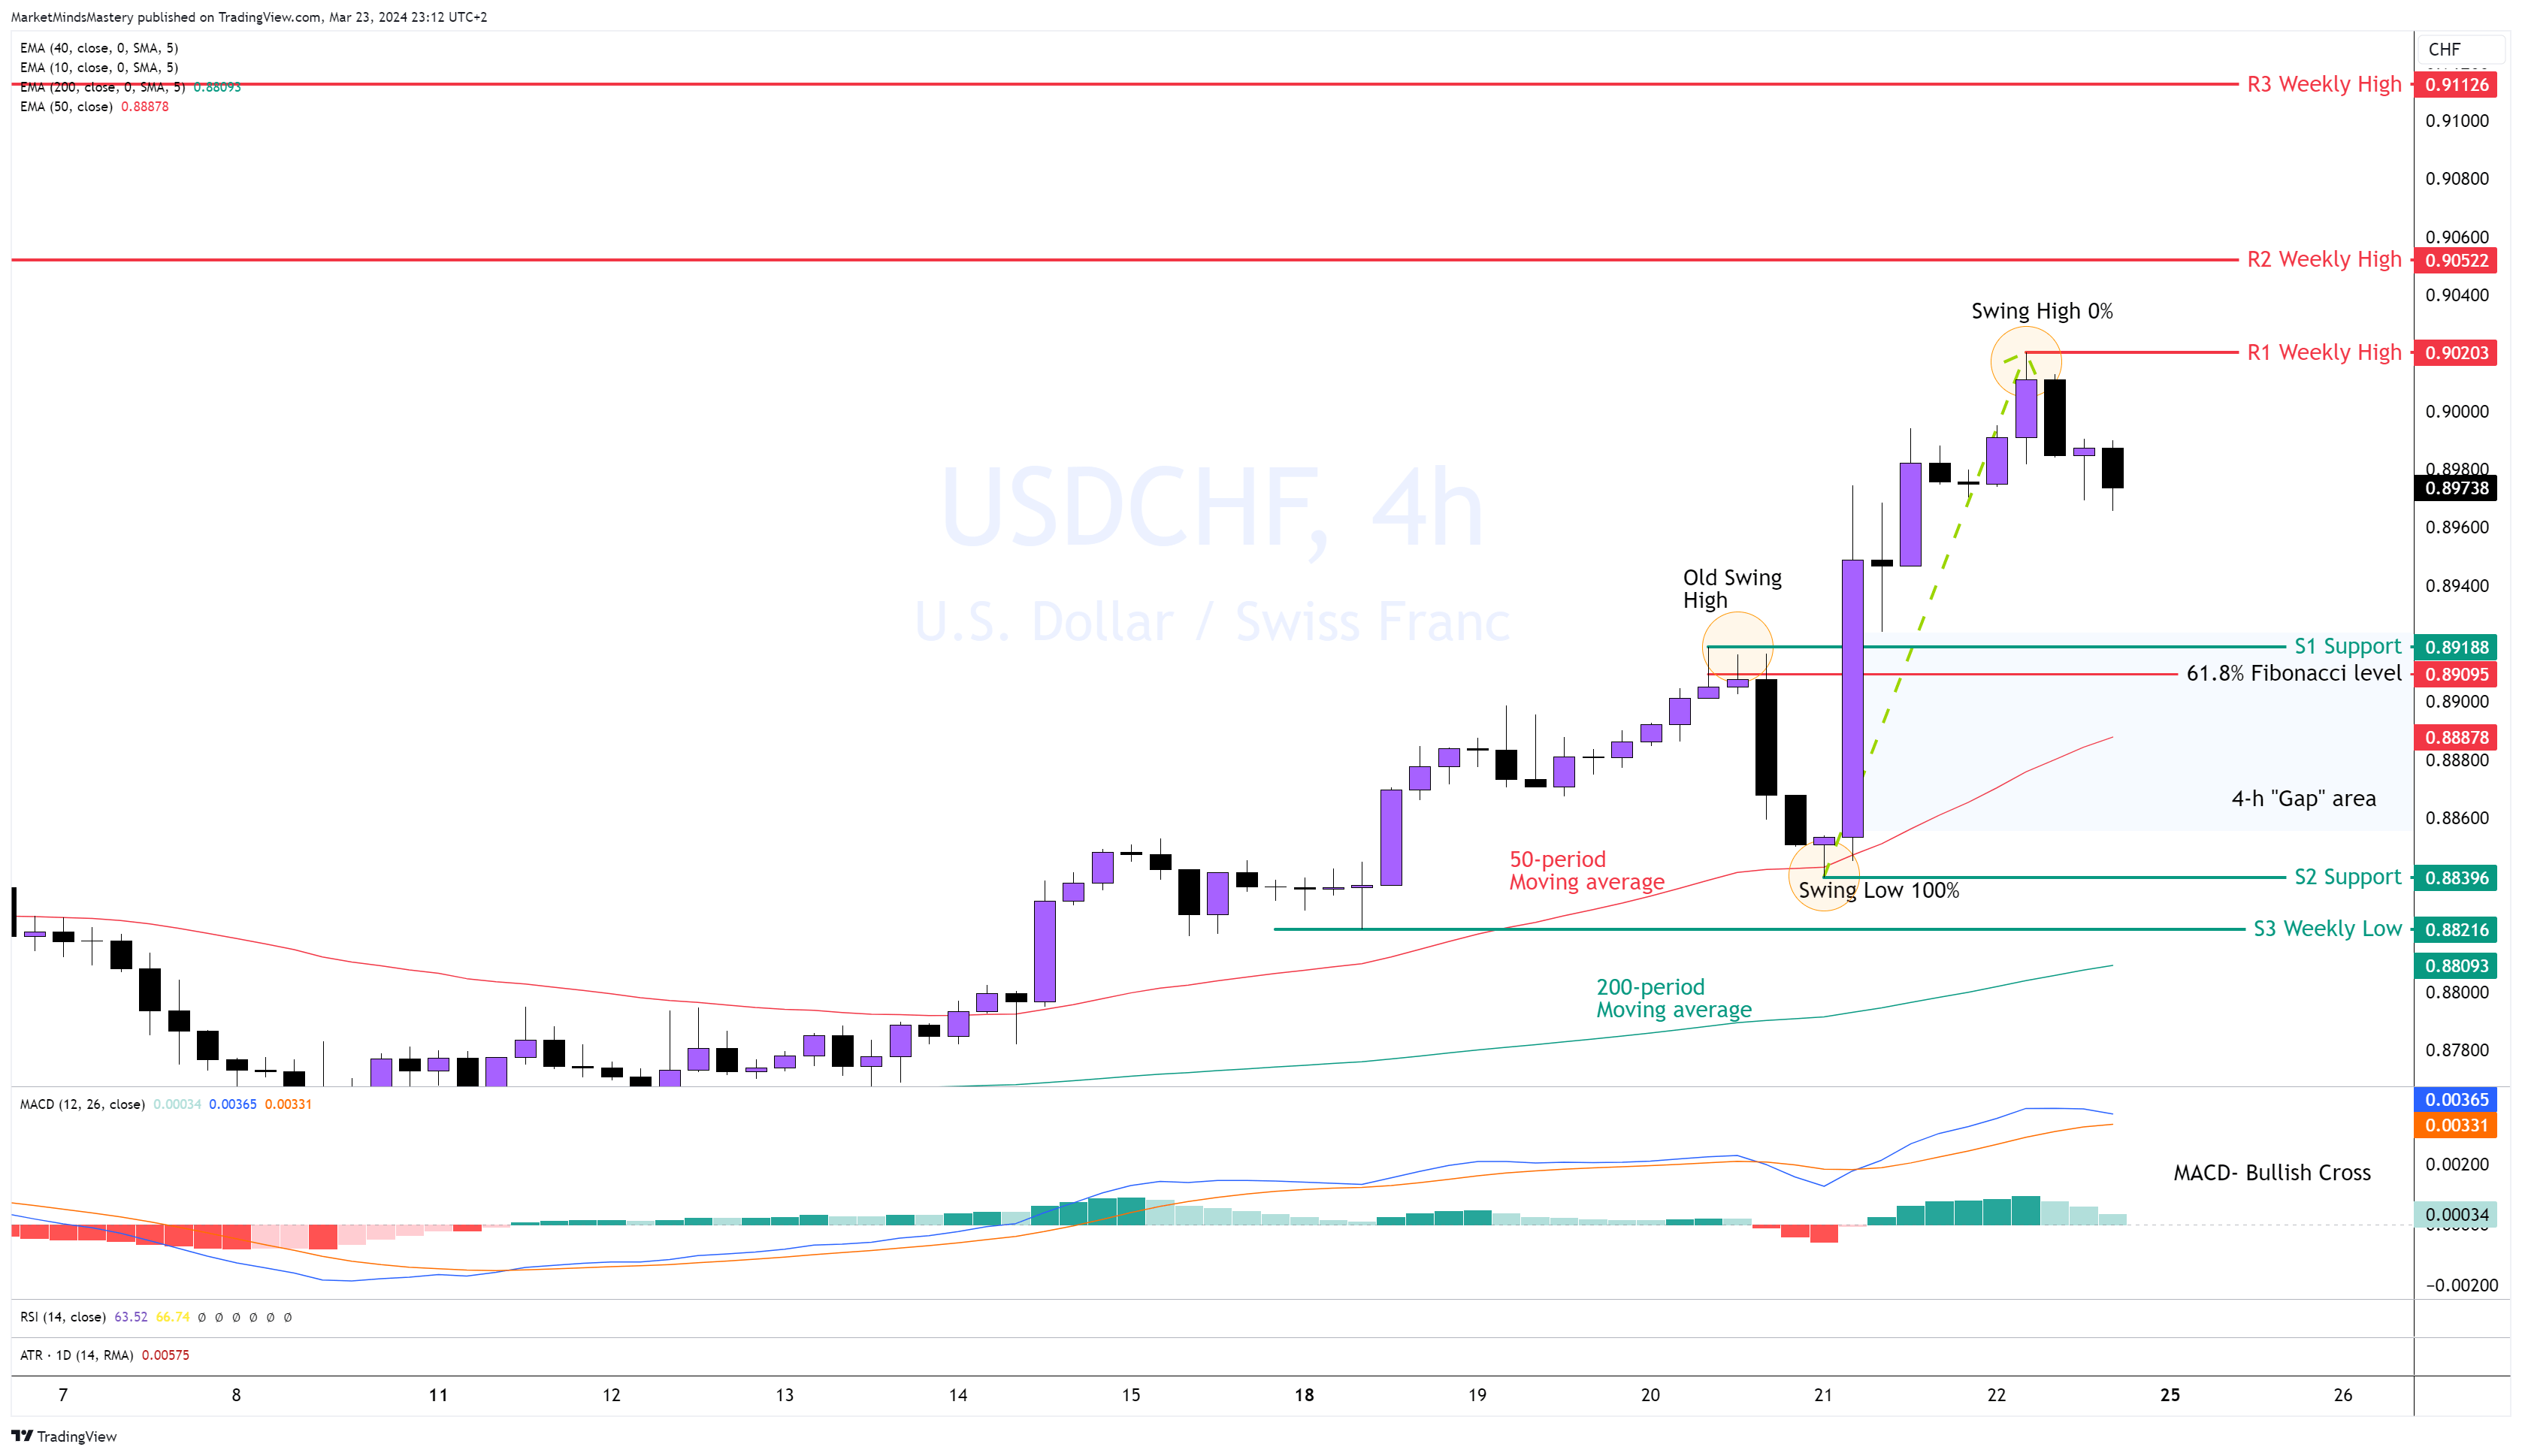
USD CHF 4H
The Interest Rate drop in Switzerland helped the USD CHF to climb higher and create a robust, impulsive upward move. The price made a higher high and higher low formation, indicating a bullish market. The MACD line crossed above the signal line, and they are above zero, indicating a bullish market. The 50-period is above the 200-period moving average, indicating a strong bullish market. The price entered a corrective phase, as per the minor break of market structure, and if it continues to move downwards, the first support area, S1, will be around 0.89188.
This level consists of the 61.8% Fibonacci retracement and the broken swing high (shown as an “old” swing on the chart). If the price decisively penetrates the S1 and declines further, the 4-h “Gap” area may be filled, and the price can move to the next support area, S2, at around 0.88396.
On the other hand, if the price finds support around 61.8% and bounces off and moves upwards, the first resistance area, R1, is approximately 0.9020. It is the previous week’s high. If the market continues its upward move, it must move above R1, and then the following resistance area, R2, is another weekly high, approximately 0.90522.
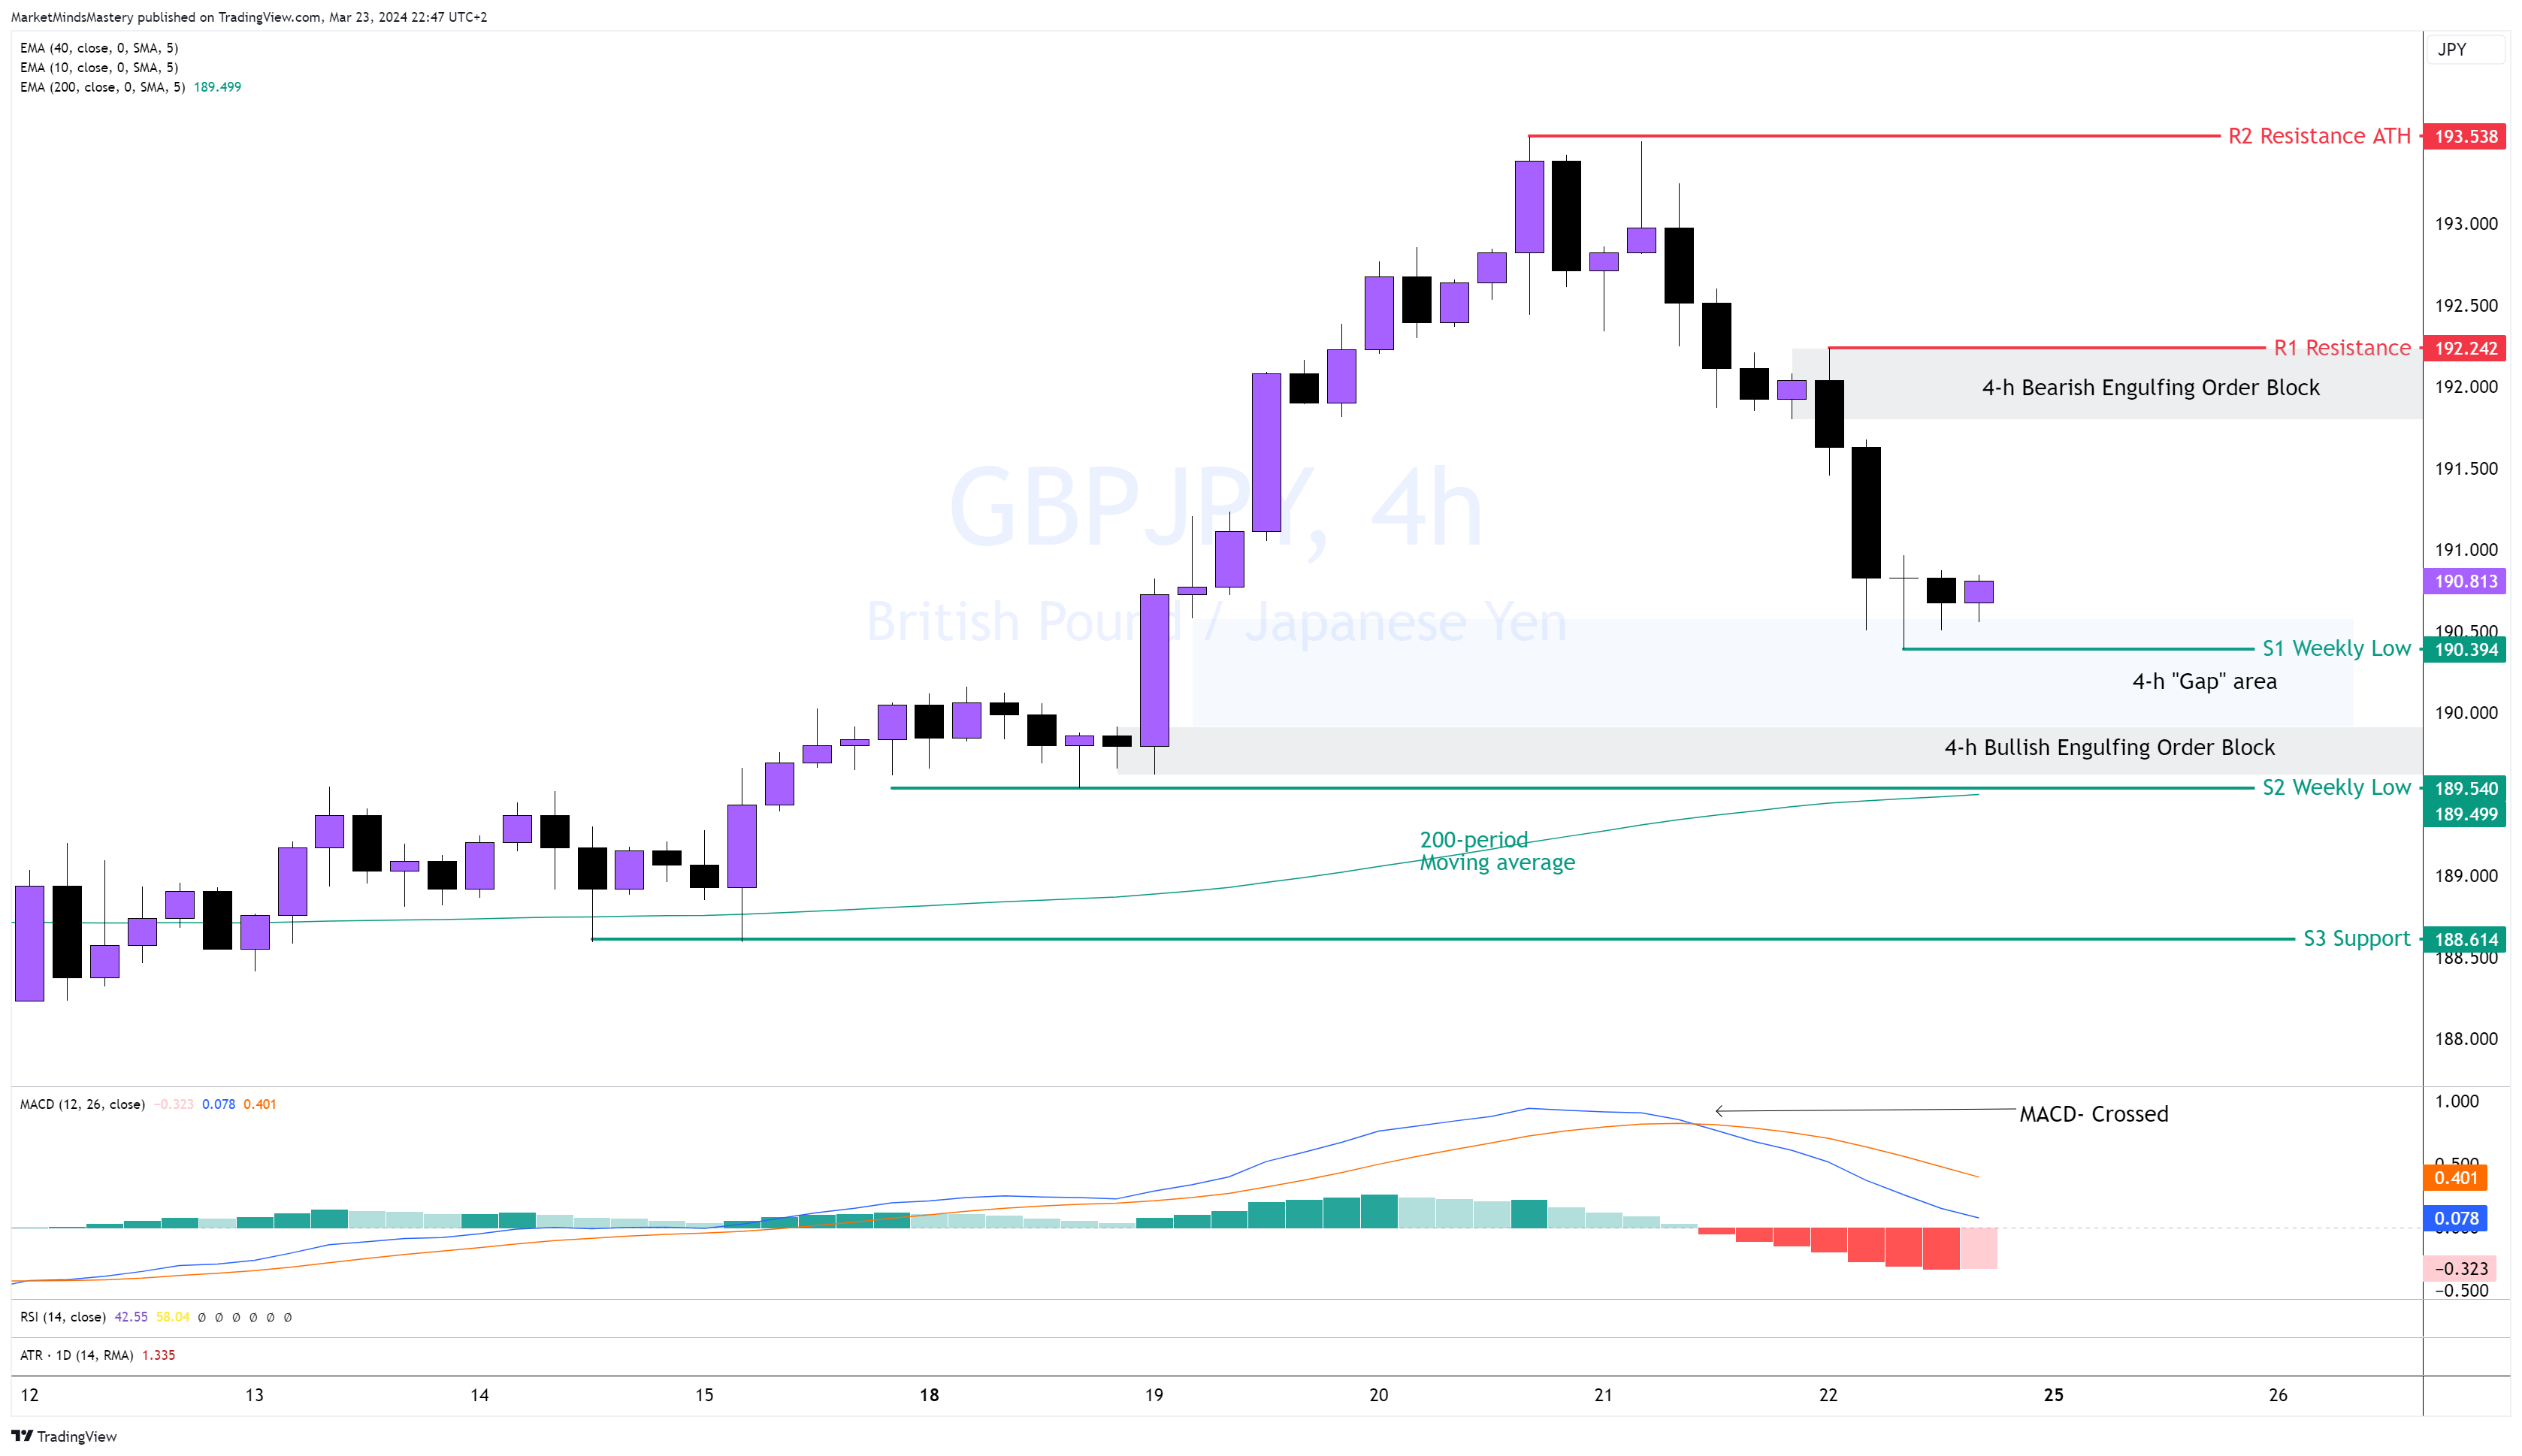
GBP JPY 4H
The Weekly Price Action from Bullish Hammer two weeks ago to Bearish Shooting Star the previous week shows a market that is out of sync. Towards the end of the last week, the price reversed almost 85% of its upward move, indicating weak bullish activity. However, the price still trades above the 200-period moving average, which means a bullish market. The price maintains its bullish market structure as the recent swing low around the S2 hasn’t broken. The price fills up the “Gap” area, and if it finds support and bounces off, it can move upwards until the first resistance area, R1, around 191.24. In this area, there is a Bearish Engulfing Order Block. If the R1 resistance doesn’t hold and the price penetrates it and moves upward, the next resistance area, R2, is the ATH around 193.53.
The MACD line has already crossed below the signal line while it is above the zero line, which is a bearish indication. Therefore, if the price declines, the first support area, S1, will be the previous week's low, around 190.39. If the price declines further and closes below the S1, the next support area, S2, will be around 189.54. A level consists of the S2 weekly low, the 4-h Bullish Engulfing Order Block, and the 200-period dynamic moving average. If the price also penetrates the S2, closes below it and moves downwards, the next support, S3, is around 188.61.
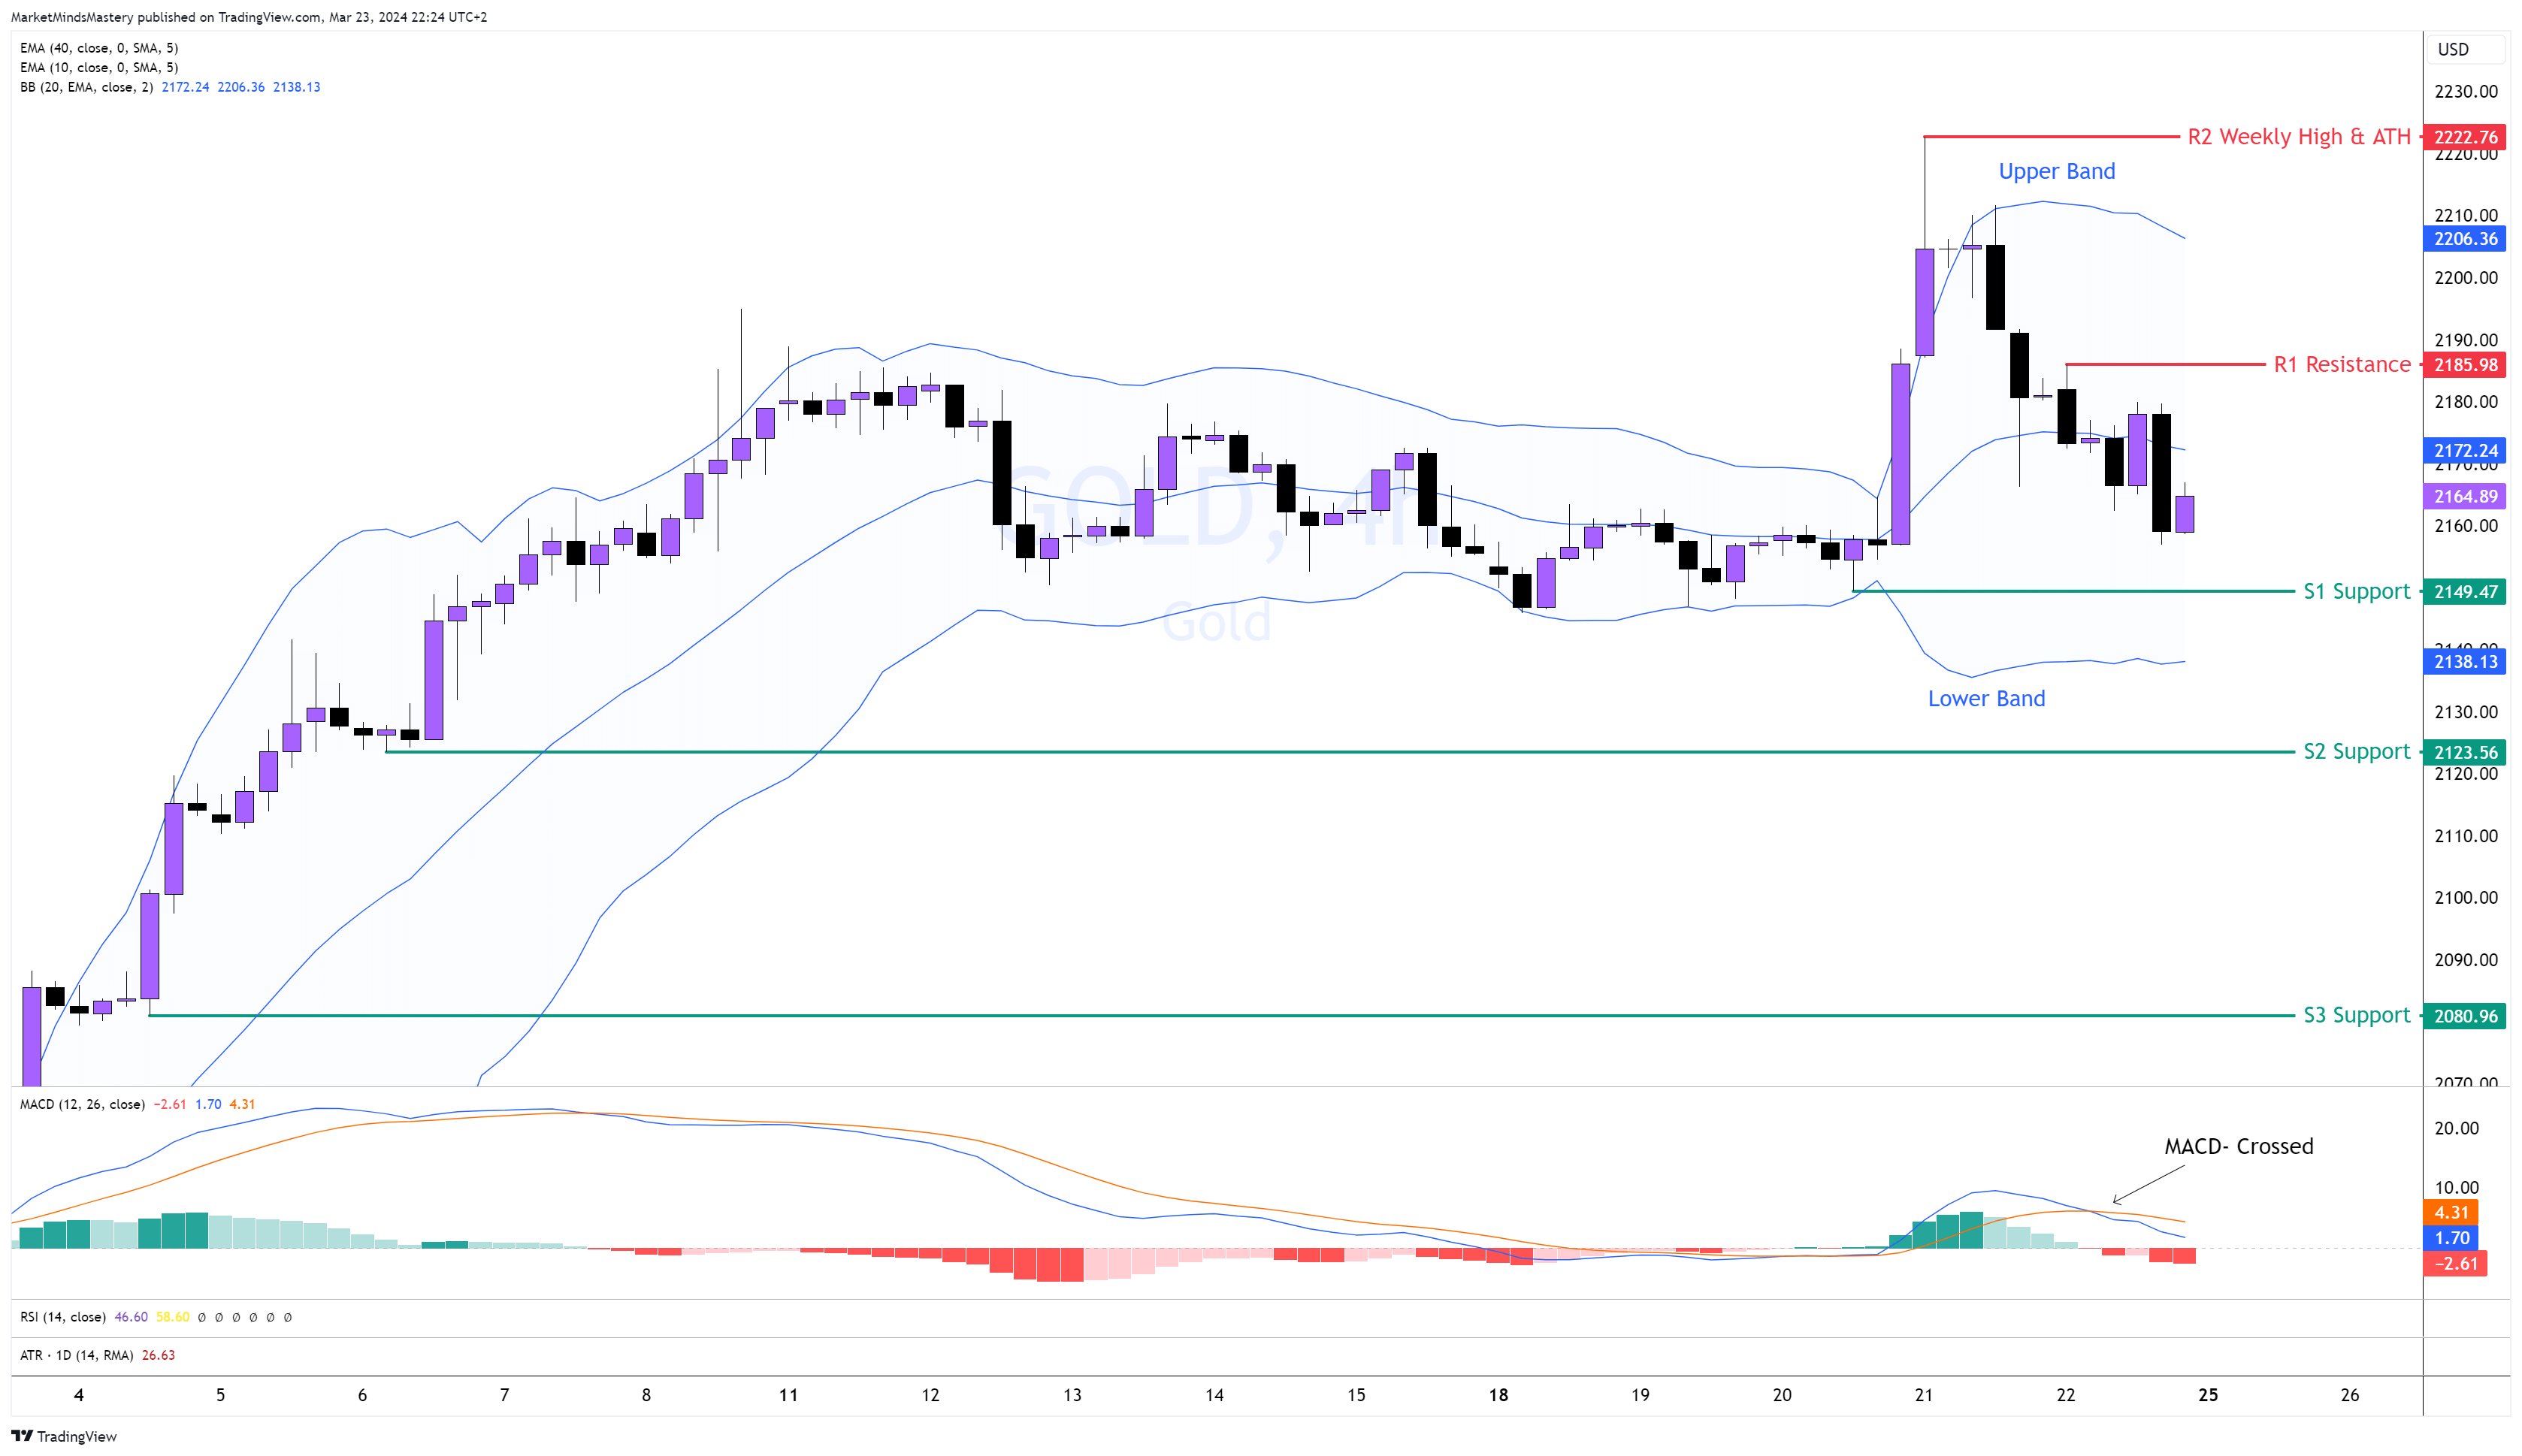
GOLD, 4H
Last Wednesday, after the FED announced the Interest Rates in the US reaming at their current rate, 5.5%, the Gold Price Exploded to the upside, creating a new ATH (All-Time High) around $2222. By the end of the week, the price retraced 100% of its upward move and rested around $2160. The weekly chart shows a Shooting Star Price Action, which is bearish. The price didn't maintain a higher high and higher low formation, which the buyers identified as a weakness to sustain bullish momentum.
The MACD crossed above the zero line, which is a bearish indication. The Upper and Lower Bands move parallel, indicating a market in equilibrium, with the current price trading below the 20-period moving average. Therefore, if the price continues falling, the first support, S1, is approximately $2149. If the price closes under S1 and moves downwards, the next support area, S2, is roughly $2123.
On the contrary, if the price bounces off and moves upwards, the first resistance area, R1, is around $2185. A move higher than that will find the next resistance area, R2, around $2222, the ATH.
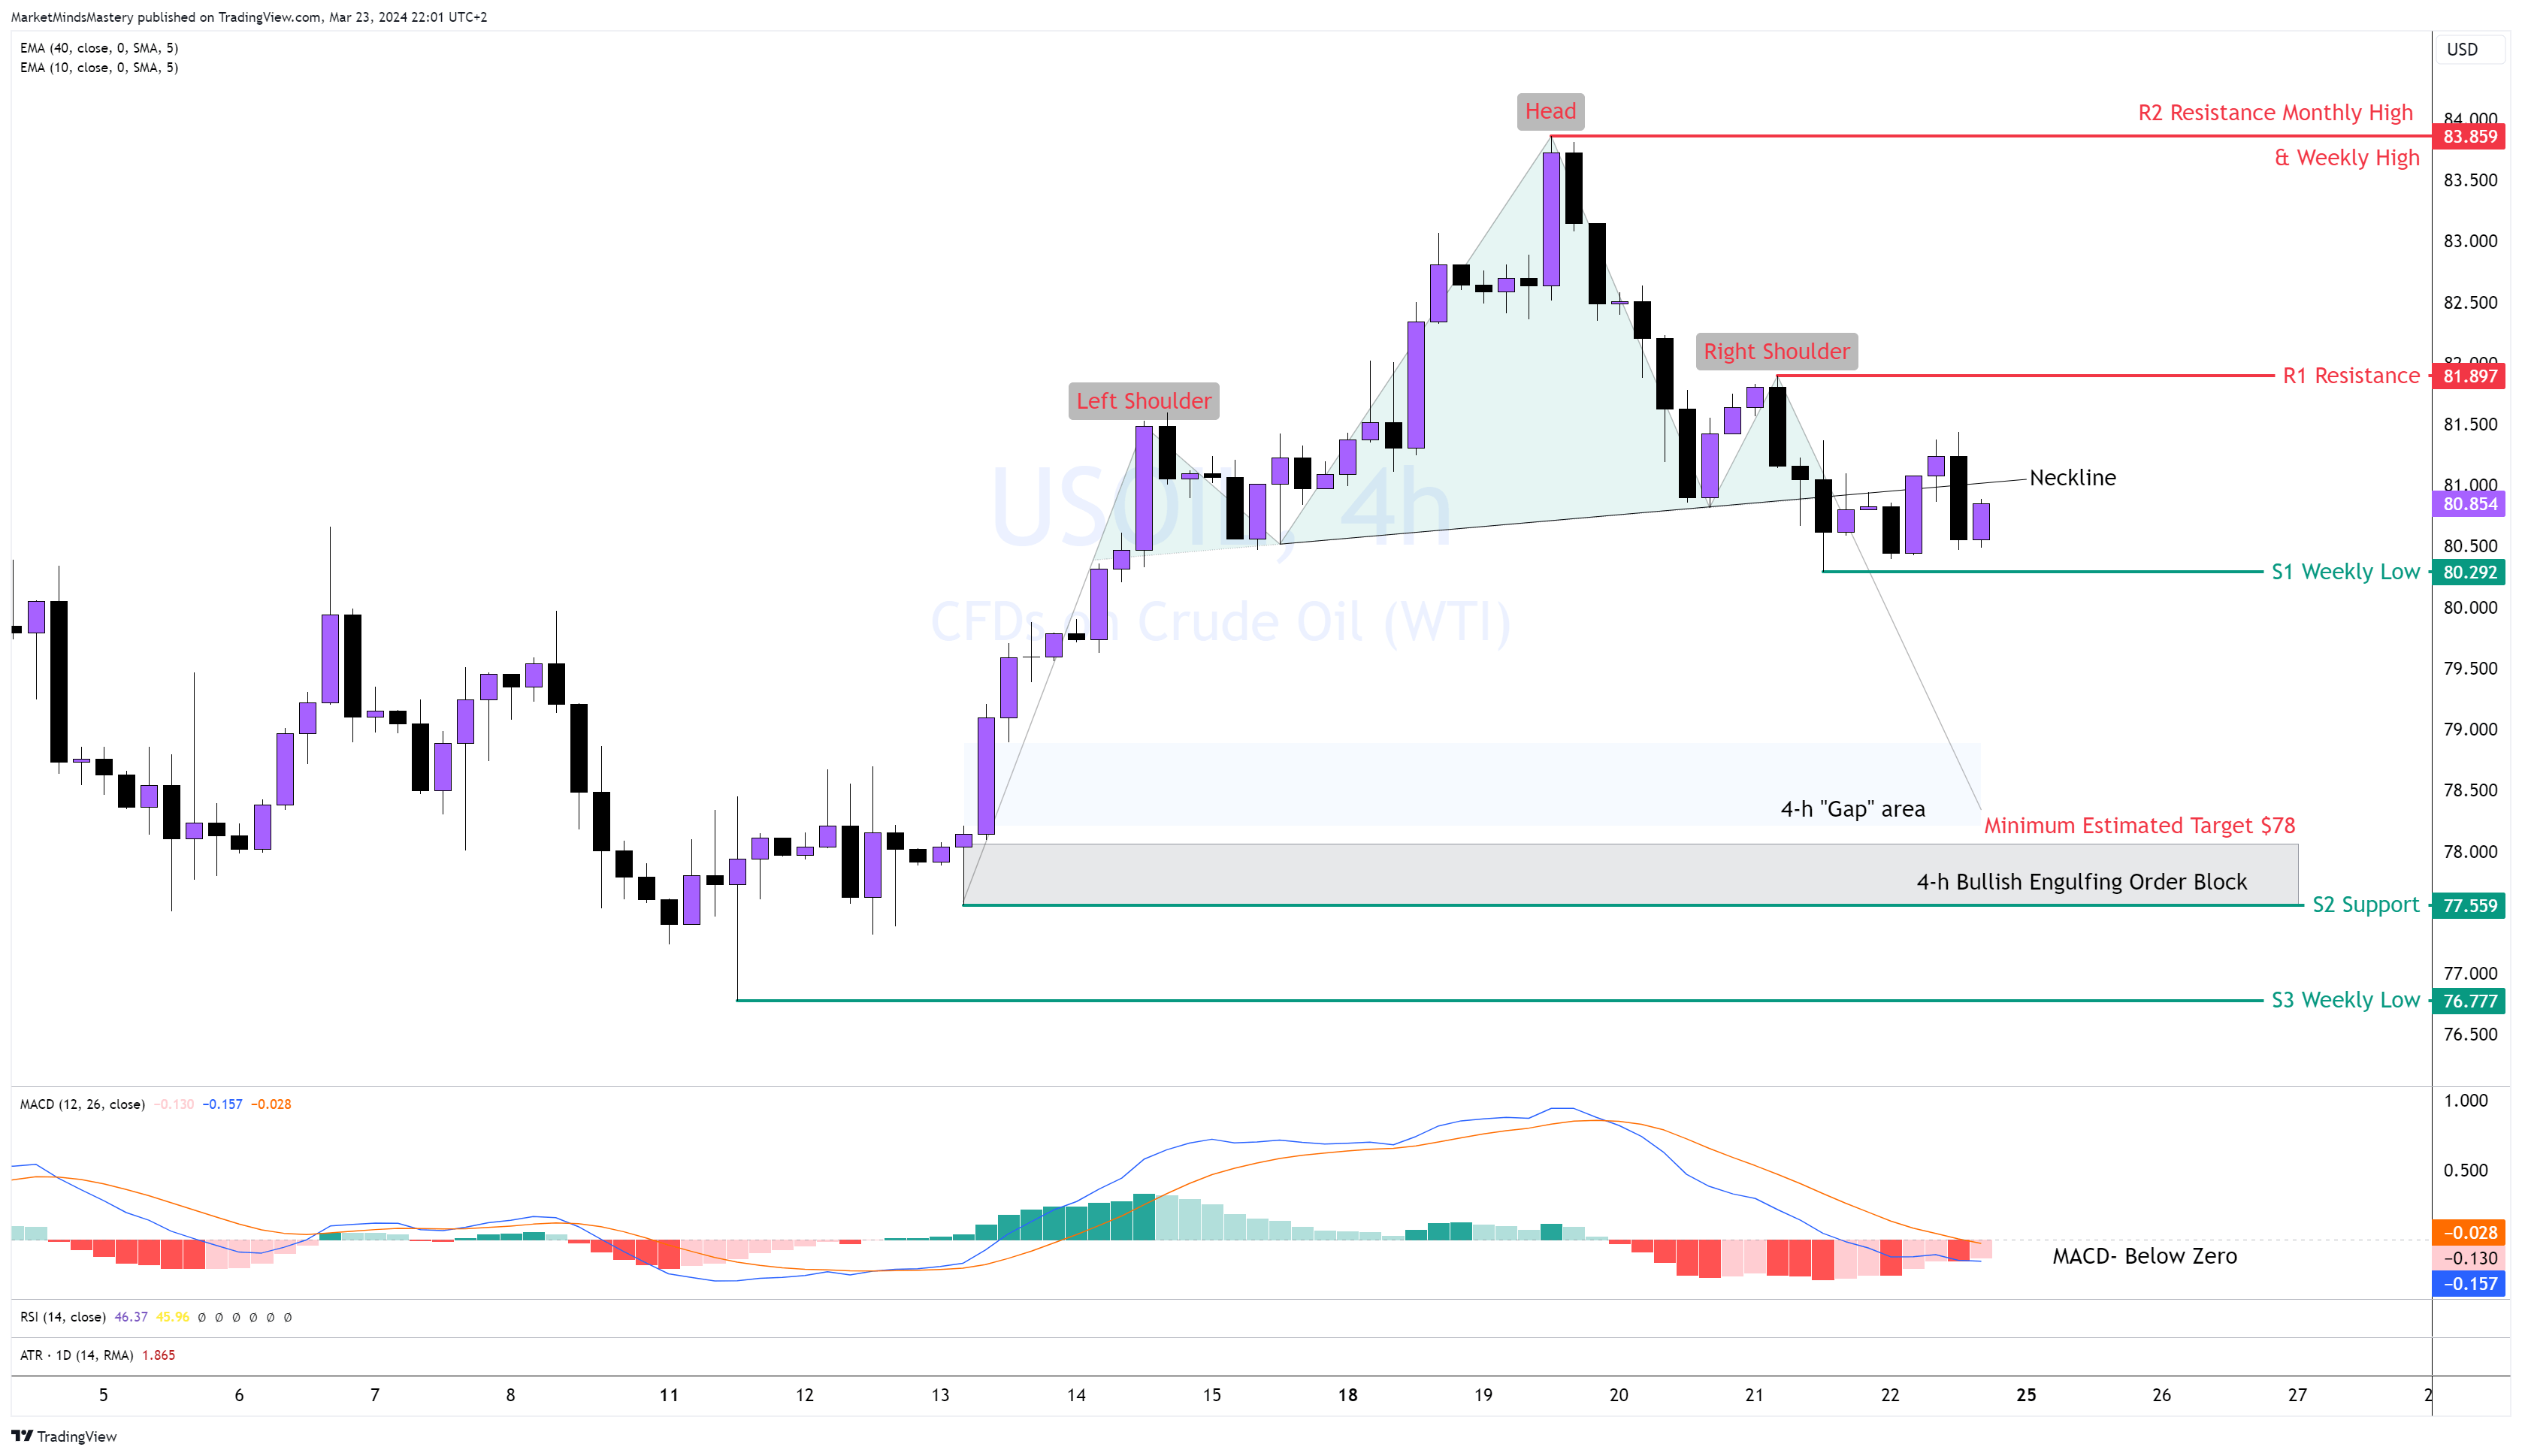
US OIL, 4H
Following the upward move, the US OIl on the 4H chart reached the Monthly high of around $83.57 and declined. The Weekly chart formed a Gravestone Doji Price Action while rejecting the monthly resistance. As per the candlesticks patterns, it has bearish implications. The MACD crossed below the zero line, which also indicated bearishness. The 4-h chart created a Head and Shoulder reversal pattern with bearish implications. All traders need to pay attention to signs of failure of the H&S. If accumulation builds around the S1 weekly low and the price doesn’t break on a heavy volume below the S1, the pattern may fail.
Currently, the price trades below the neckline, and if it continues to move downwards, the first support is the S1, which is around $80.29, the previous week’s low. If the price breaks below the S1 and moves lower, the next support, S2, is approximately $77.55. It is the area of the minimum target of the H&S patterns. This area hosts a Bullish Engulfing Order Block under the “Gap.” It makes it an attractive trading spot. On the other hand, if the H&S pattern fails and the price advances, the first resistance area, R1, is approximately $81.89. If it continues to move upwards, the next resistance, R2, is around 83.85.
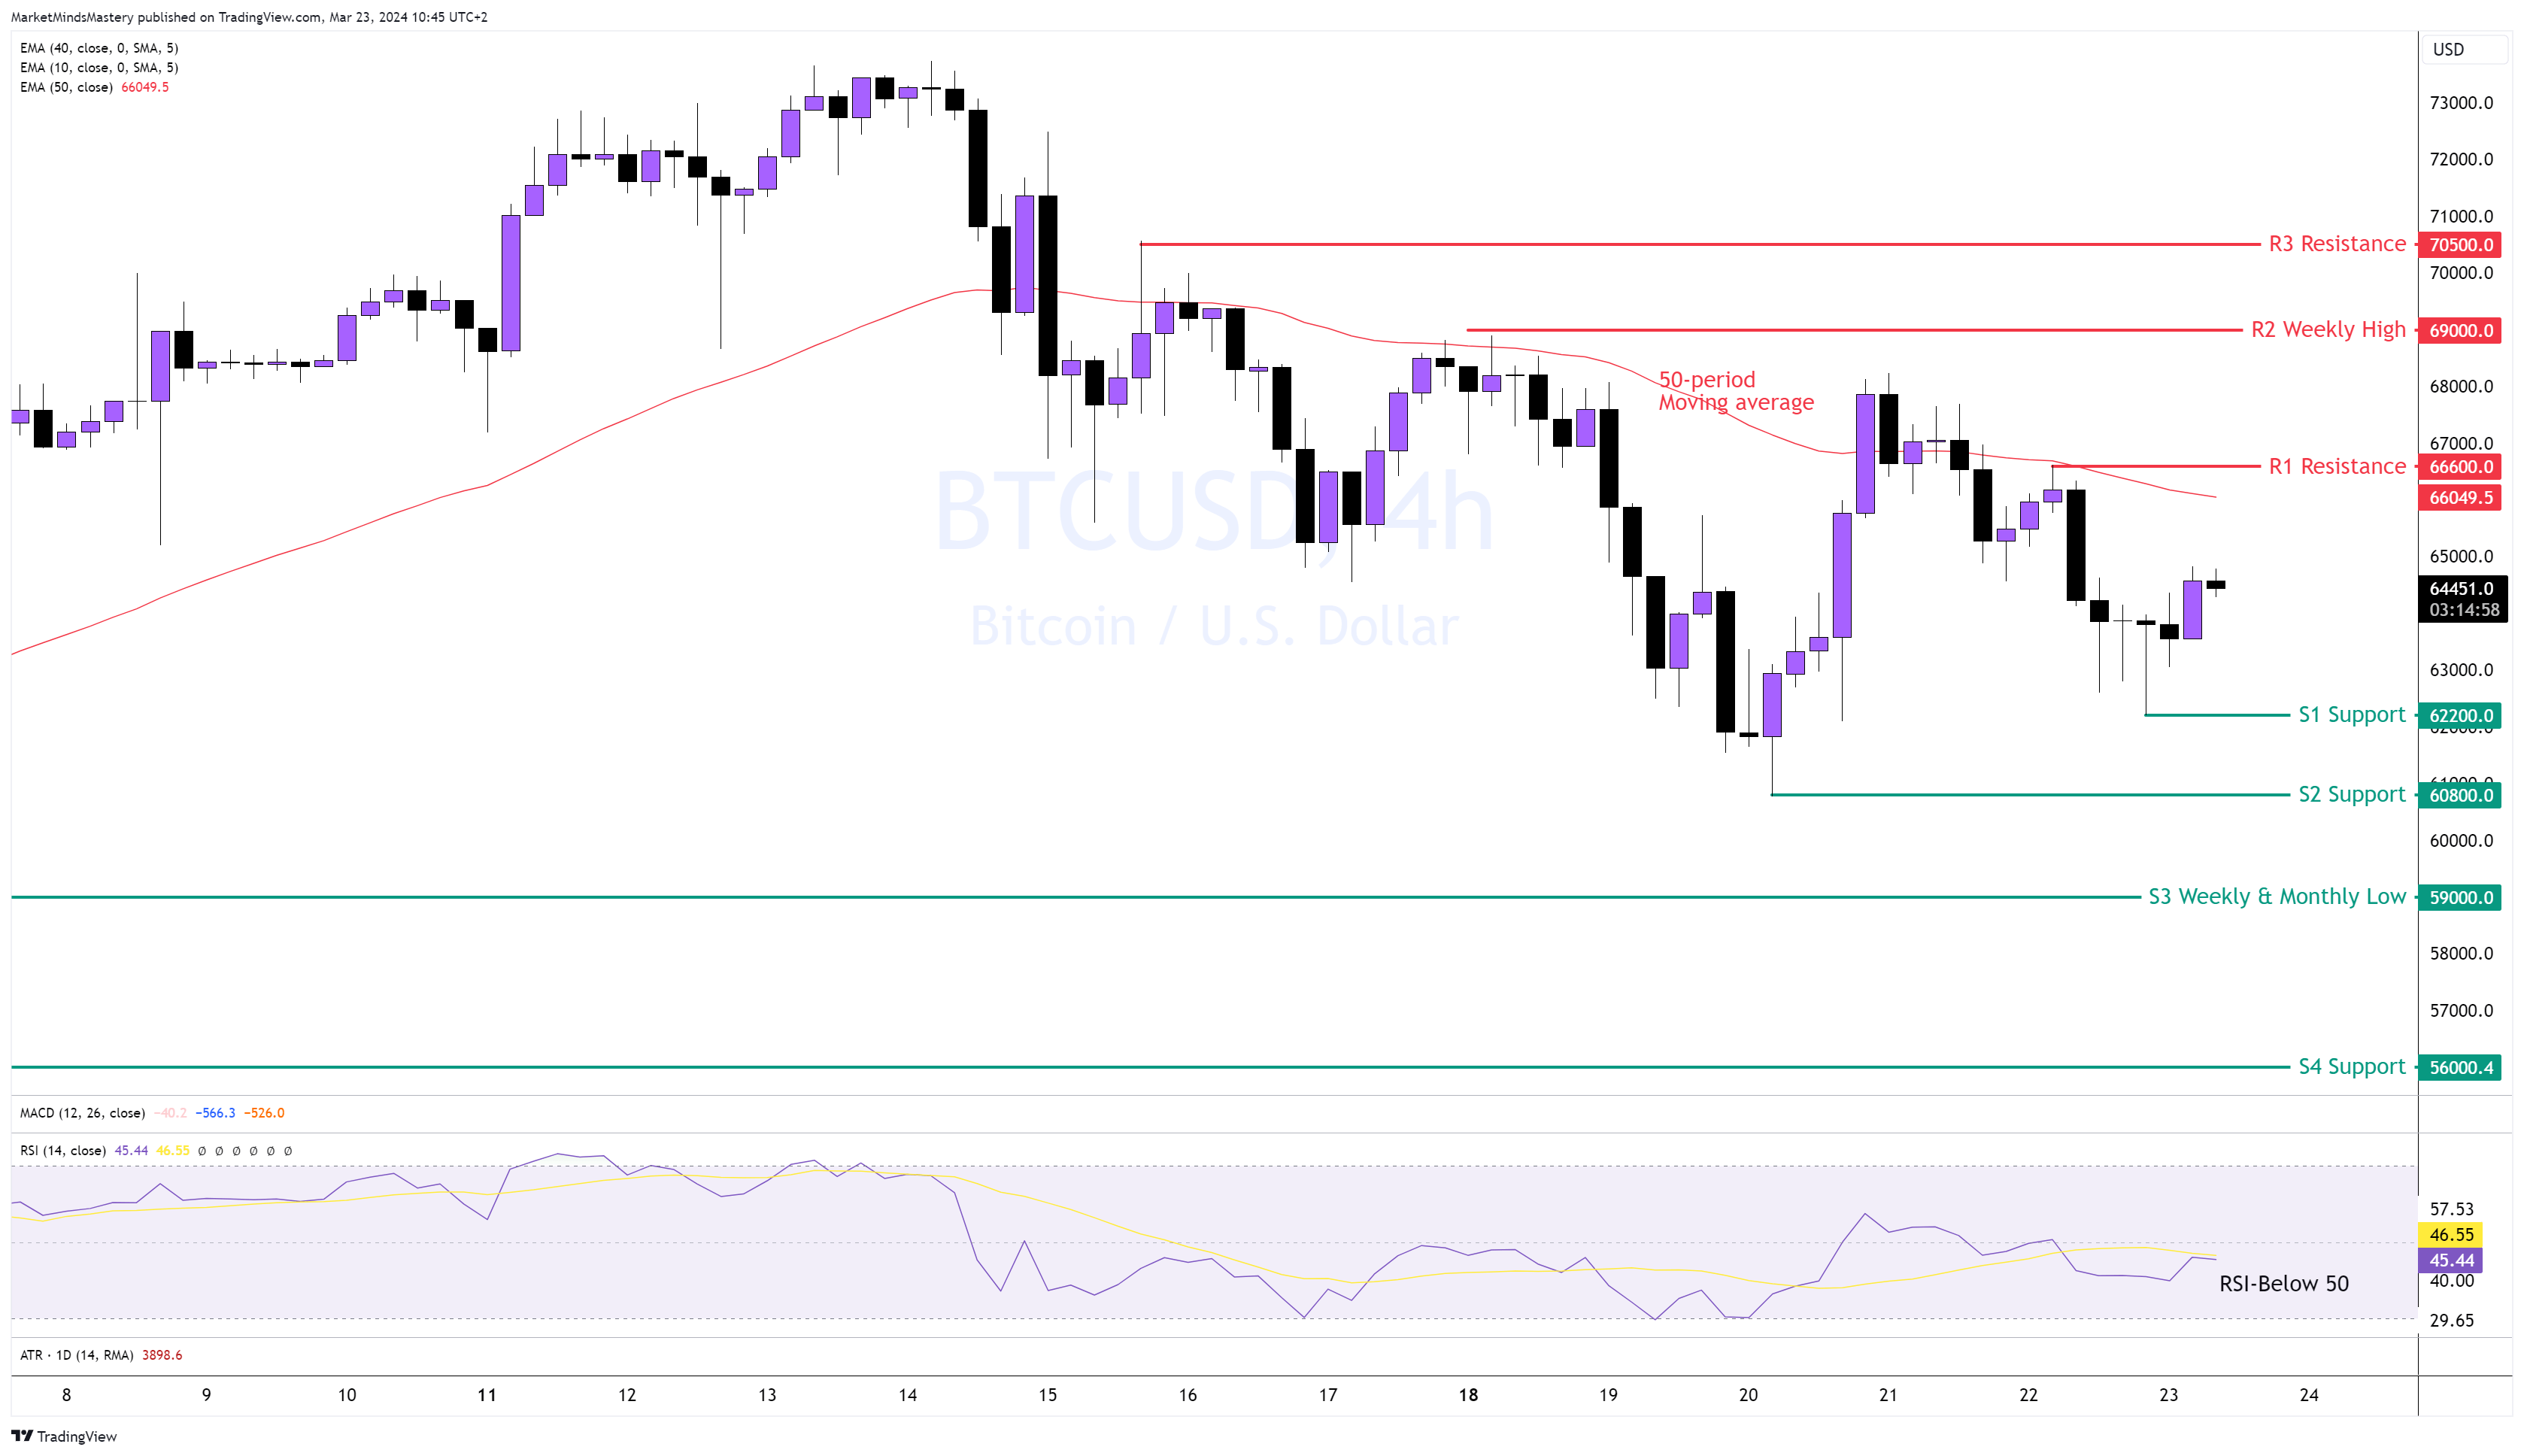
BTC USD, 4H
Following the successful bounce off the Bullish engulfing’s Order Block based on last week’s analysis, the price moved away from the area of $61000. The price tried to create a new high above $61000 but failed, and it closed below the 50-period moving average, indicating a bearish bias. Additionally, the price is still under the lower highs and lower lows on the 4-h chart, and the RSI is trading below 50, indicating bearishness. Therefore, if the price continues to move downwards, the S1 support around $62200 will be the first support area. If the price penetrates it and declines further, the next support area, S2, is approximately $60800. If the price decisively penetrates S2 and trades under it, the next support area, S3, is around $59000.
On the contrary, if the price bounces off and moves upward, the 50-period moving average will act as a dynamic area of resistance currently found around the R1 at $66600. A rally above it leads to the next resistance area, R2, the $69000, which is last week’s high. If the price penetrates the R2, closes above it and moves upwards, it will enter the $70500 R3 resistance area.
SP 500, 4H
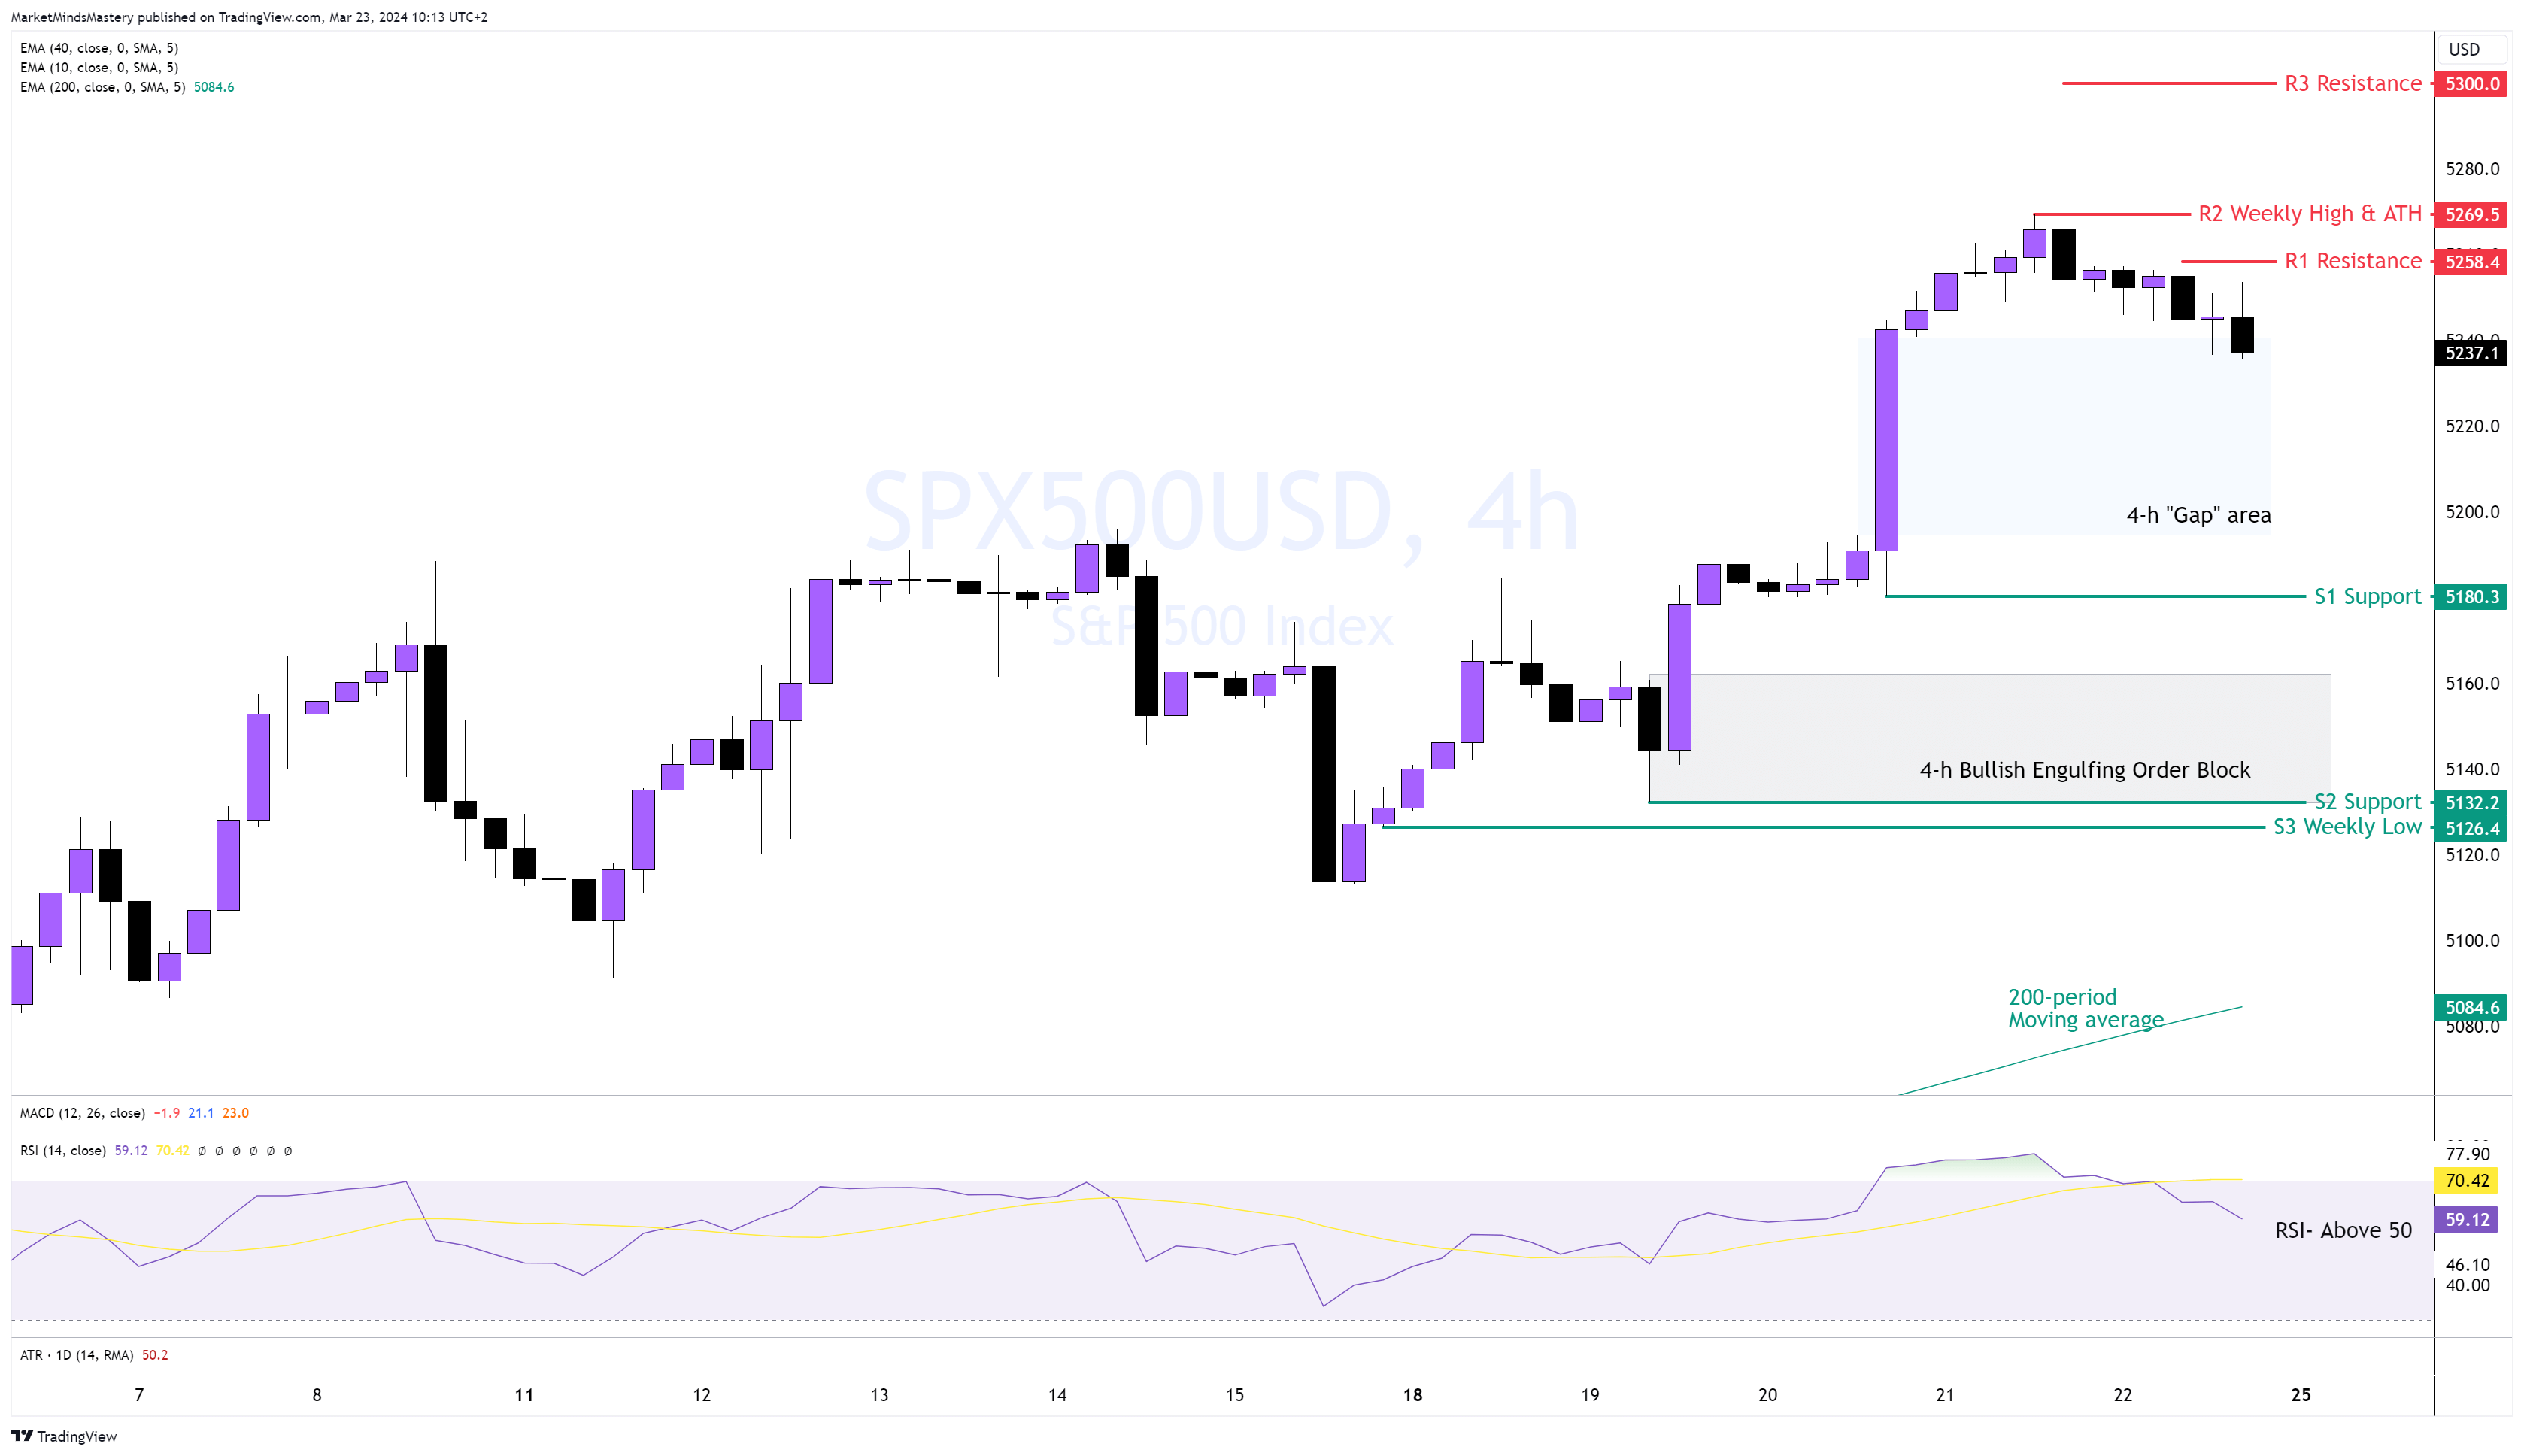
Following the successful bounce off the Bullish engulfing’s Order Block based on last week’s analysis, the price moved toward the Daily and Weekly charts and created a new All-Time High last Thursday. As we have often explained, the divergences between the price and the oscillator will first work for price correction and not necessarily for trend reversal. The price made a higher high and a higher low, which is the most important indication of an uptrending market in this timeframe.
The RSI oscillator's above 50 indicates a bullish market. The price is well above the 200-period moving average, which is also a strong bullish indication. The price entered a corrective phase toward the 4-h “Gap”. If the price continues to move downwards, the S1 support is the first area in the price that may be tested. If the price breaks below the S1 and declines further, it will enter into the well-defined 4-h Bullish Engulfing Order Block resting at the S2 support, which almost aligns with the S3 previous week’s low. Conversely, if the price moves upwards, the first resistance area, R1, is approximately 5258. A further upward move will find the price re-testing the R2, last week’s high, around 5269. An attempt for a new ATH(All-Time High) can lead to round 5300.
US 30, 4H
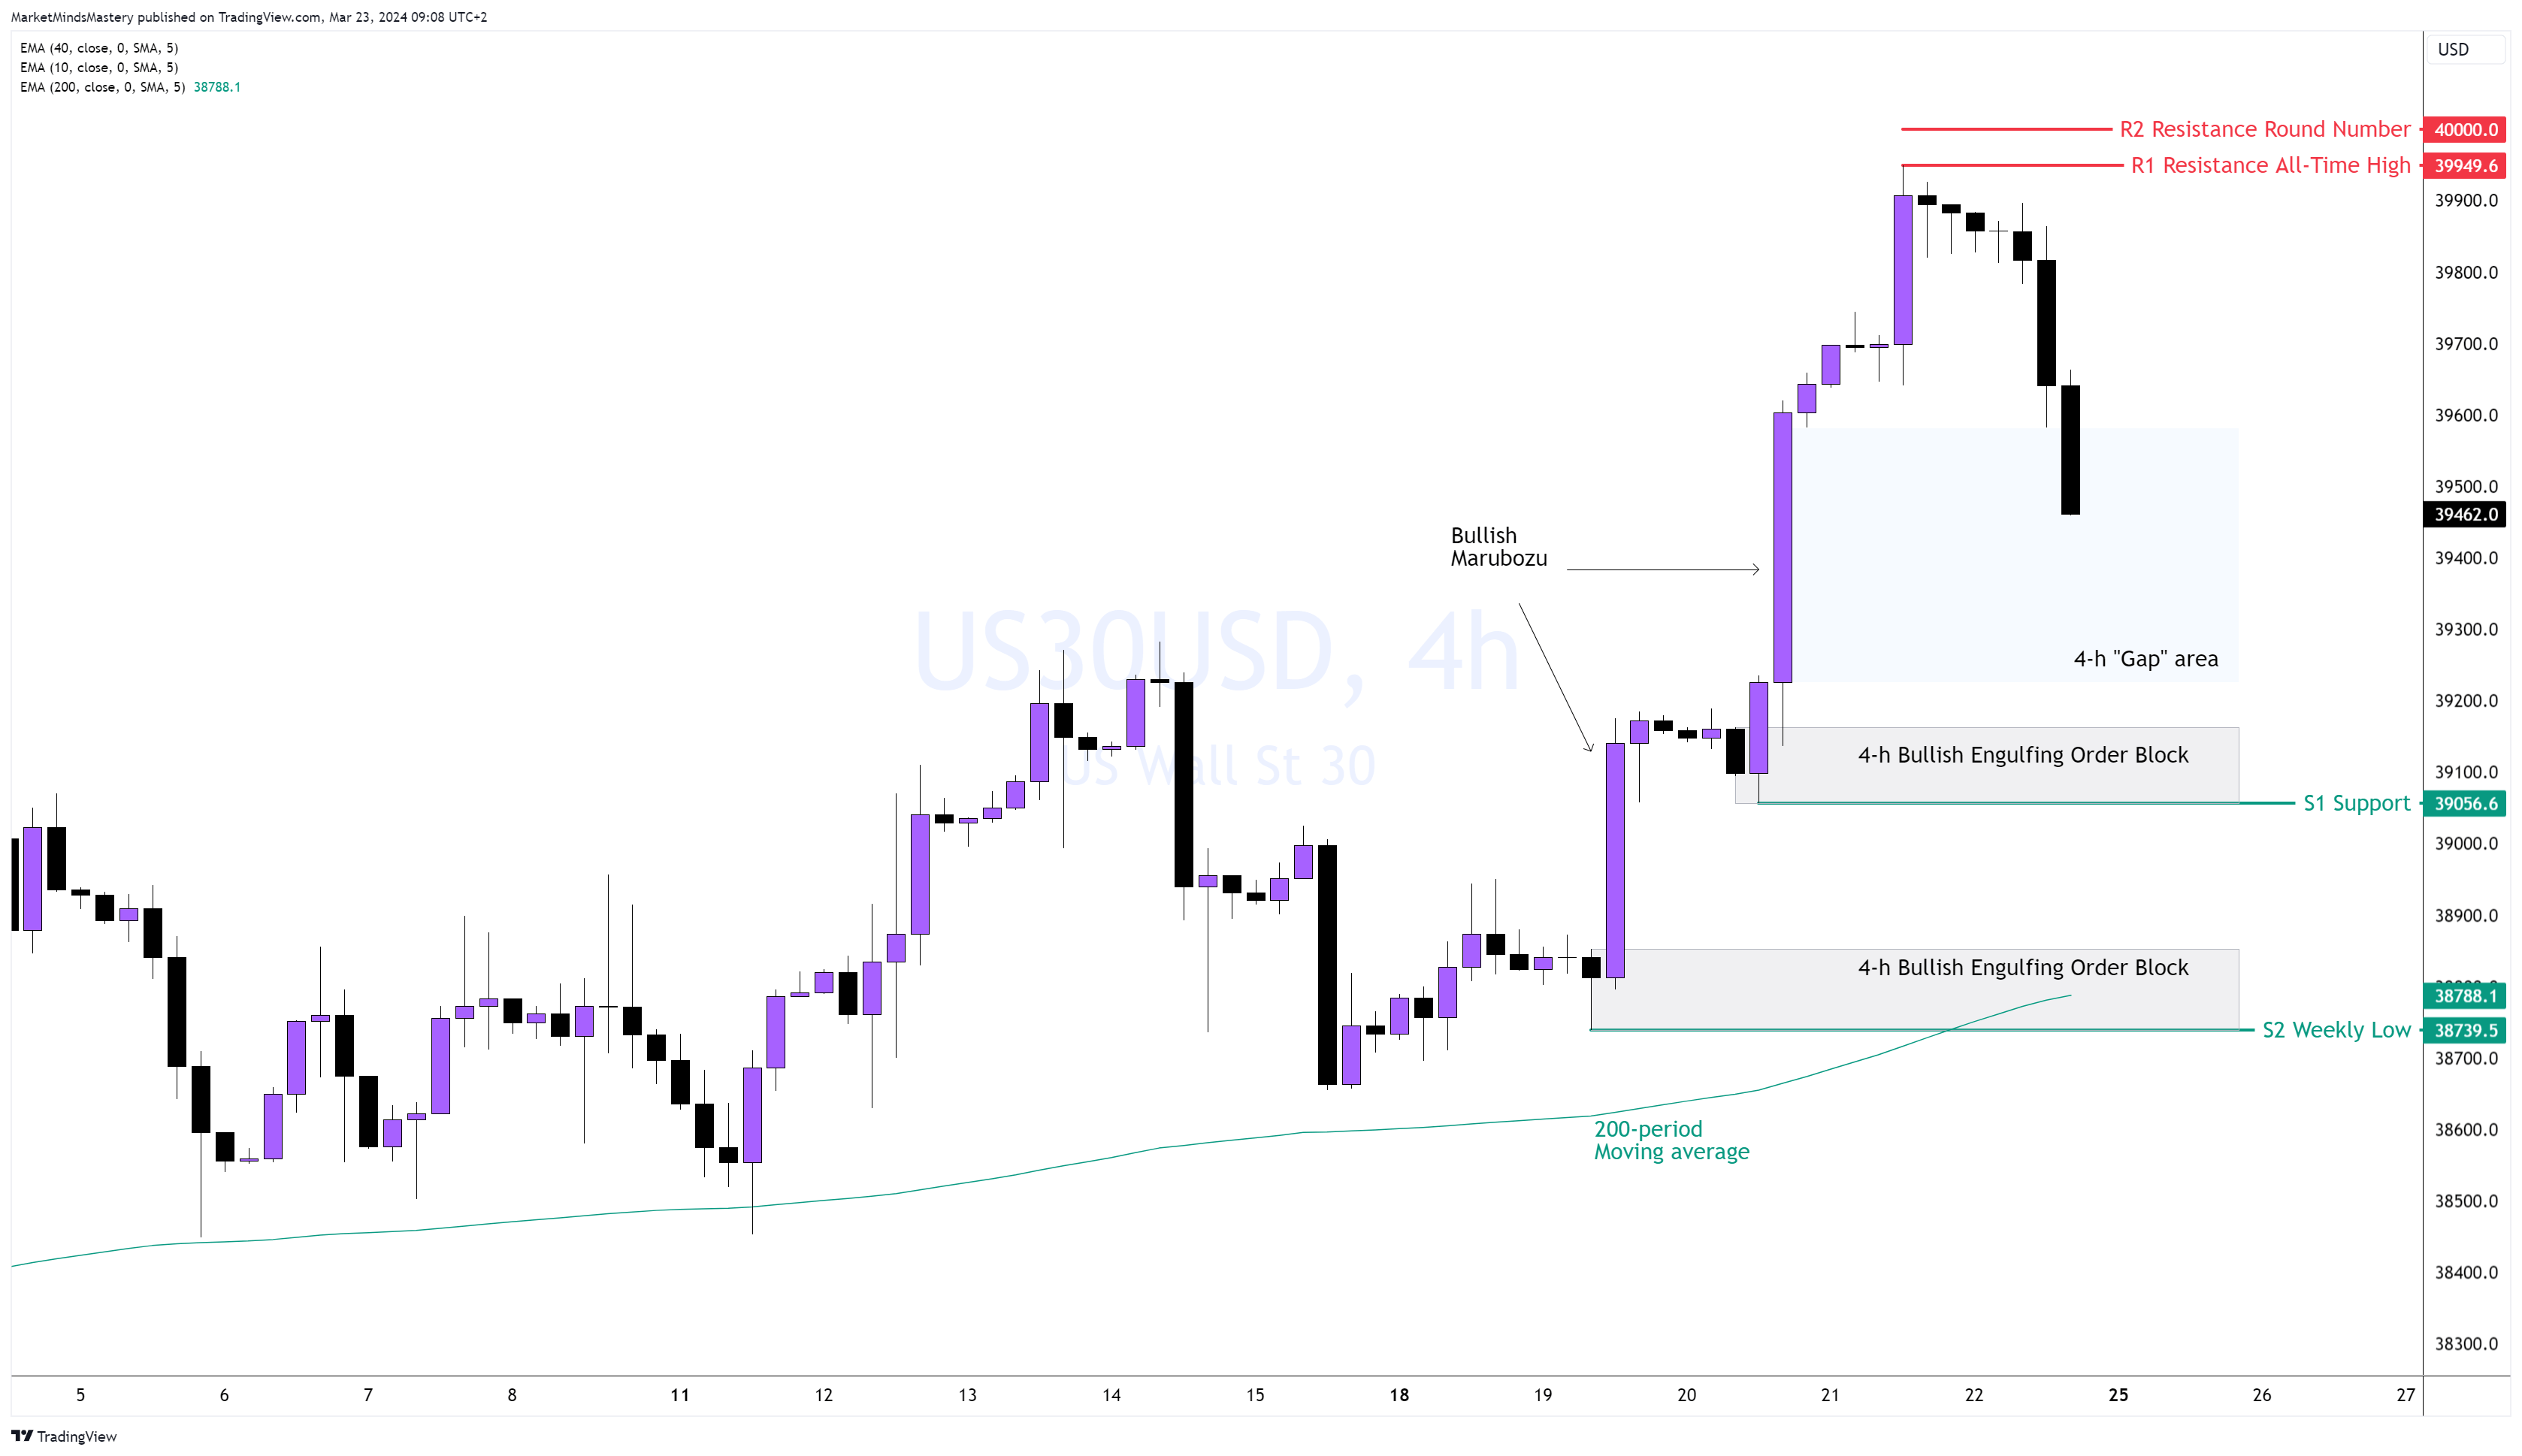
Following last week's dynamic upward move, created by two Bullish Marubozu candles, the US30 created a new All-Time High and slid below the 40000. A decline then occurred, and the price moved downwards last Friday.
The price is above the 200-period moving average, which is a bullish indication, and the RSI oscillator is above 50, which is also a bullish indication. Currently, the price trades within the 4-h “Gap” area. Suppose the price declines further to fill all the “Gap”. The first support area, S1, was founded around 39056. A Bullish Engulfing Order Block is resting at this level and hasn't been tested yet. If the price decisively penetrates the S1 and moves under it, the next support area, S2, is last week’s low, approximately 38788. At this level, there is a cluster of a Bullish Order Block and the 200-period moving average.
If the price bounces off and moves upward, the significant resistance is the R1, the All-Time High price of approximately 39949. If the price penetrates the R1 and moves higher, we will point to the R2 resistance as the 40000 because it is a round and essential number in the market.
GER 40 Daily
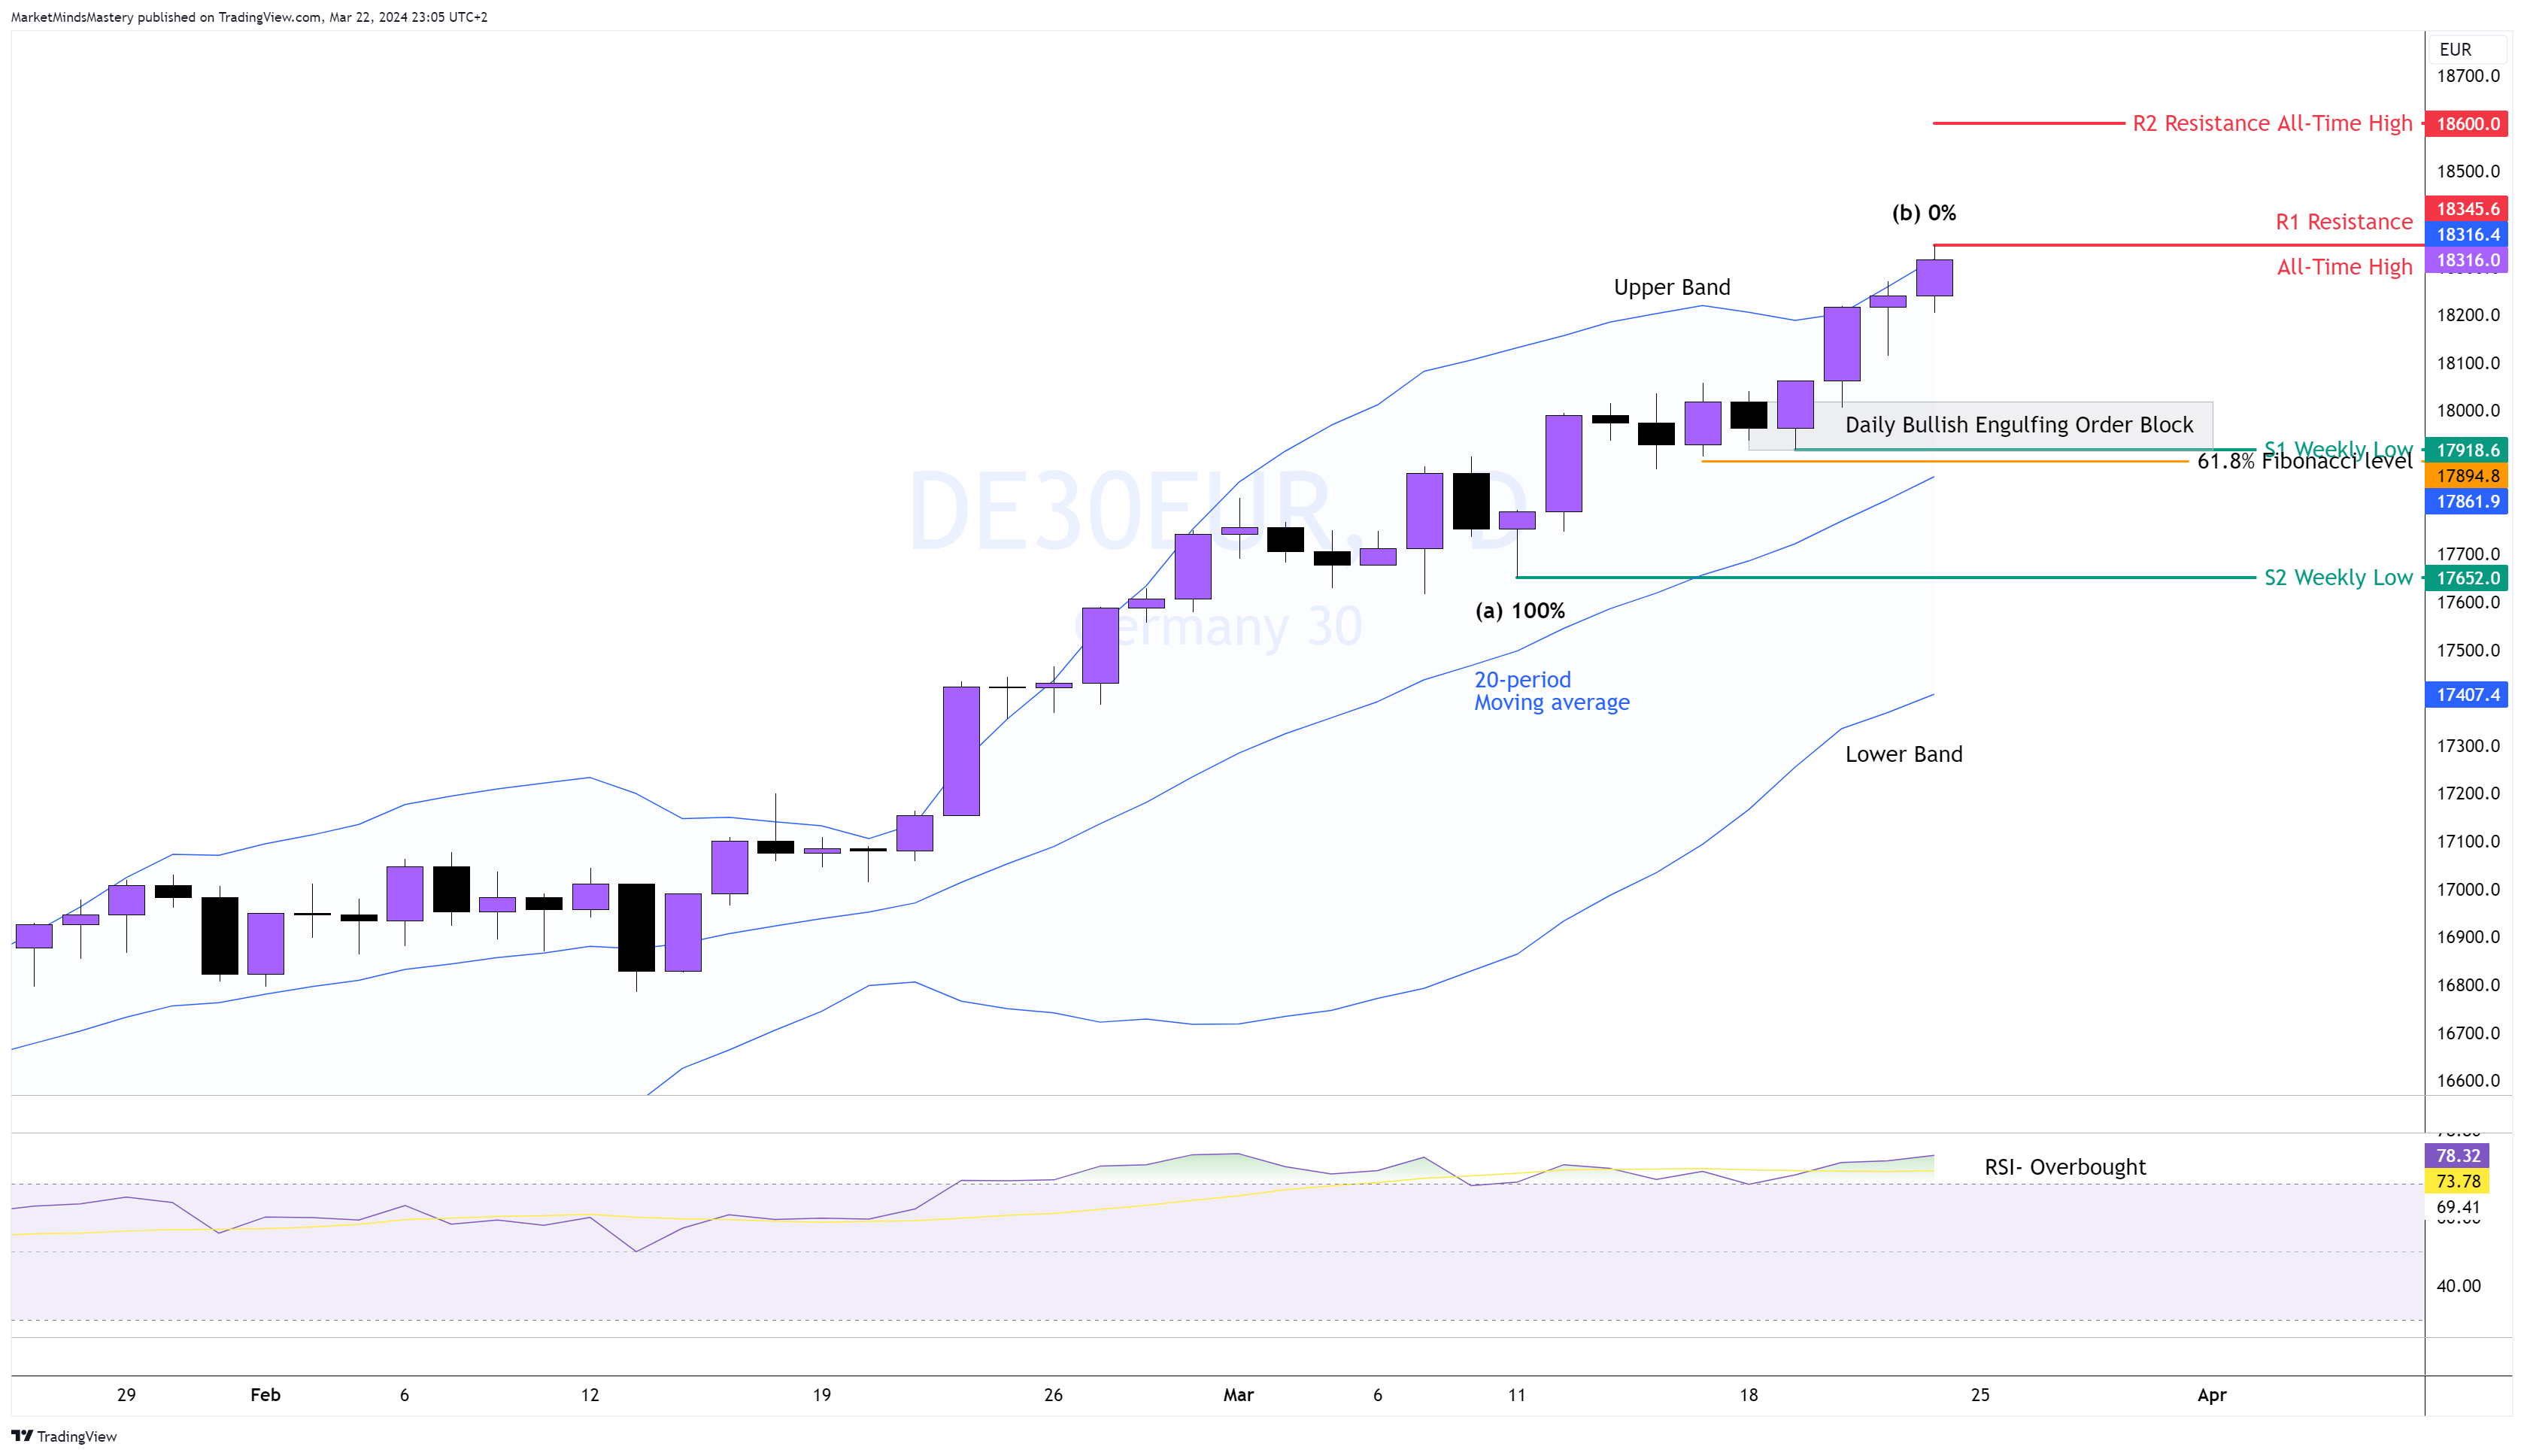
The price of the GER 40 last week, and more accurately, from Tuesday last week, started registering a new All-Time high after every Daily session. The buyer's dominance in the market is evident and can be seen on the chart by observing the number of bullish candles compared to the bearish candles and the size of the body of each bullish candle compared to the bearish. The bullish candles are shown with longer bodies, and they are more.
Since the beginning of February, the price has traded above the middle of the Bollinger Bands, which is the 20-period moving average, indicating a bullish market. The RSI is highly Overbought, indicating a steadily rising market. Therefore, if the price continues to increase, the existing All-Time high becomes the prominent resistance. A break and a close above it will lead the price to make a new All-Time High, estimated at around 18600.
On the other hand, if the price declines and moves downwards, the Bullish Engulfing Order Block on the Daily chart sits right above the S1 weekly support of around 18000.
Using the Fibonacci retracement tool to identify a potential correction, the 61,8% Golden Ratio is precisely at the same level as the S1 weekly support, indicating that the level is significant. If the price drops below the S1 and lower, the next support area, S2, is around the 17652.
👉 Click here to check our Challenges
👉 Don’t miss our Free Live Webinars
👉Join us on Discord
Risk Disclosure:
The Trading Pit offers only demo accounts to all users within the Challenges and Signal Provider Agreements (Scaling Plan). All assets and trading activities are purely virtual. Please note that we do not offer CFD (Contract for Difference) challenges to residents of Canada and the United States. All content and information on this website is for informational purposes only and should not be interpreted as financial advice. Also, remember that results achieved in the past are no guarantee of future results. It is essential to understand the risks associated with trading. If you are unsure, always consult an independent financial advisor.