The Trading Pit Week Ahead Market Outlook (February 12 – February 18)
This week’s main events are the CPI (Consumer Price Index) and GDP (Gross Domestic Product).
Starting Monday, the only significant news event, based on our calendar, will be the Bank of England Governor Bailey's speech. During his speech, he usually provides clues about the trend of the UK’s economy and inflation expectations.
On Tuesday, the Reserve Bank of New Zealand will report their Inflation Expectations for the first Quarter. Currently, the only available information is the previously reported number, 2.76%. Just before London opens, they will report the employment change in the UK, and the unemployment rate number, surprisingly, is expected to drop from 4.2% to 4%. Traders need to pay attention to the actual number if it will be deviated from the forecast. Any deviation can cause a significant reaction in the Pound price, which will be reflected in the GBP futures and the GBP currency pairs. During these events, intraday trading needs to be approached cautiously. During the same time, the CPI (Consumer Price Index) will be announced in Switzerland, and it is expected to drop from 1.7% previously to 1.6%. If the actual confirms the forecast number, the Swiss franc can weaken. When the Consumer Price Index of a country drops, it is suitable for consumers because services are likely to get cheaper. However, the currency depreciates. The next significant event for the day, and the last one, will be the US CPI (Consumer Price Index). They expected a drop in the number from 3.9% previously to 3.8/%. Again, if the CPI number drops, we expect to see a weak US dollar.
On Wednesday, it's the UK's turn to report their CPI number, and they expected to see an increase from 5.1% that was previously to 5.2%. If these happen and the market follows through, the Great British Pound may gain strength so that the GBPUSD might give some bullish set-up. Also, if the CHF weakens, the GBPCHF can host some solid bullish opportunities. The next significant event for the day will be the Eurozone's GDP (Gross Domestic Product) report. This report refers to the Q4 of 2023 and is expected to read a number of 0.1%, the same as it was previously.
On Thursday, the Bank of Japan will report the Gross Domestic Products number forecasted to increase to 0.3% compared to the -0.7% that was before. A rise in the GDP can potentially show an appreciation of the Japanese Yen, and if the market follows through, it can see buying opportunities on the CFDs and Futures Yen. If the USD weakens and the JPY strengthen, a selling opportunity can be available on the USDJPY. The volatility on the Australian dollar is expected to pick up during the Asian session, with the Australian reporting the unemployment rate. Previously, the number was 3.9%, and as per the forecast, it is expected to increase to 4%. If this happens and the AUD depreciates, the Aussie is expected to lose value. Based on the technical analysis, the AUDNZD is bearish on the medium-term trend. Therefore, the sell-off might be continued. Also, if the JPY strengthens, it might weaken the AUDJPY currency pair. The GDP will be reported in the UK later, and the -0.1% from the previous Quarter is expected to remain the same. At the London Open, the European Central Bank President, Legarde, will give a speech, and the Euro is predicted to get volatile around that time. As it is right at the London open, intraday trading must be approached carefully.
A drop in Retail Sales in the US is expected to be reported based on the consensus later during the New York trading session. The last reported number was 0.6%, forecasted to drop to -0.1% this time. All the news for this week is forecasted to be a weak USD. The last significant event for the week will be the Retail Sales in the UK reported on Friday from -3.2% previously to +1.5%. If the actual confirms the forecast and the Sterling gains strength, we might see a robust, solid, bullish move on the Sterling.
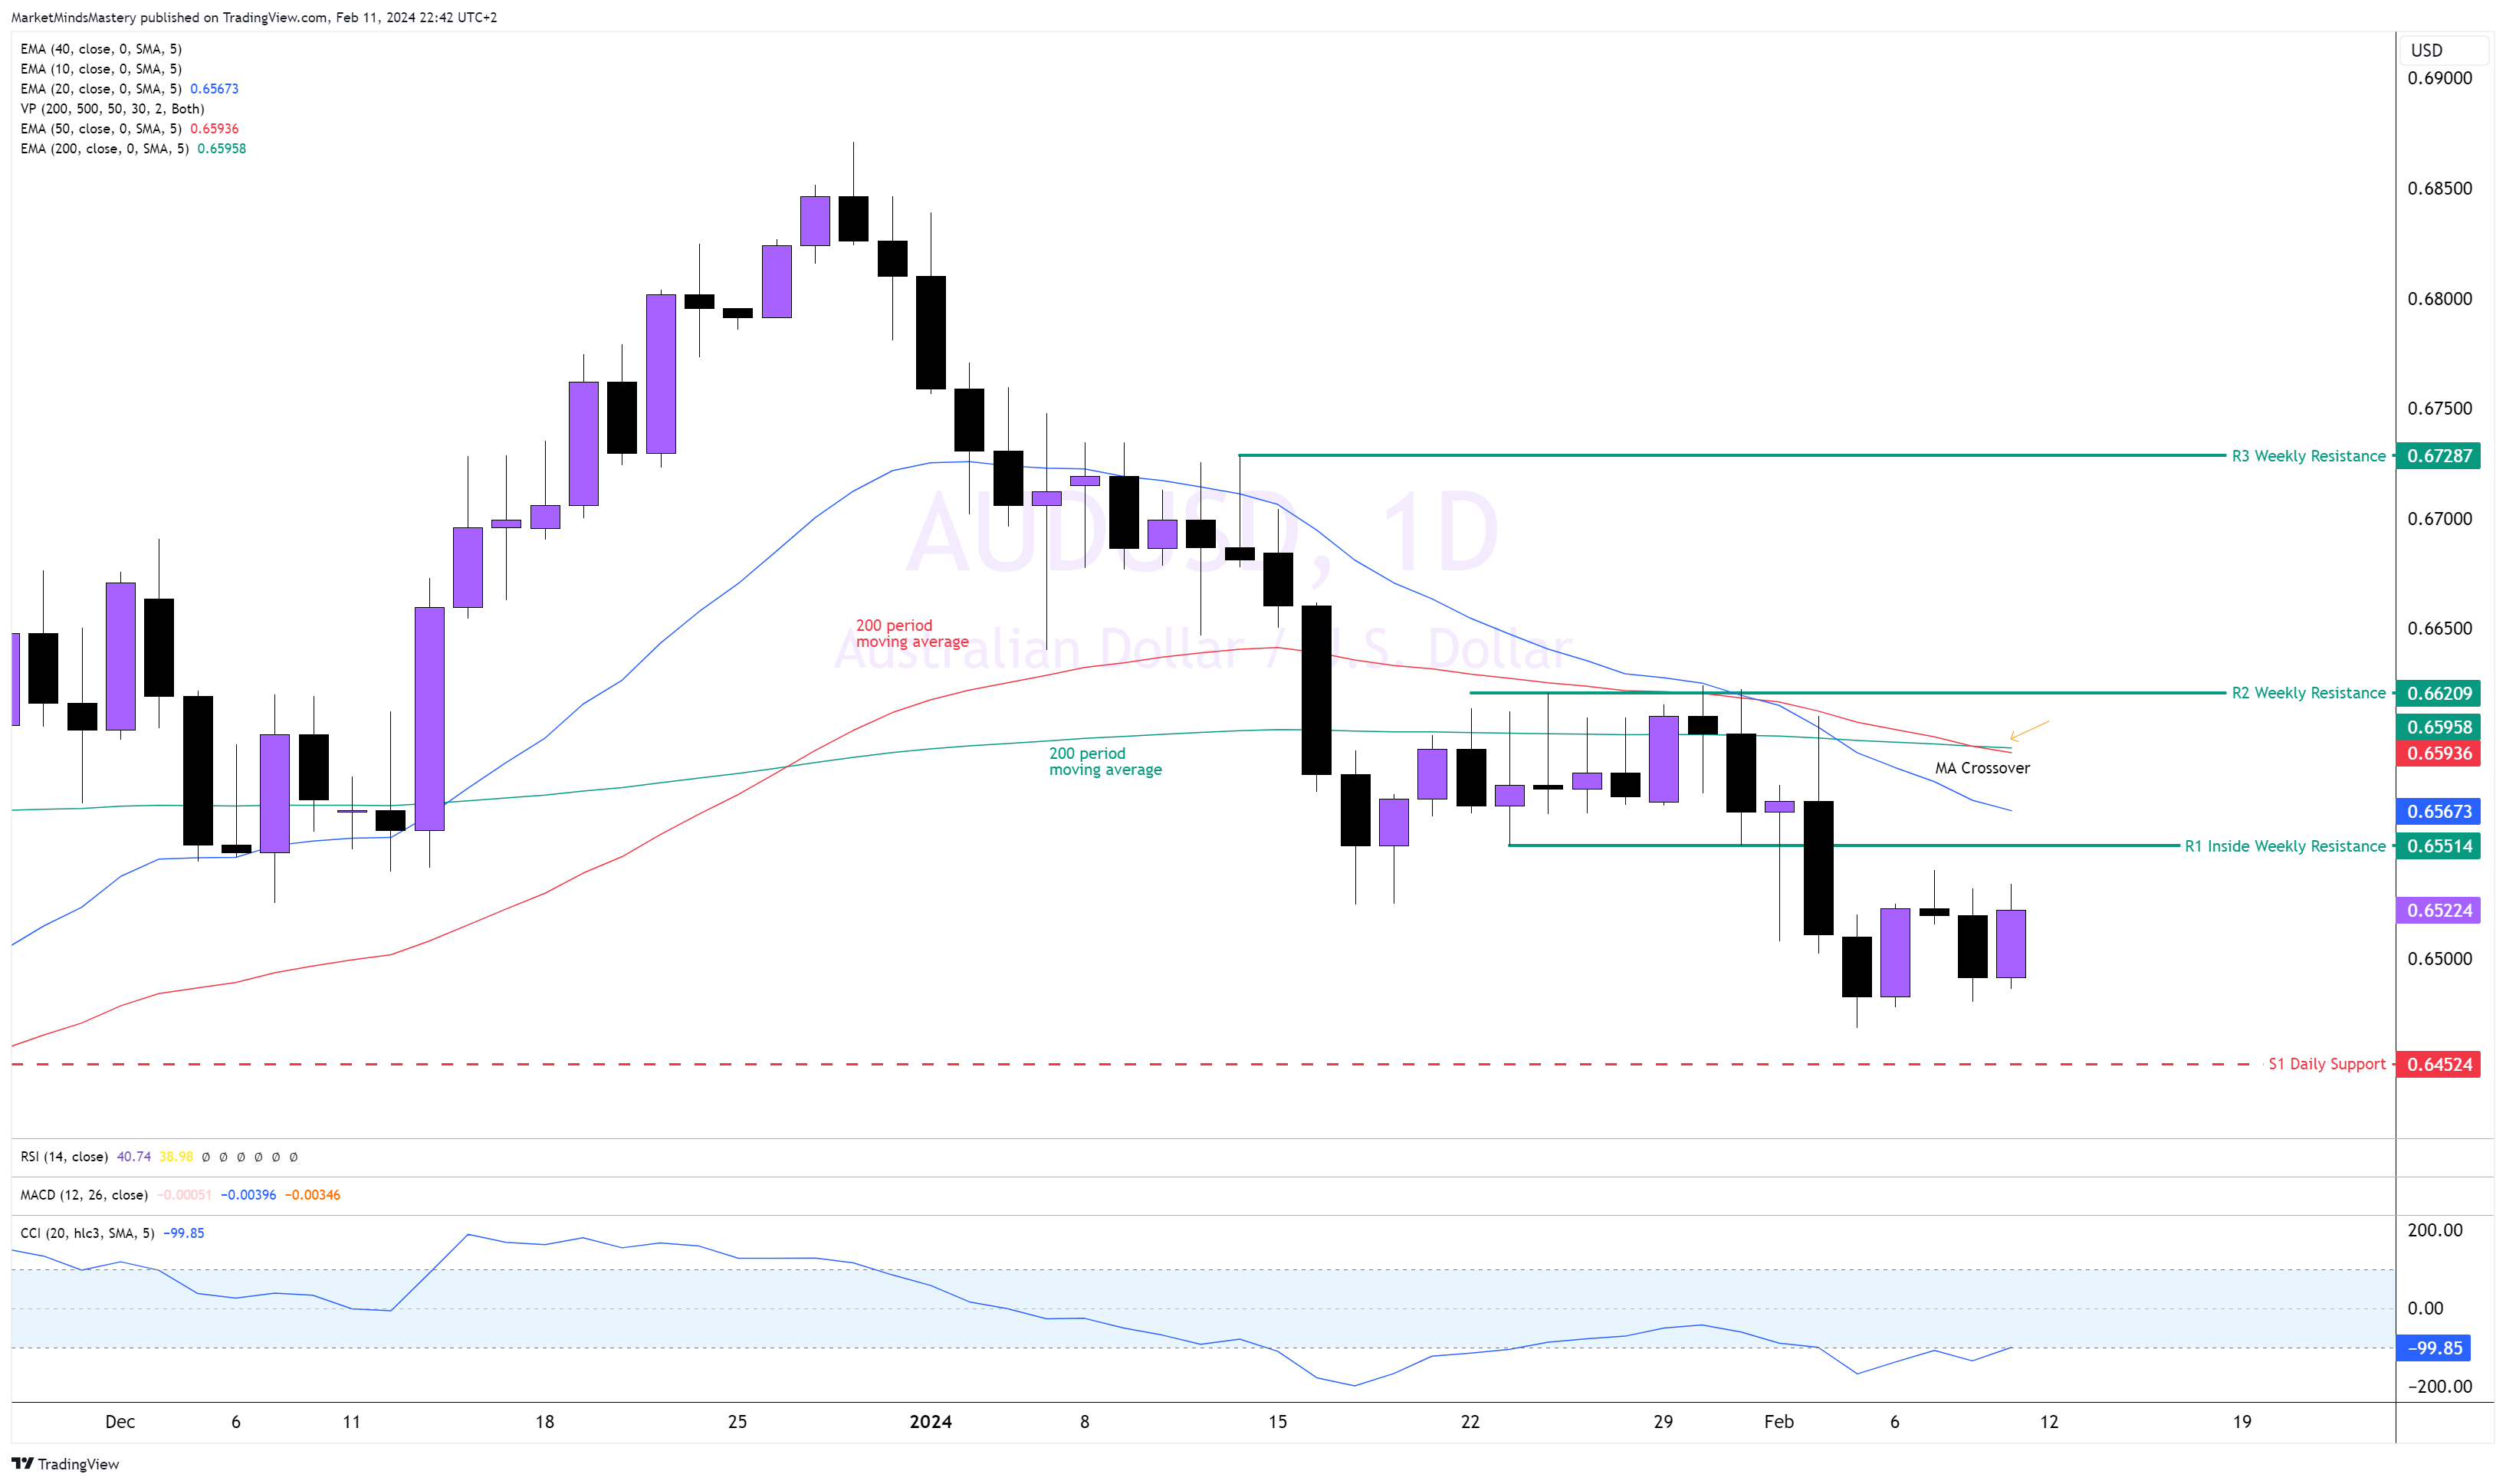
AUDUSD,Daily

Following the price decline starting in early January, the price made lower highs and lower lows. The 50-period moving average crossed below the 200-period moving average, a bearish indication. The MACD is trading below the zero line, which is also a bearish indication. If the price moves upwards, the first resistance area, R1, is an inside weekly resistance, approximately 0.65514. The following dynamic resistance becomes the moving average if the price penetrates the R1 and closes above it. Usually, when markets are trending, the moving averages act as resistance areas. Conversely, if the price declines and moves lower, the first support area, S1, is around the 0.64524 level. A break below it can find the support, S2, approximately 0.63473.
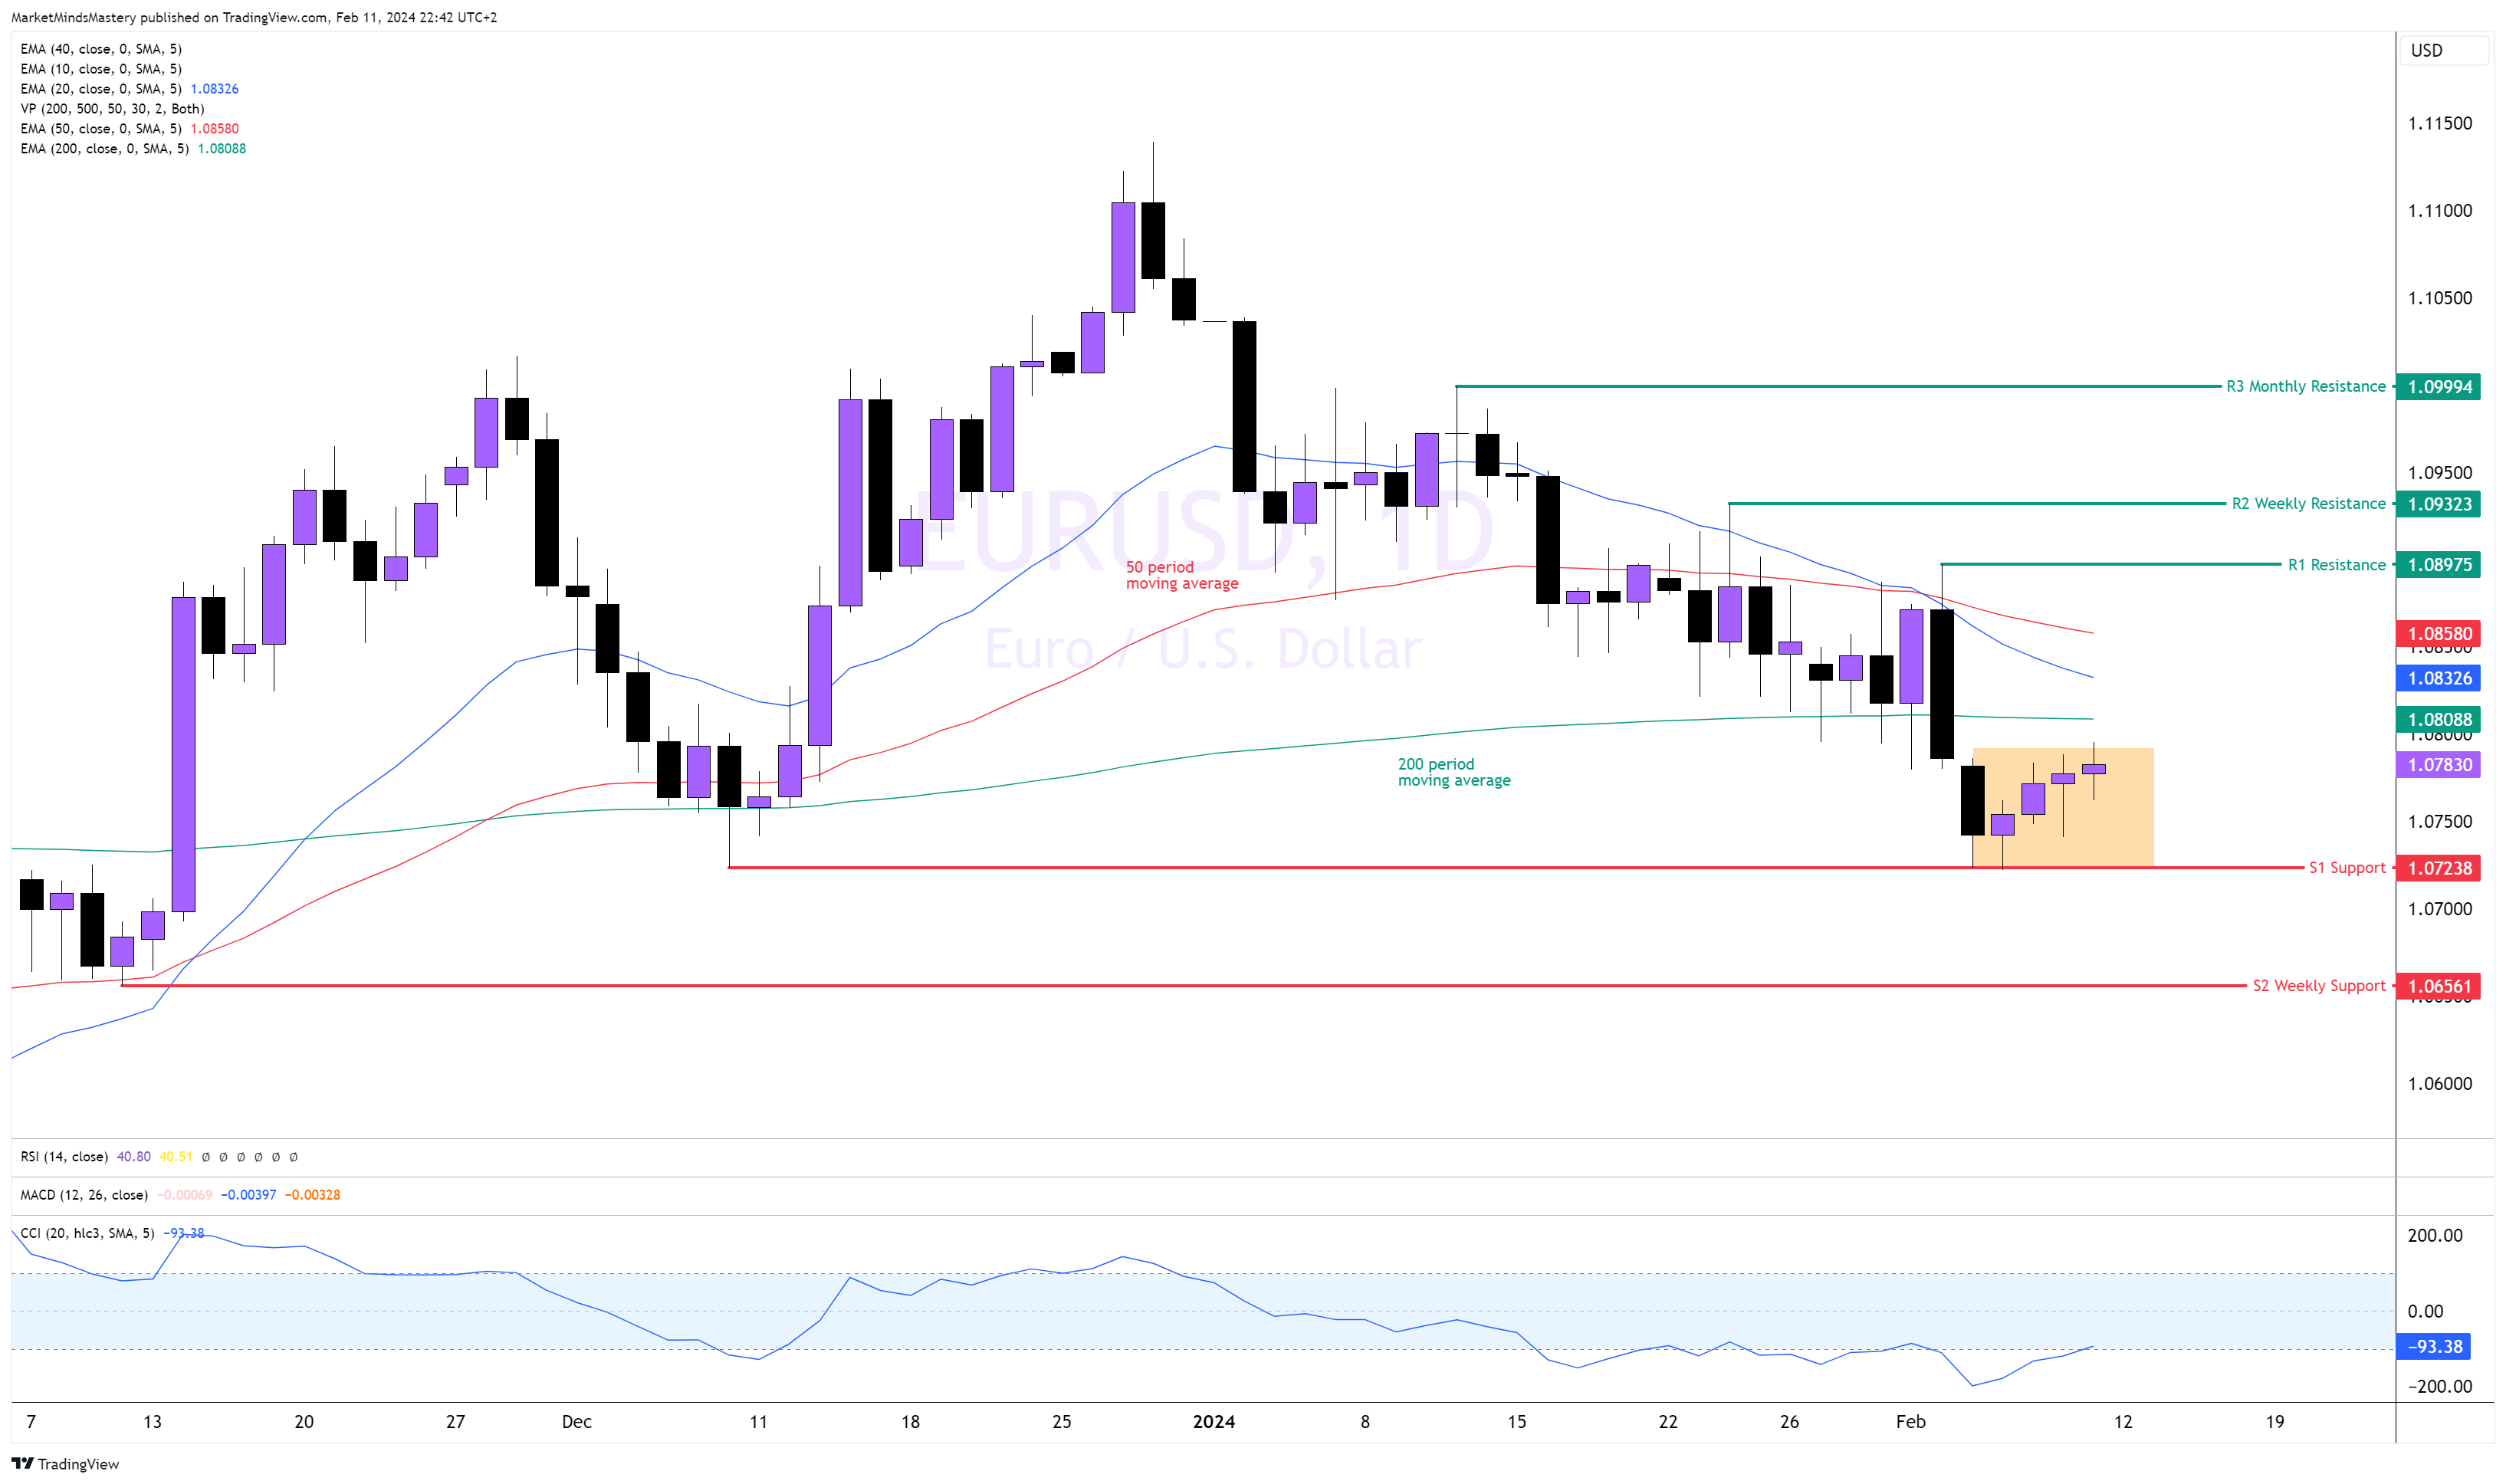
EURUSD, Daily
Following the break and close below the 200-period moving average, the Bearish Engulfing candle forced the price to shift to the downside last Monday, as expected. Since then, the price tested the S1 support around 1.07238 and bounced upwards, and over the previous four trading days, the price traded between the high and the low of Tuesday’s candle. Usually, a bounce-off support endorses significant activity, and the price moves upwards noticeably. The MACD is below zero, with the Signal line above the MACD line indicating bearish activity. If the price continues to push upwards and surpasses the 50 and 200-period moving averages, the first static resistance, R1, is the high of the recent bearish engulfing, around 1.08975. Right after above it, within a distance of approximately 30 pips, is the R2 static resistance around 1.09323.
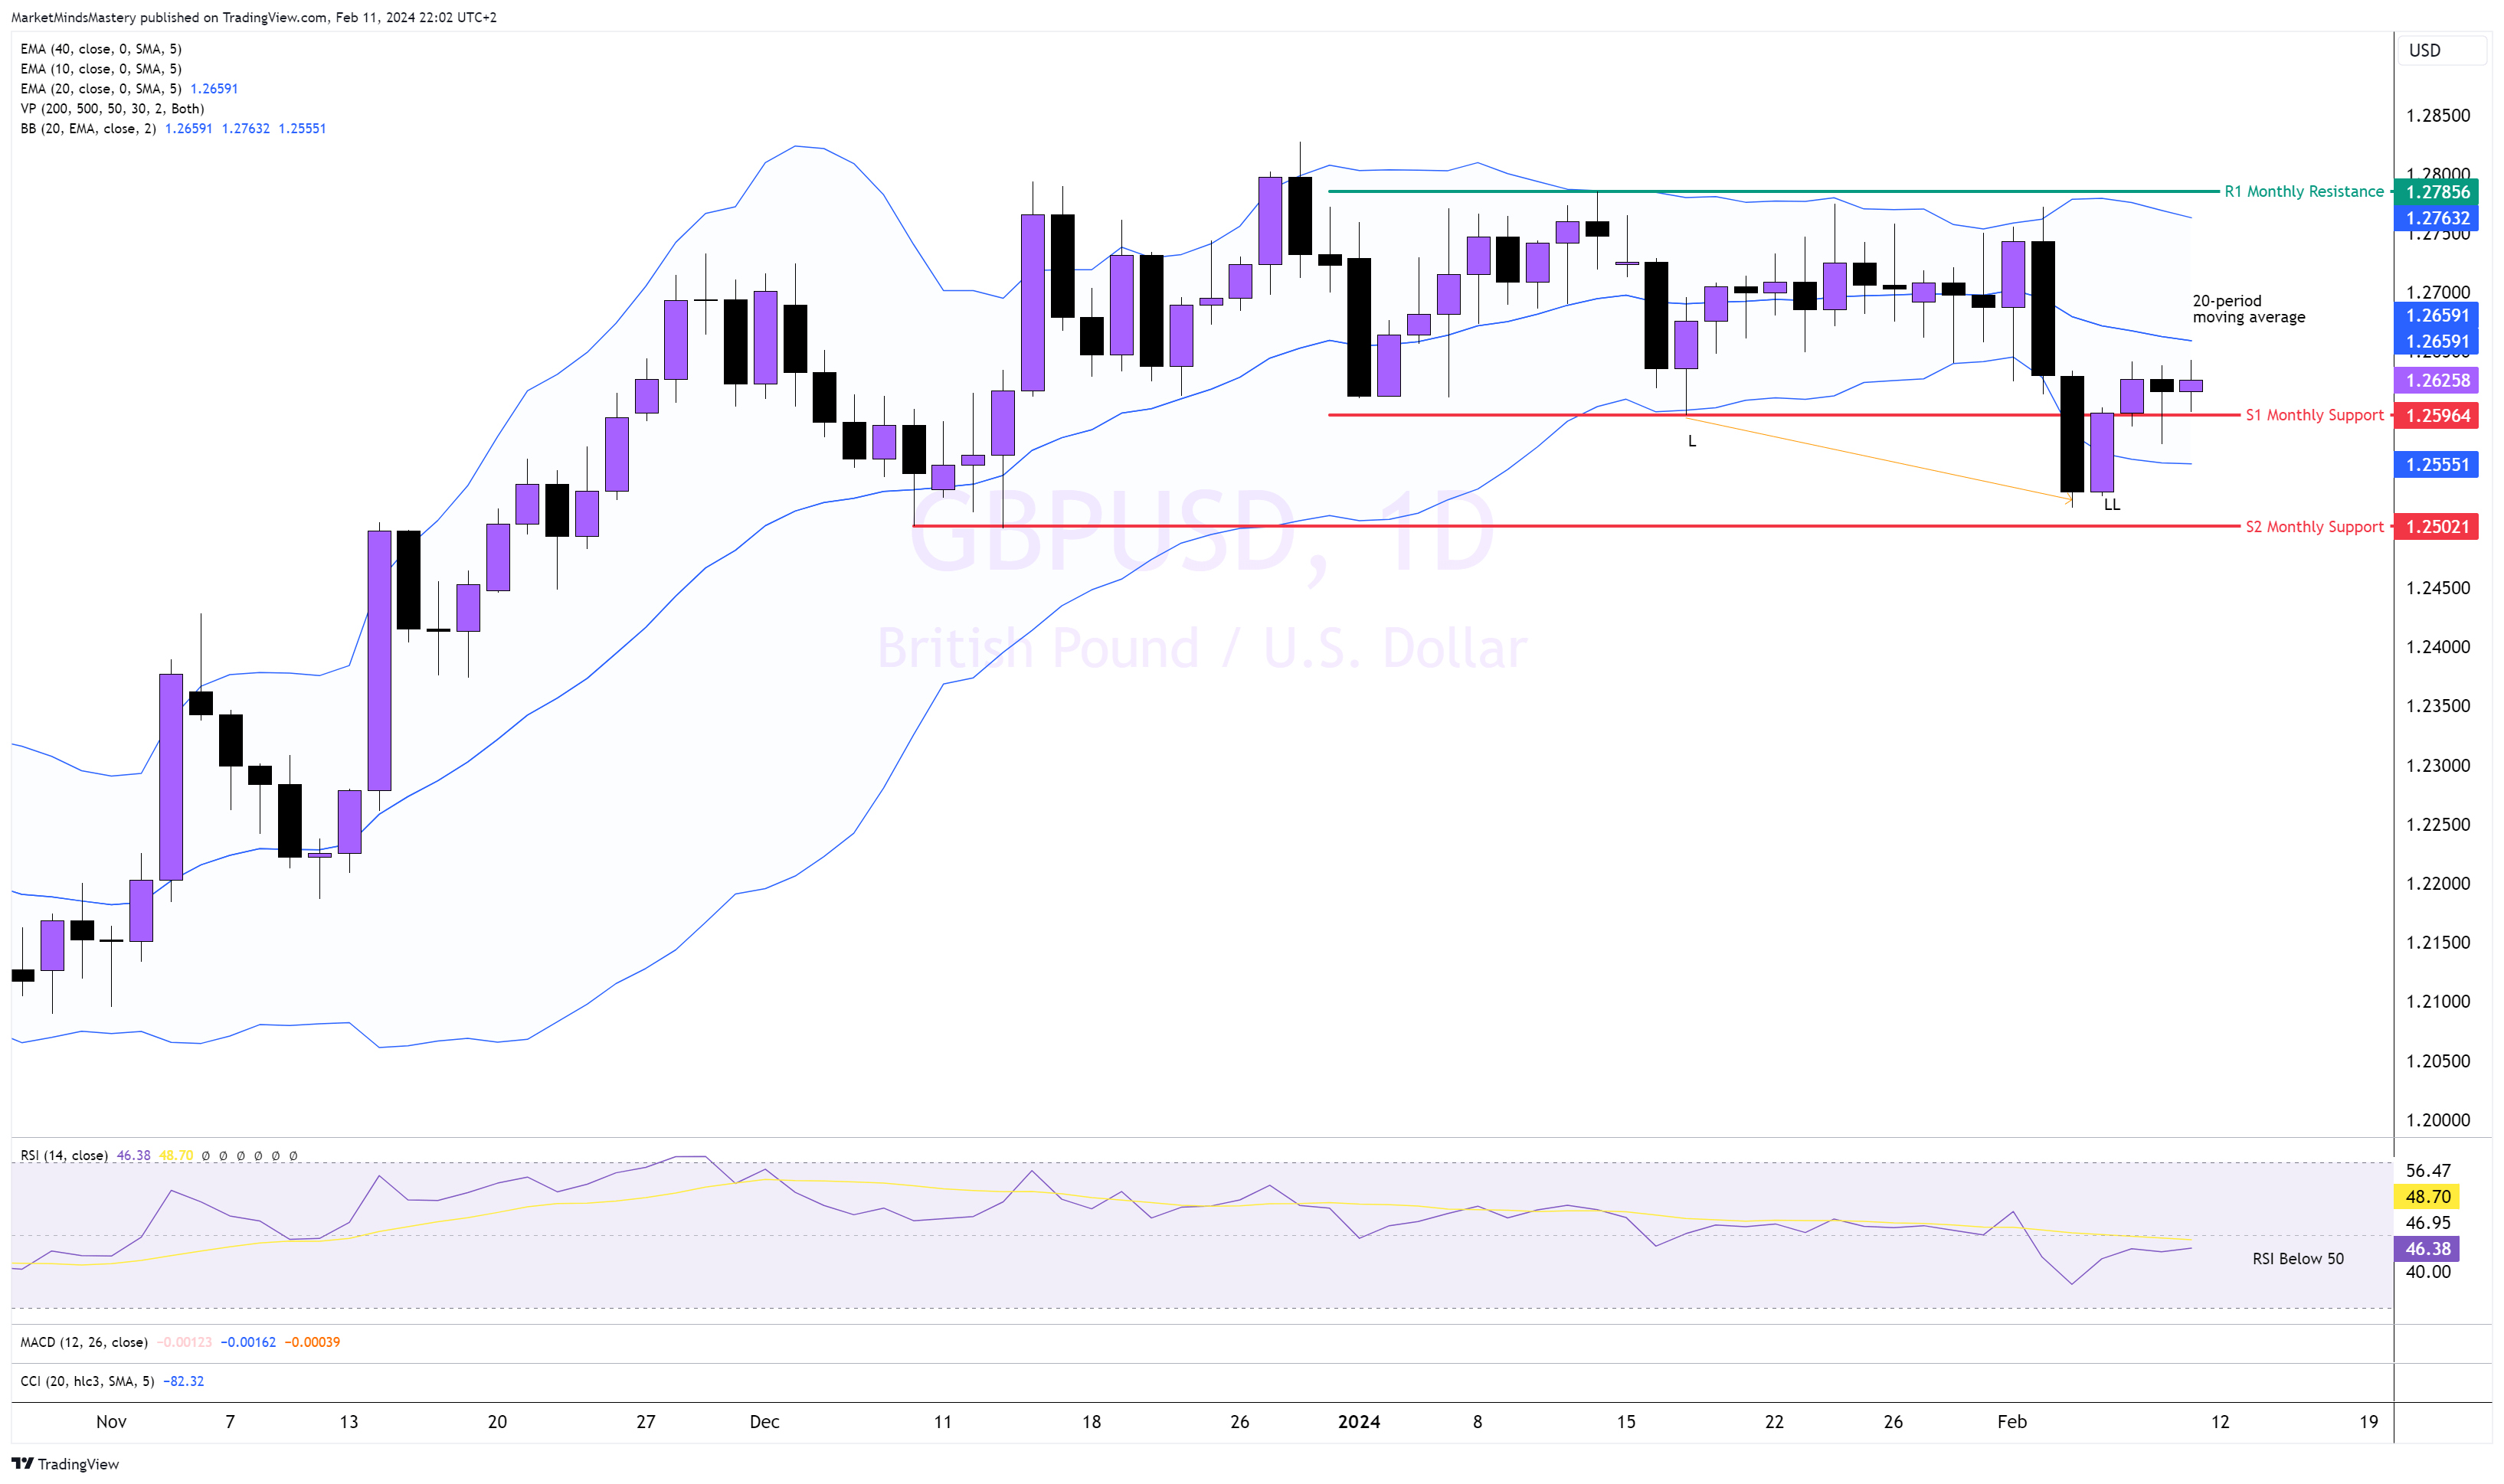
GBPUSD, Daily
Following the range created in the last couple of months, the price broke outside the range to the downside, as we explained in last week’s analysis, and created a lower low, as seen in the chart above. After the breakout, the sellers didn’t push the price below 1.255. Since the 1.25 area is vital, we expect intense trading activity. Therefore, the price found support and moved upwards. Consequently, the price returned inside the Bollinger bands and still traded below the 20-period moving average. If the price keeps rising, the 20-period moving average can act as a dynamic, which is resistance, and force the price to decline. If the price moves above the 20 MA, the first static resistance, R1, will be the area that recently hosted enormous trading activity, as shown on the chart. That is a monthly level of around 1.2775. It consists of the upper band of the Bollinger Band indicator. A decline and a move lower find the S1 support around 1.255 and the S2 support around 1.25. The RSI oscillator is below 50, indicating bearish biases.
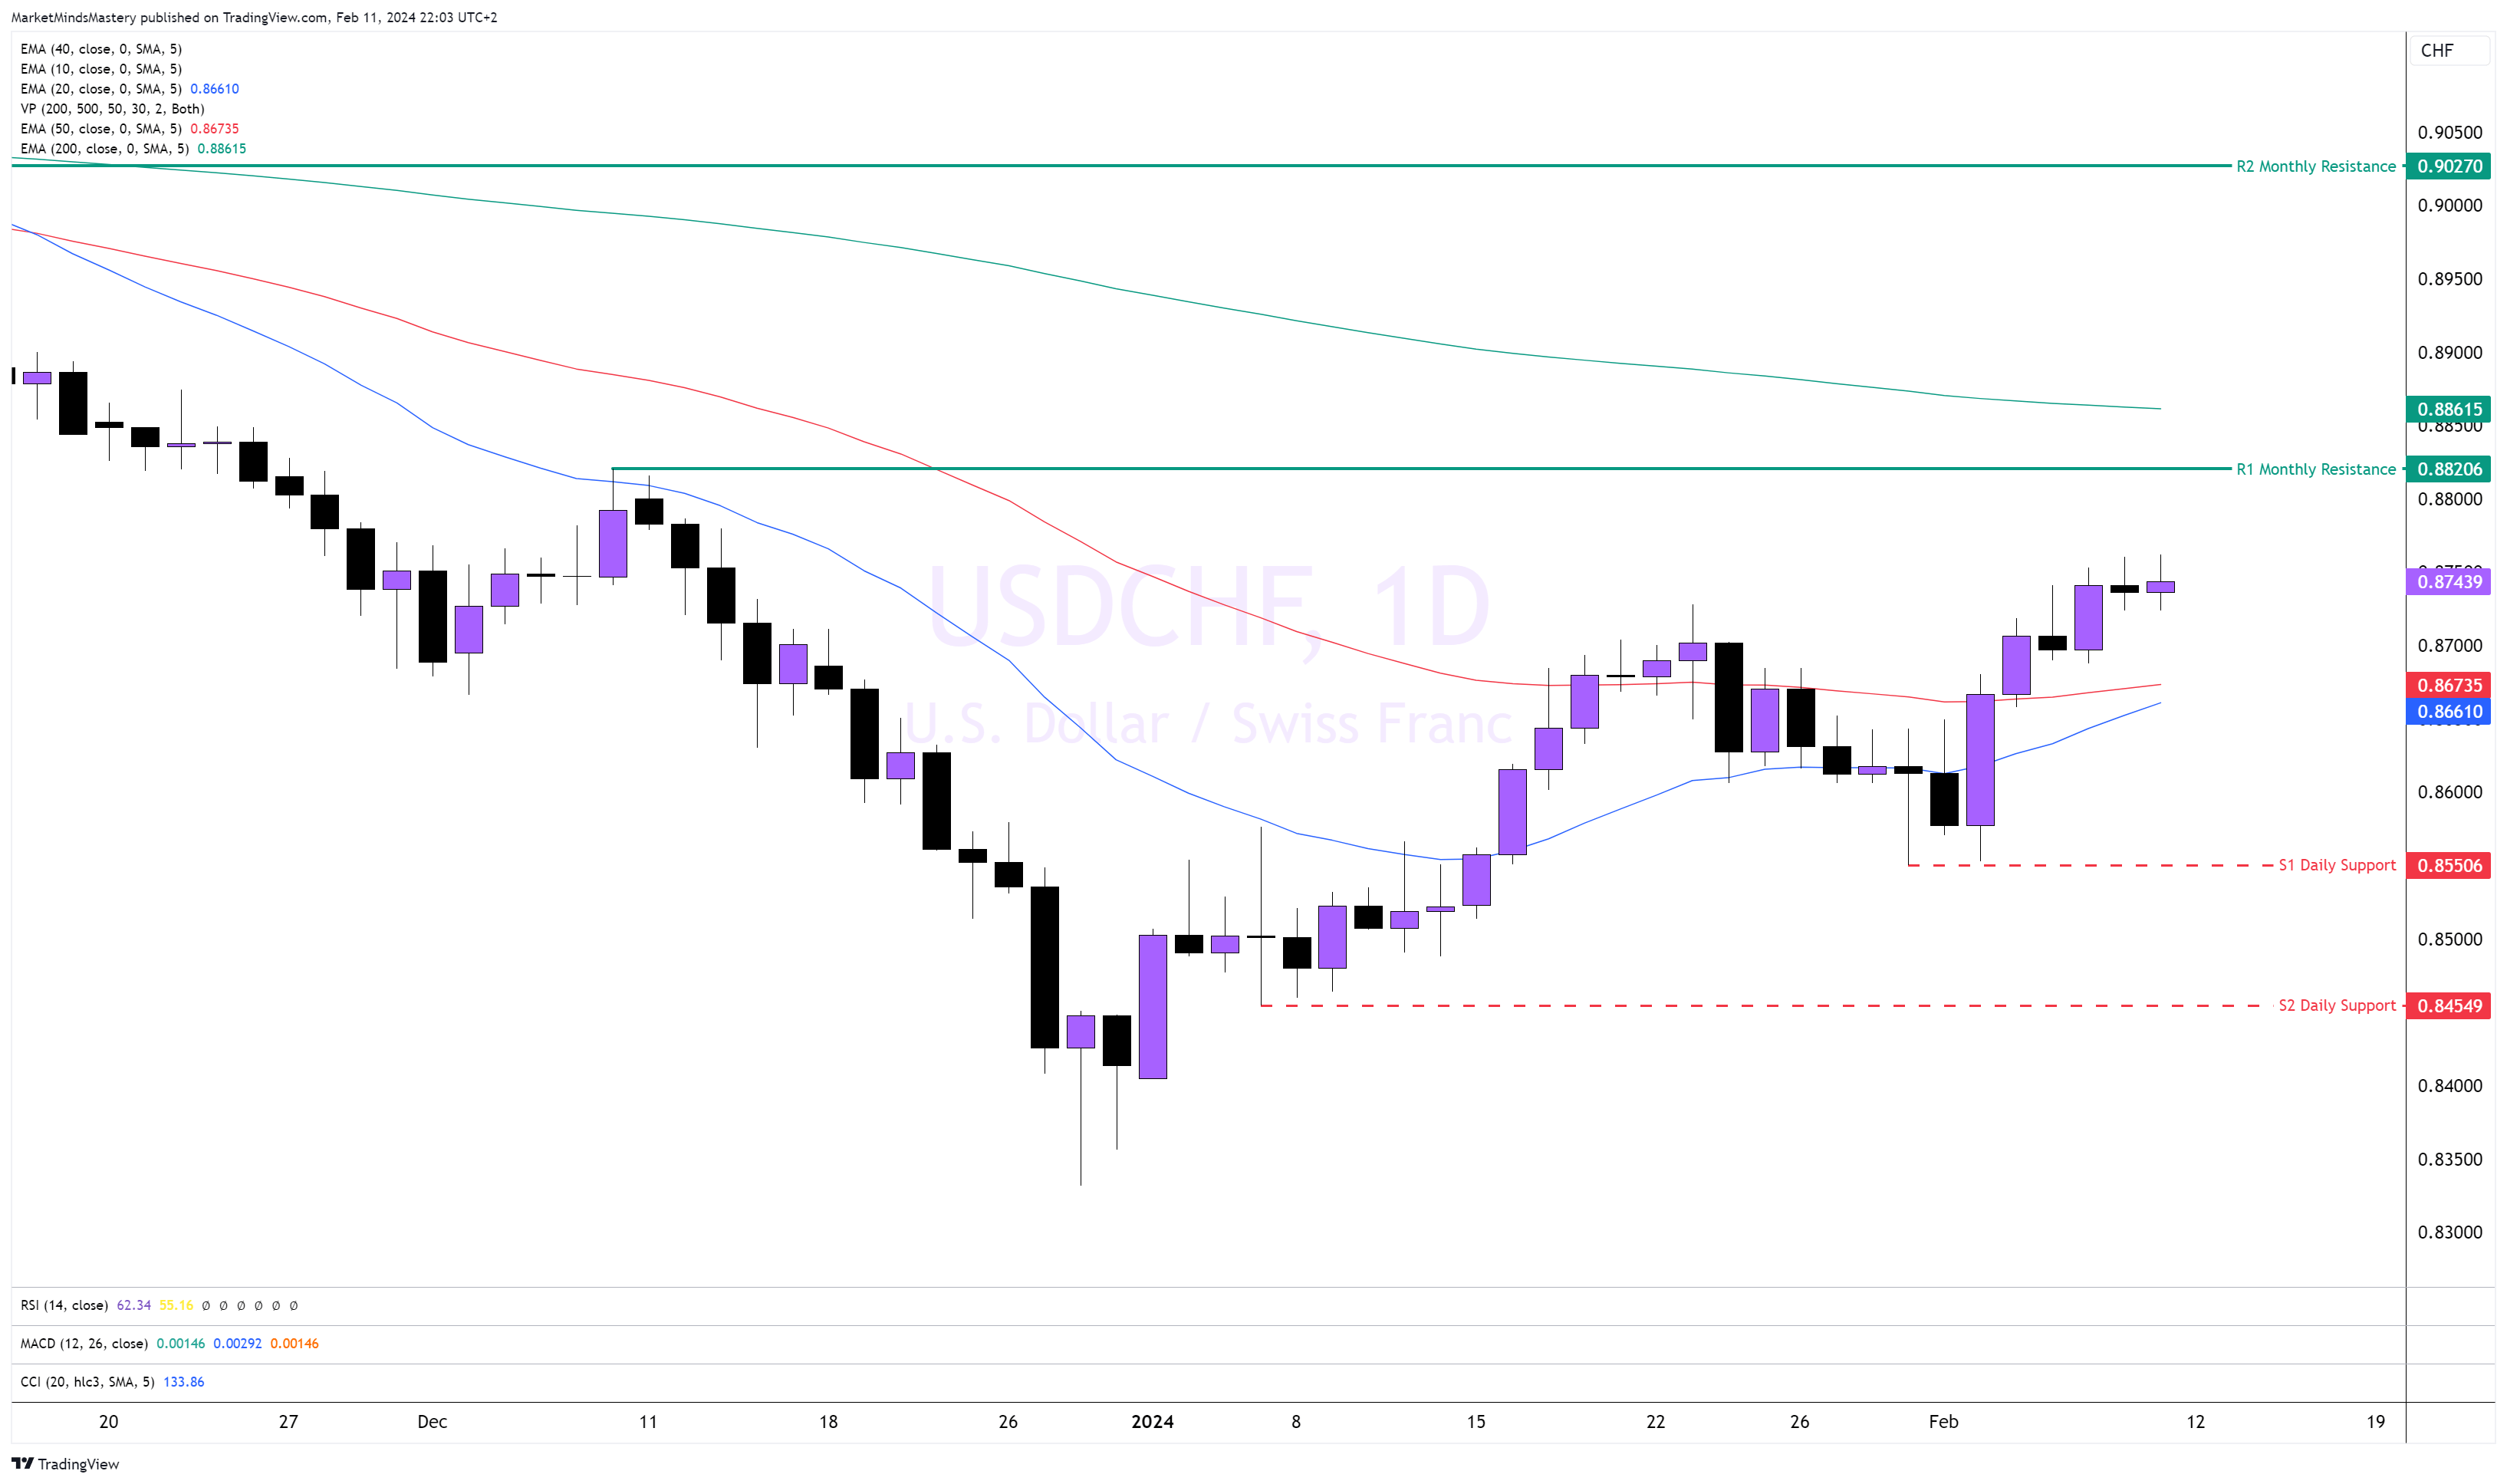
USDCHF Daily
Last week, the Swissy was one of the weakest currencies. That caused the USDCHF to climb higher, surpass the 50-period MA and rise. The price trades above the 50 MA, forming a higher high and a higher low. The RSI is above 50, indicating a bullish sentiment.
On Tuesday, if the CPI number is reported lower than expected and the CHF depreciates, the price might move higher in a continuation of the intermediate uptrend. The first area of Resistance, R1, a monthly level, is approximately 0.88206. If the price continues moving higher and penetrating it, the 200-period moving average becomes the next dynamic resistance area. Any weakness caused in the currency pair will be shown on the chart with a price decline. If a price moves downwards, the 50-period MA can act as the first dynamic resistance, followed by the S1 and S2 static supports, around 0.8550 and 0.8455, respectively.
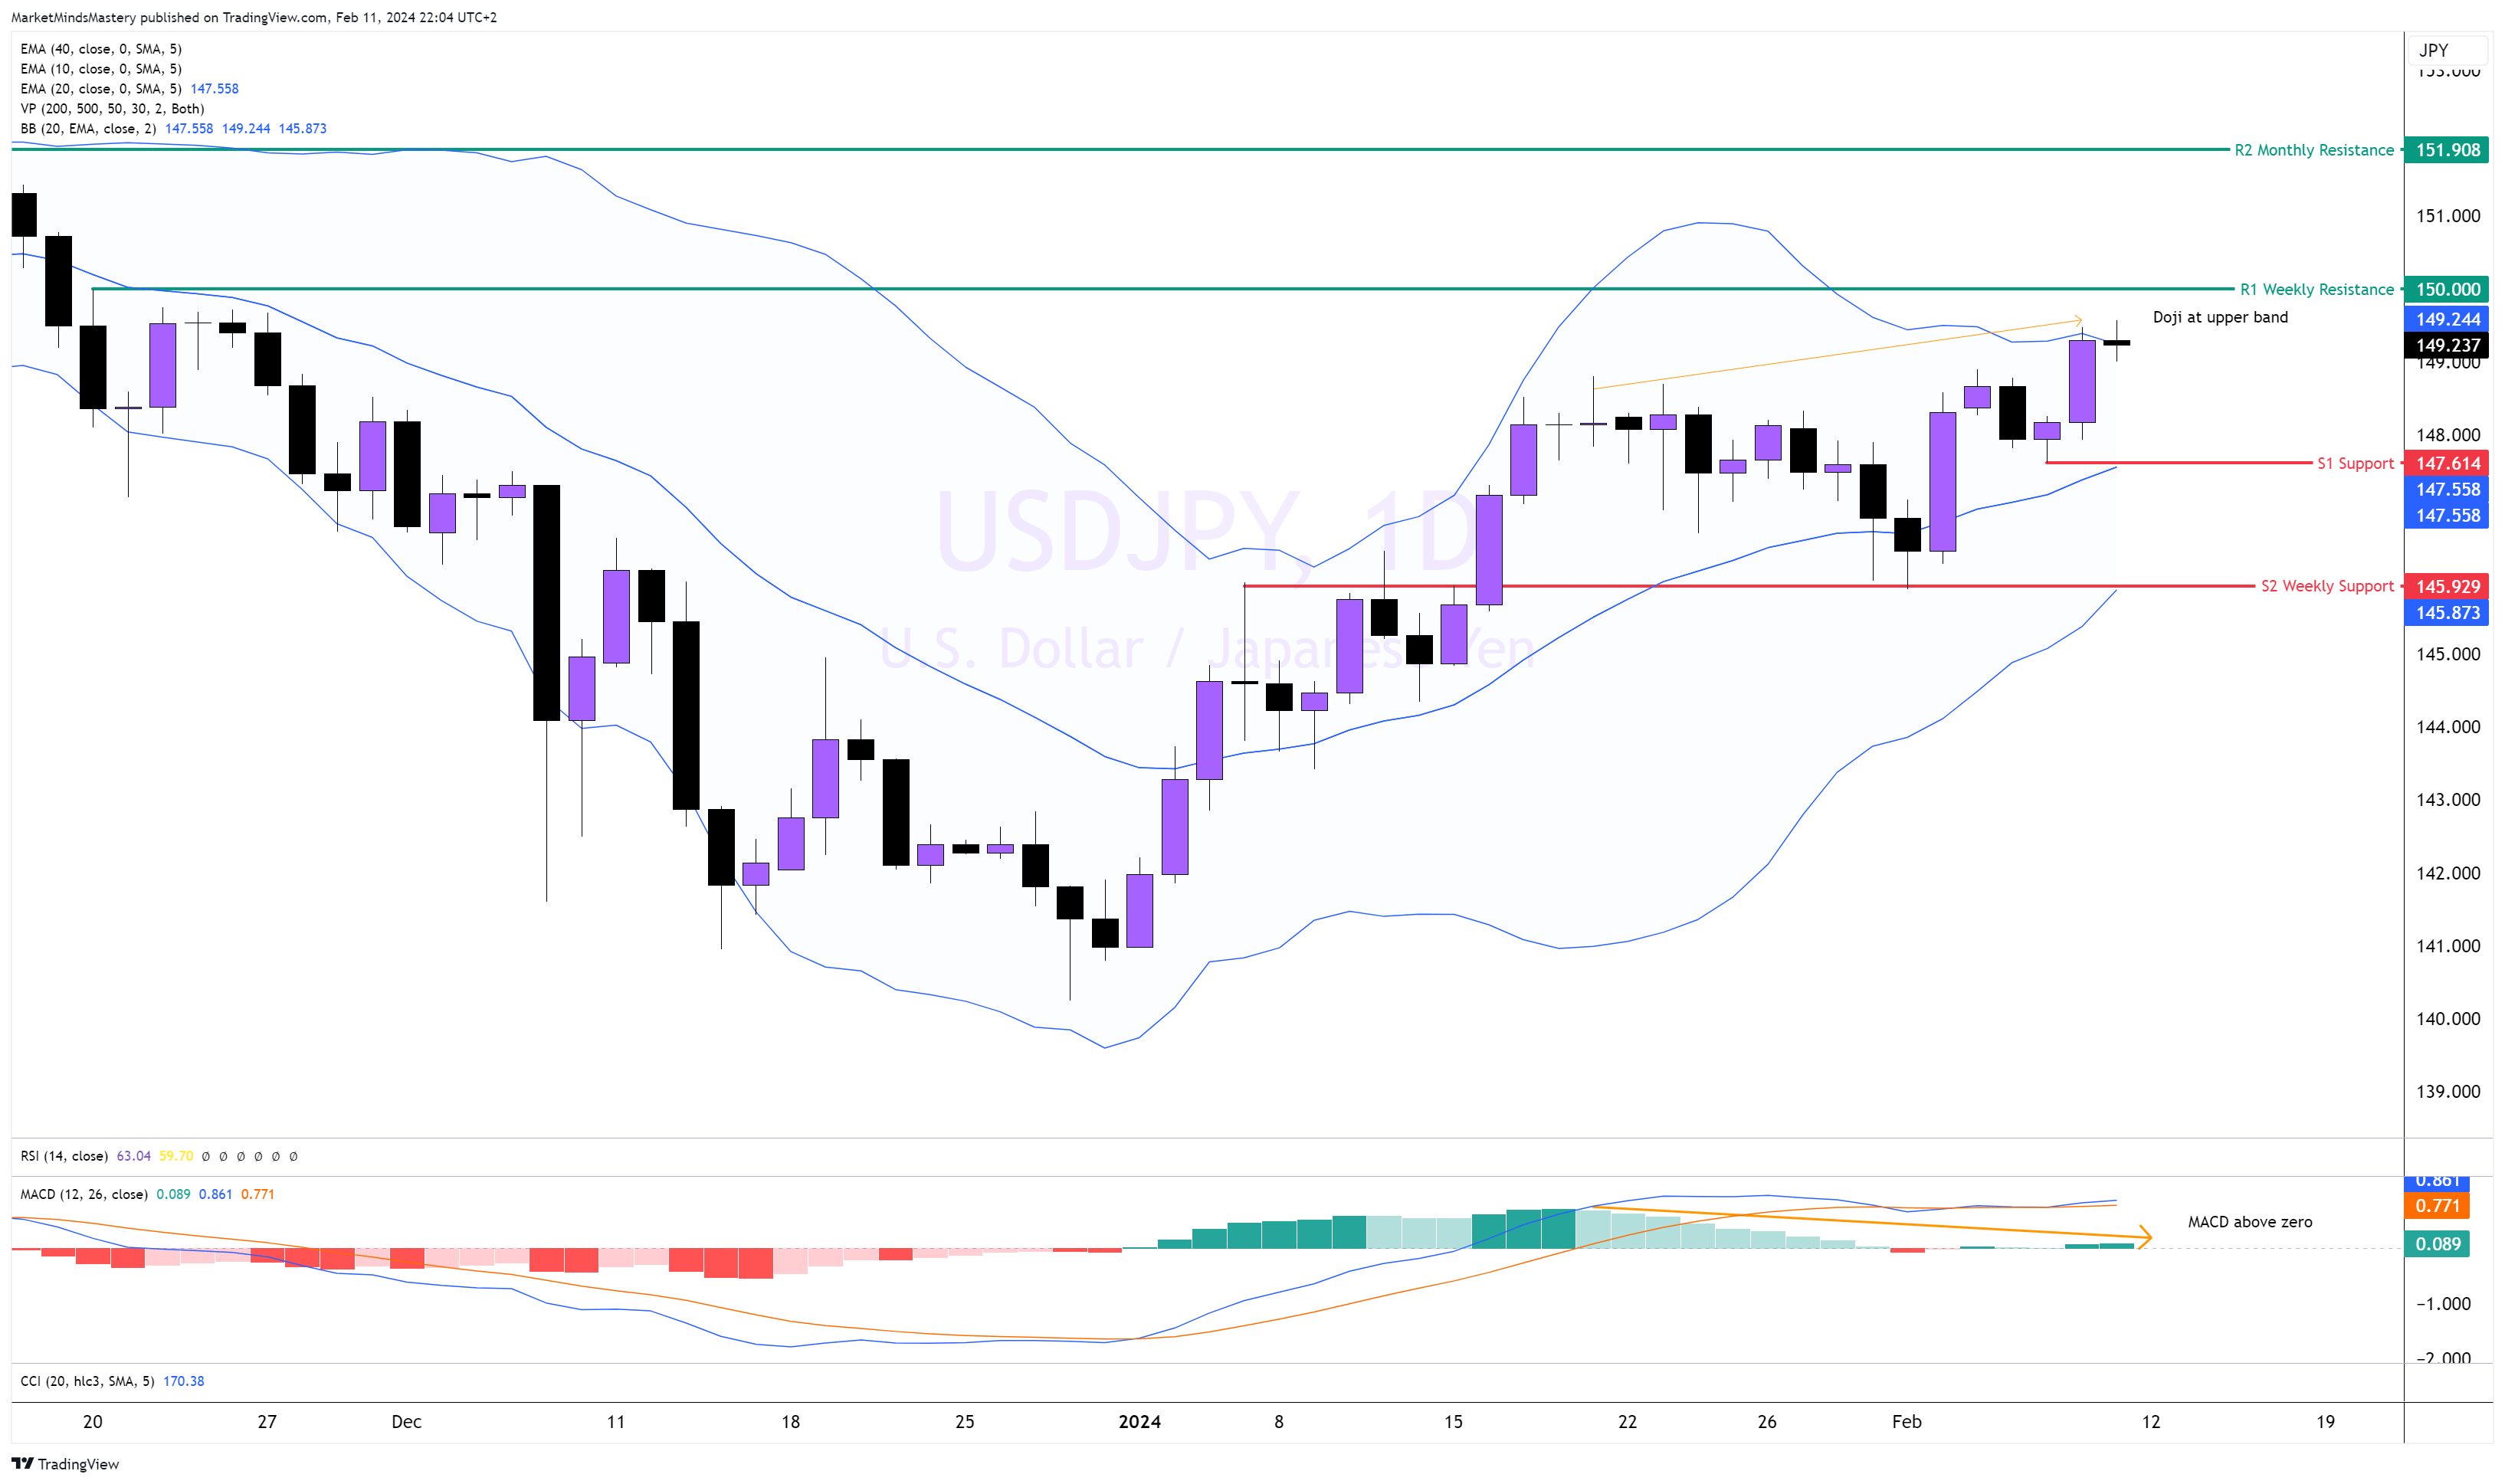
USDJPY Daily
Fundamentally, the USD is forecast to be a weak currency, and the GDP in Japan is expected to improve. Therefore, if the events in the macroeconomic scale favour the Yen and simultaneously, in the US, the Greenback is weakening. Hence, the USDJPY is suspective of a short-term decline. The price is still making higher highs and higher lows. It is trading above the 20-period moving average, indicating an uptrend. The MACD also shows bullish biases, with the histogram printing bearish divergences. The price action shows a Doji candle right after a long bullish candle within an uptrend. If the price temporarily moves lower, the first support area will be the dynamic 20-period MA of the Bollinger Band indicator. If the price moves below it, you will find the S1 support around 147.614.
Conversely, if the price moves upwards, the first resistance area, R1, will be around 150. It is a significant level for traders as it is a round number, and traders will look to participate in anticipation of price fluctuations from the specific level. A close above will see the next resistance, R2, approximately 151.908.
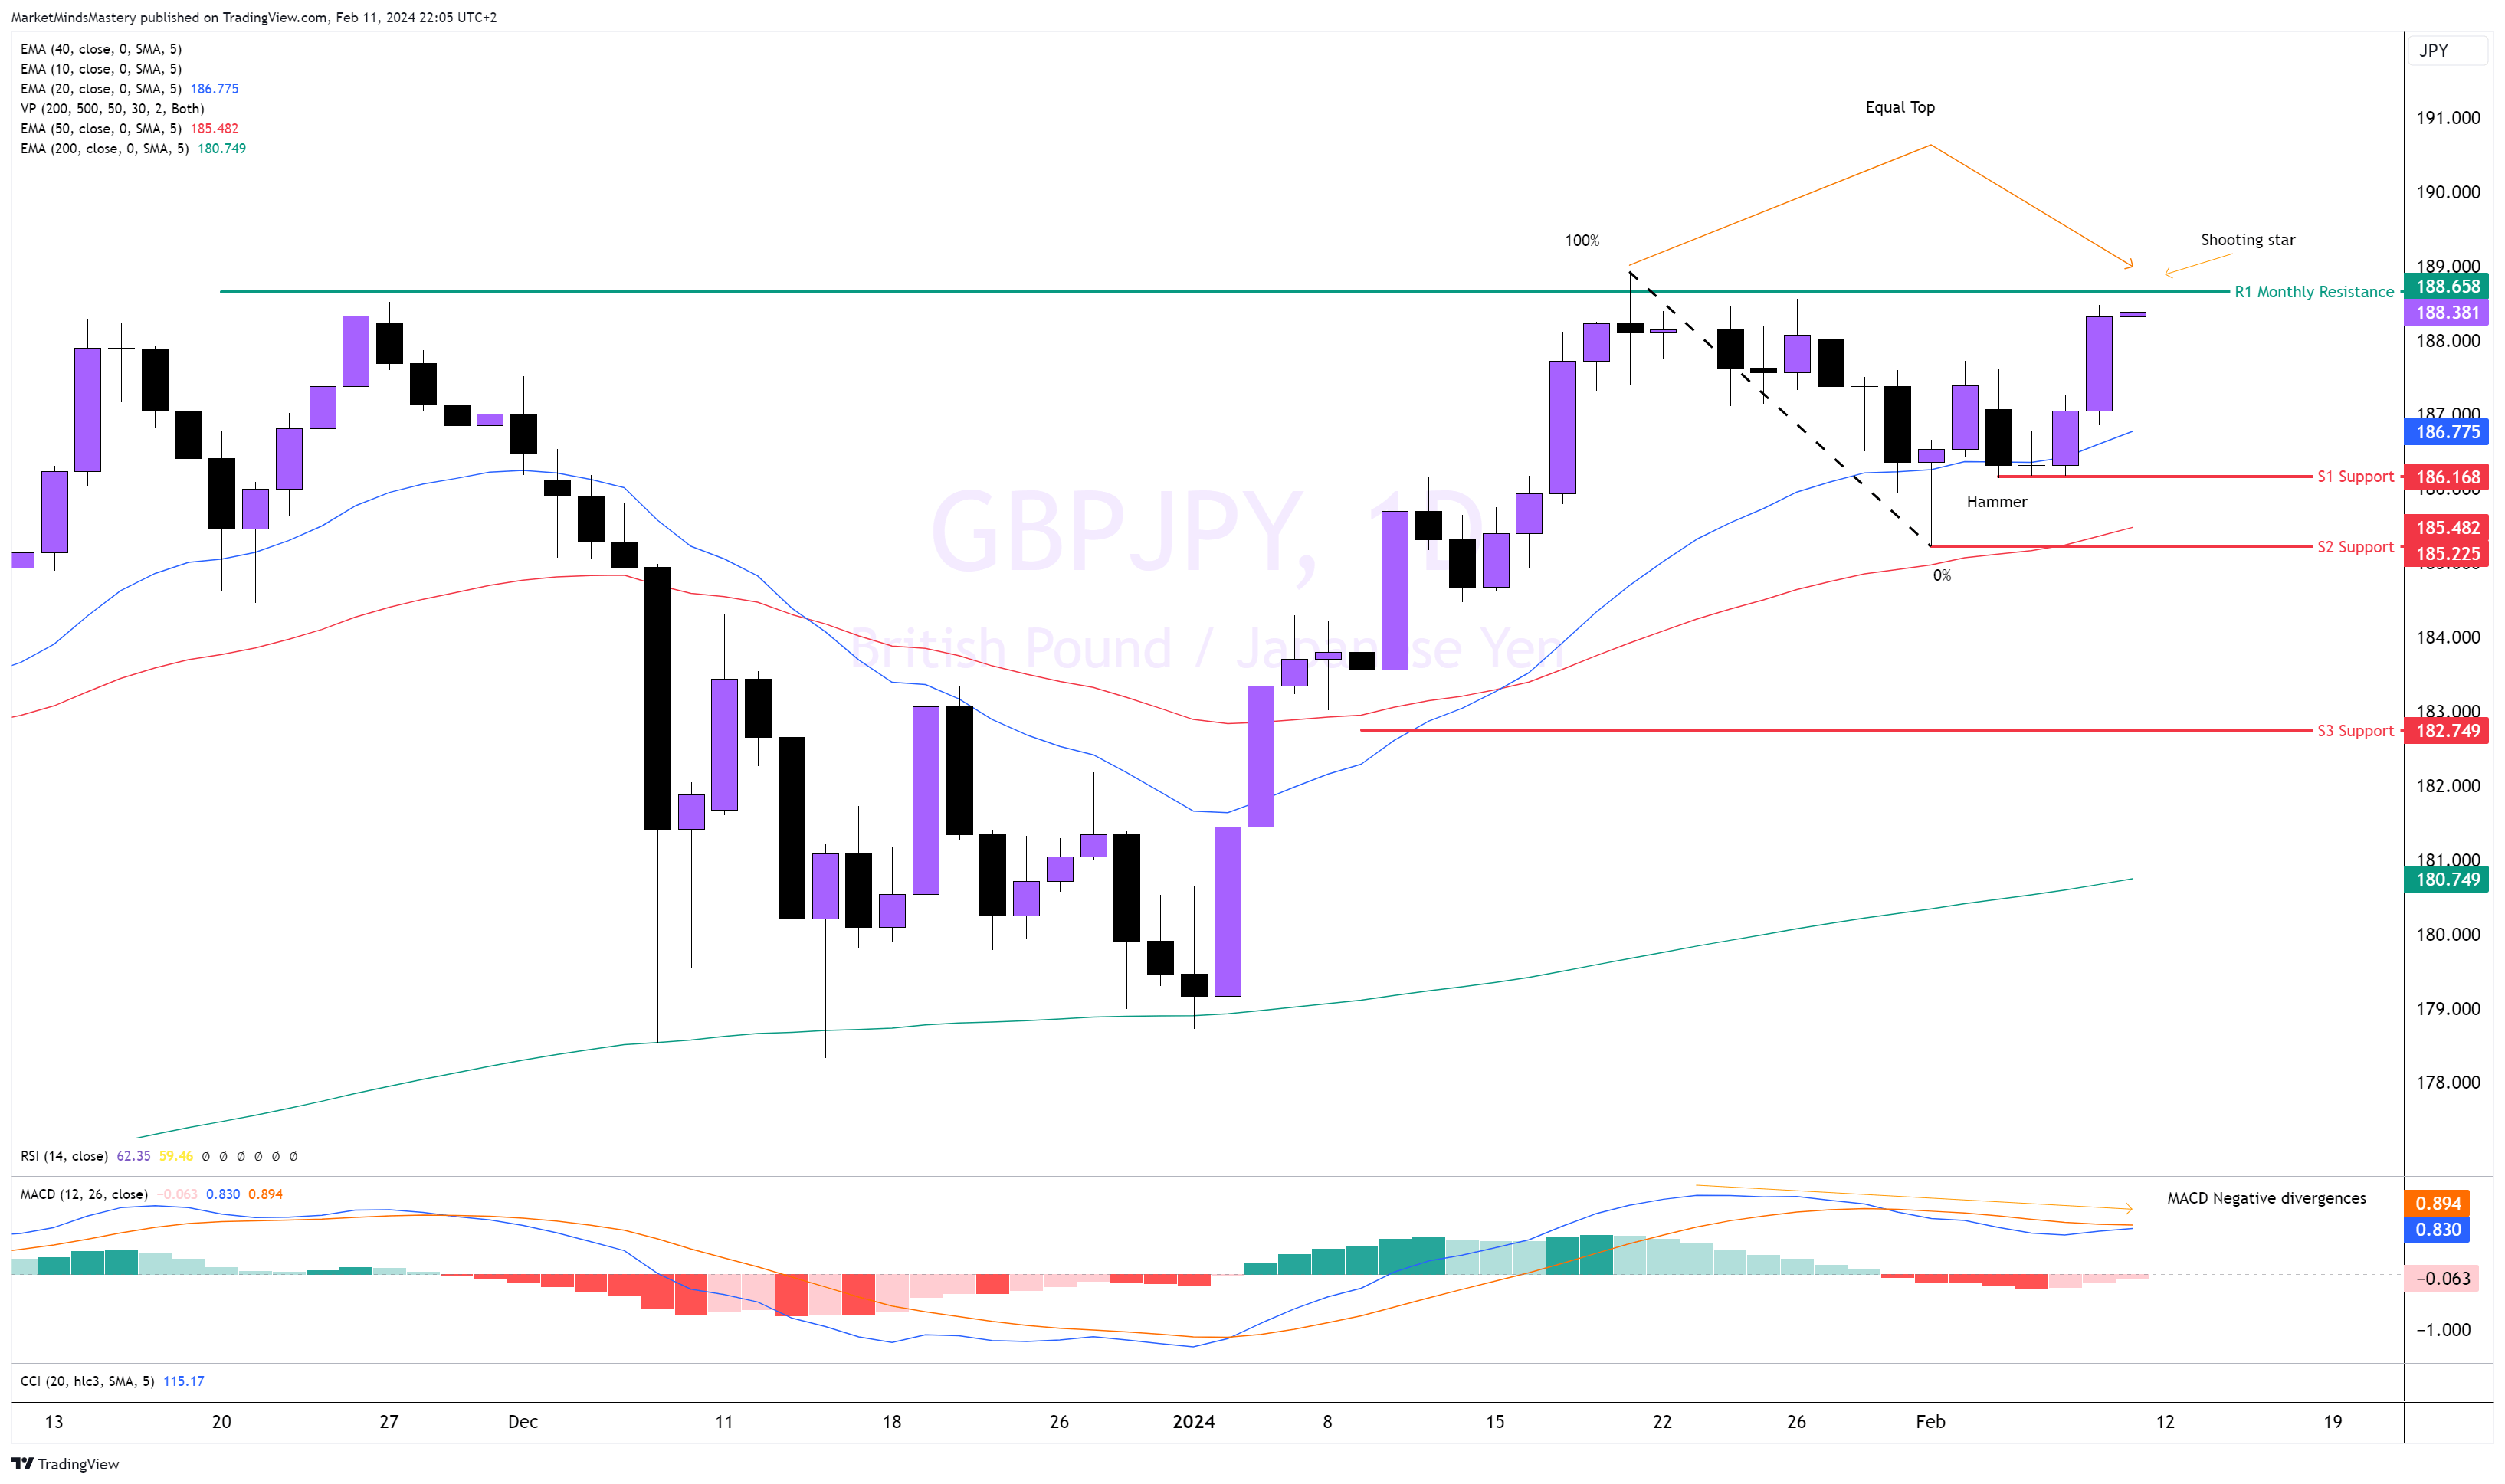
GBPJPY Daily
The price recently tested the 188.65 level and was rejected three times. Following the bullish hammer price action, the price moved upwards until the monthly level of 188.65. The price didn’t manage to penetrate and closed above it last week, and a shooting star price action was created. At the same time, we see the MACD showing negative divergences, indicating a lack of bullish momentum. Therefore, the resistance held for the fourth time.
Additionally, the price formed equal tops. Traders must understand, at this point, that the equal top formation is not a double top yet. A double top is a price formation confirmed after the S2 support penetrates, which, in this occasion, the S2, is the neckline of the potential Doube top reversal pattern. If the price declines and moves lower, the first support, S1, is approximately 186.168. A further decline can lead to the next support, S2, around 185.225. The 50-period MA can also act as a dynamic support in this area. Conversely, if the price moves upwards and penetrates the R1 resistance, we estimated the next resistance with the Fibonacci extension of 200% around 192.555.
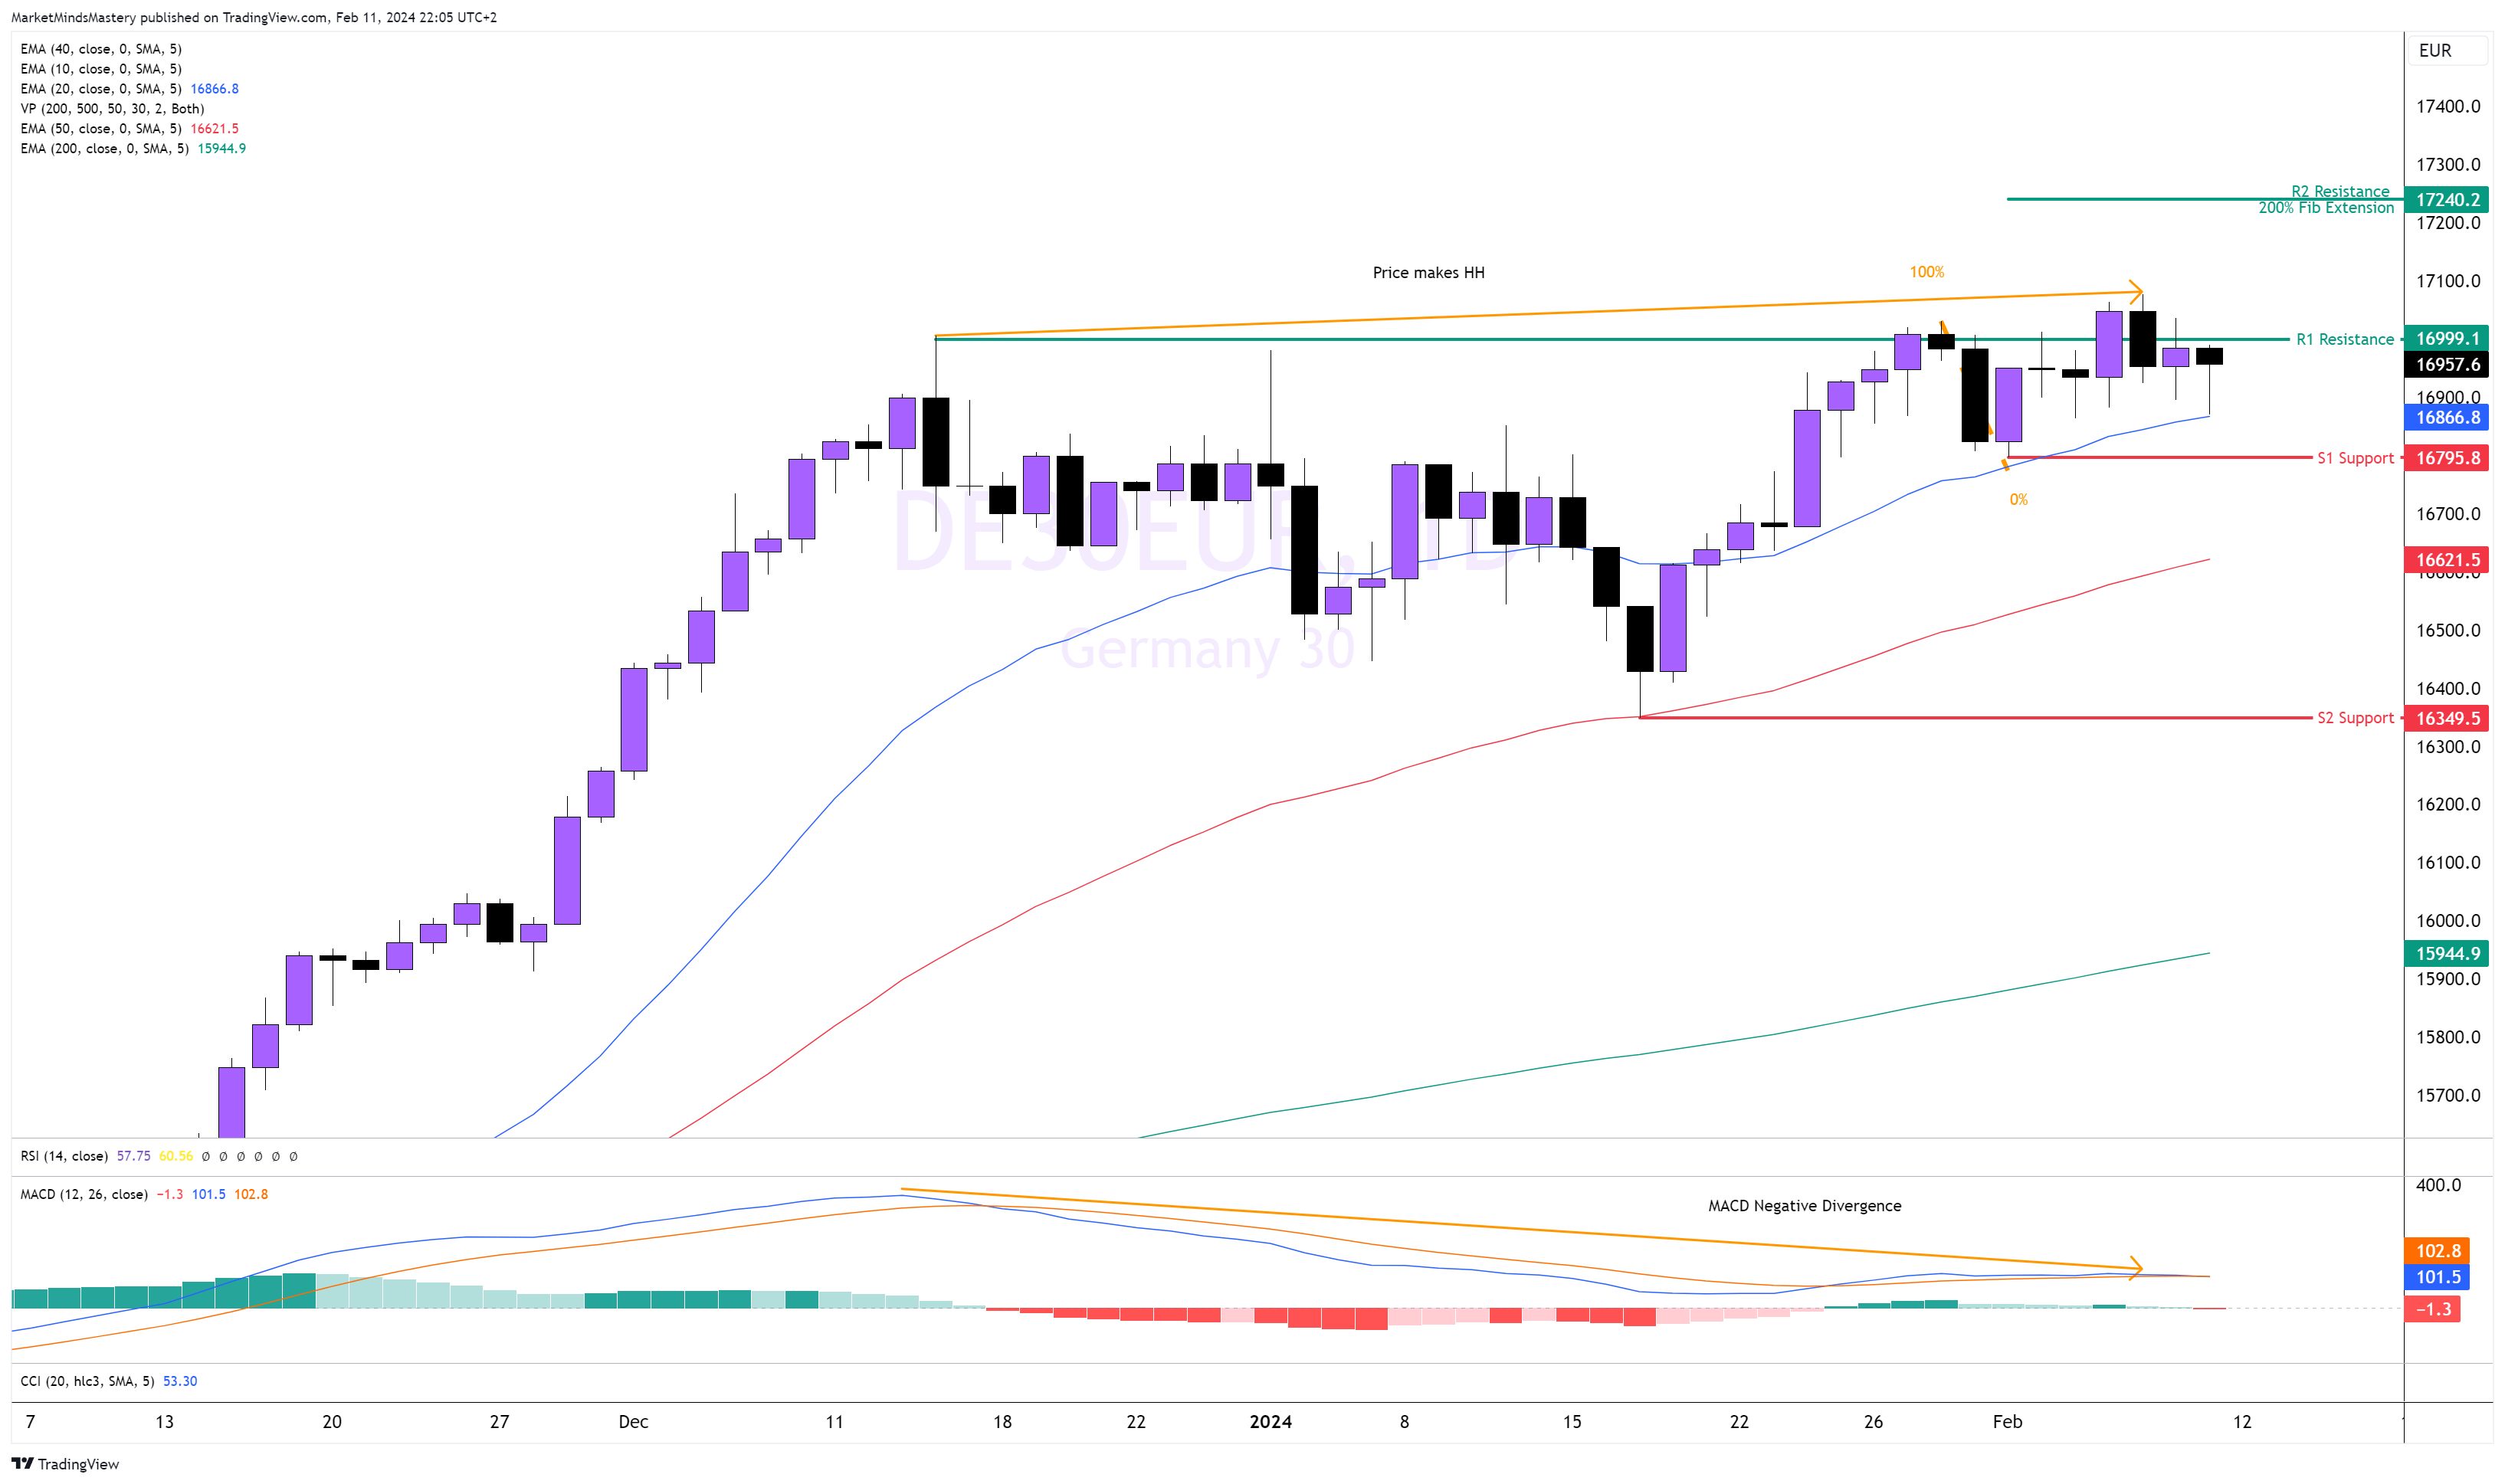
GER40, Daily
The price of the German Indicie is rising with a series of higher highs and higher lows. Overall, this is a rising market. The MACD printed bearish or negative divergences on this last recent peak, indicating that the price keeps rising with less momentum than the previous impulsive upward move. This can put the price in a short-term correction. However, the price is still in an uptrend. It also holds above the 20-period moving average, which is bullish, and the market structure didn’t break. Therefore, if the price keeps rising, the next resistance area can be estimated using the 200% Fibonacci extension as the price is at its all-time high, without having any reference to the recent past. Opposivly, if the price declines and moves lower, the first area of support, S1, was founded around 16795. If the price penetrates the S1 and moves lower, the next support, S2, can be the 16349.
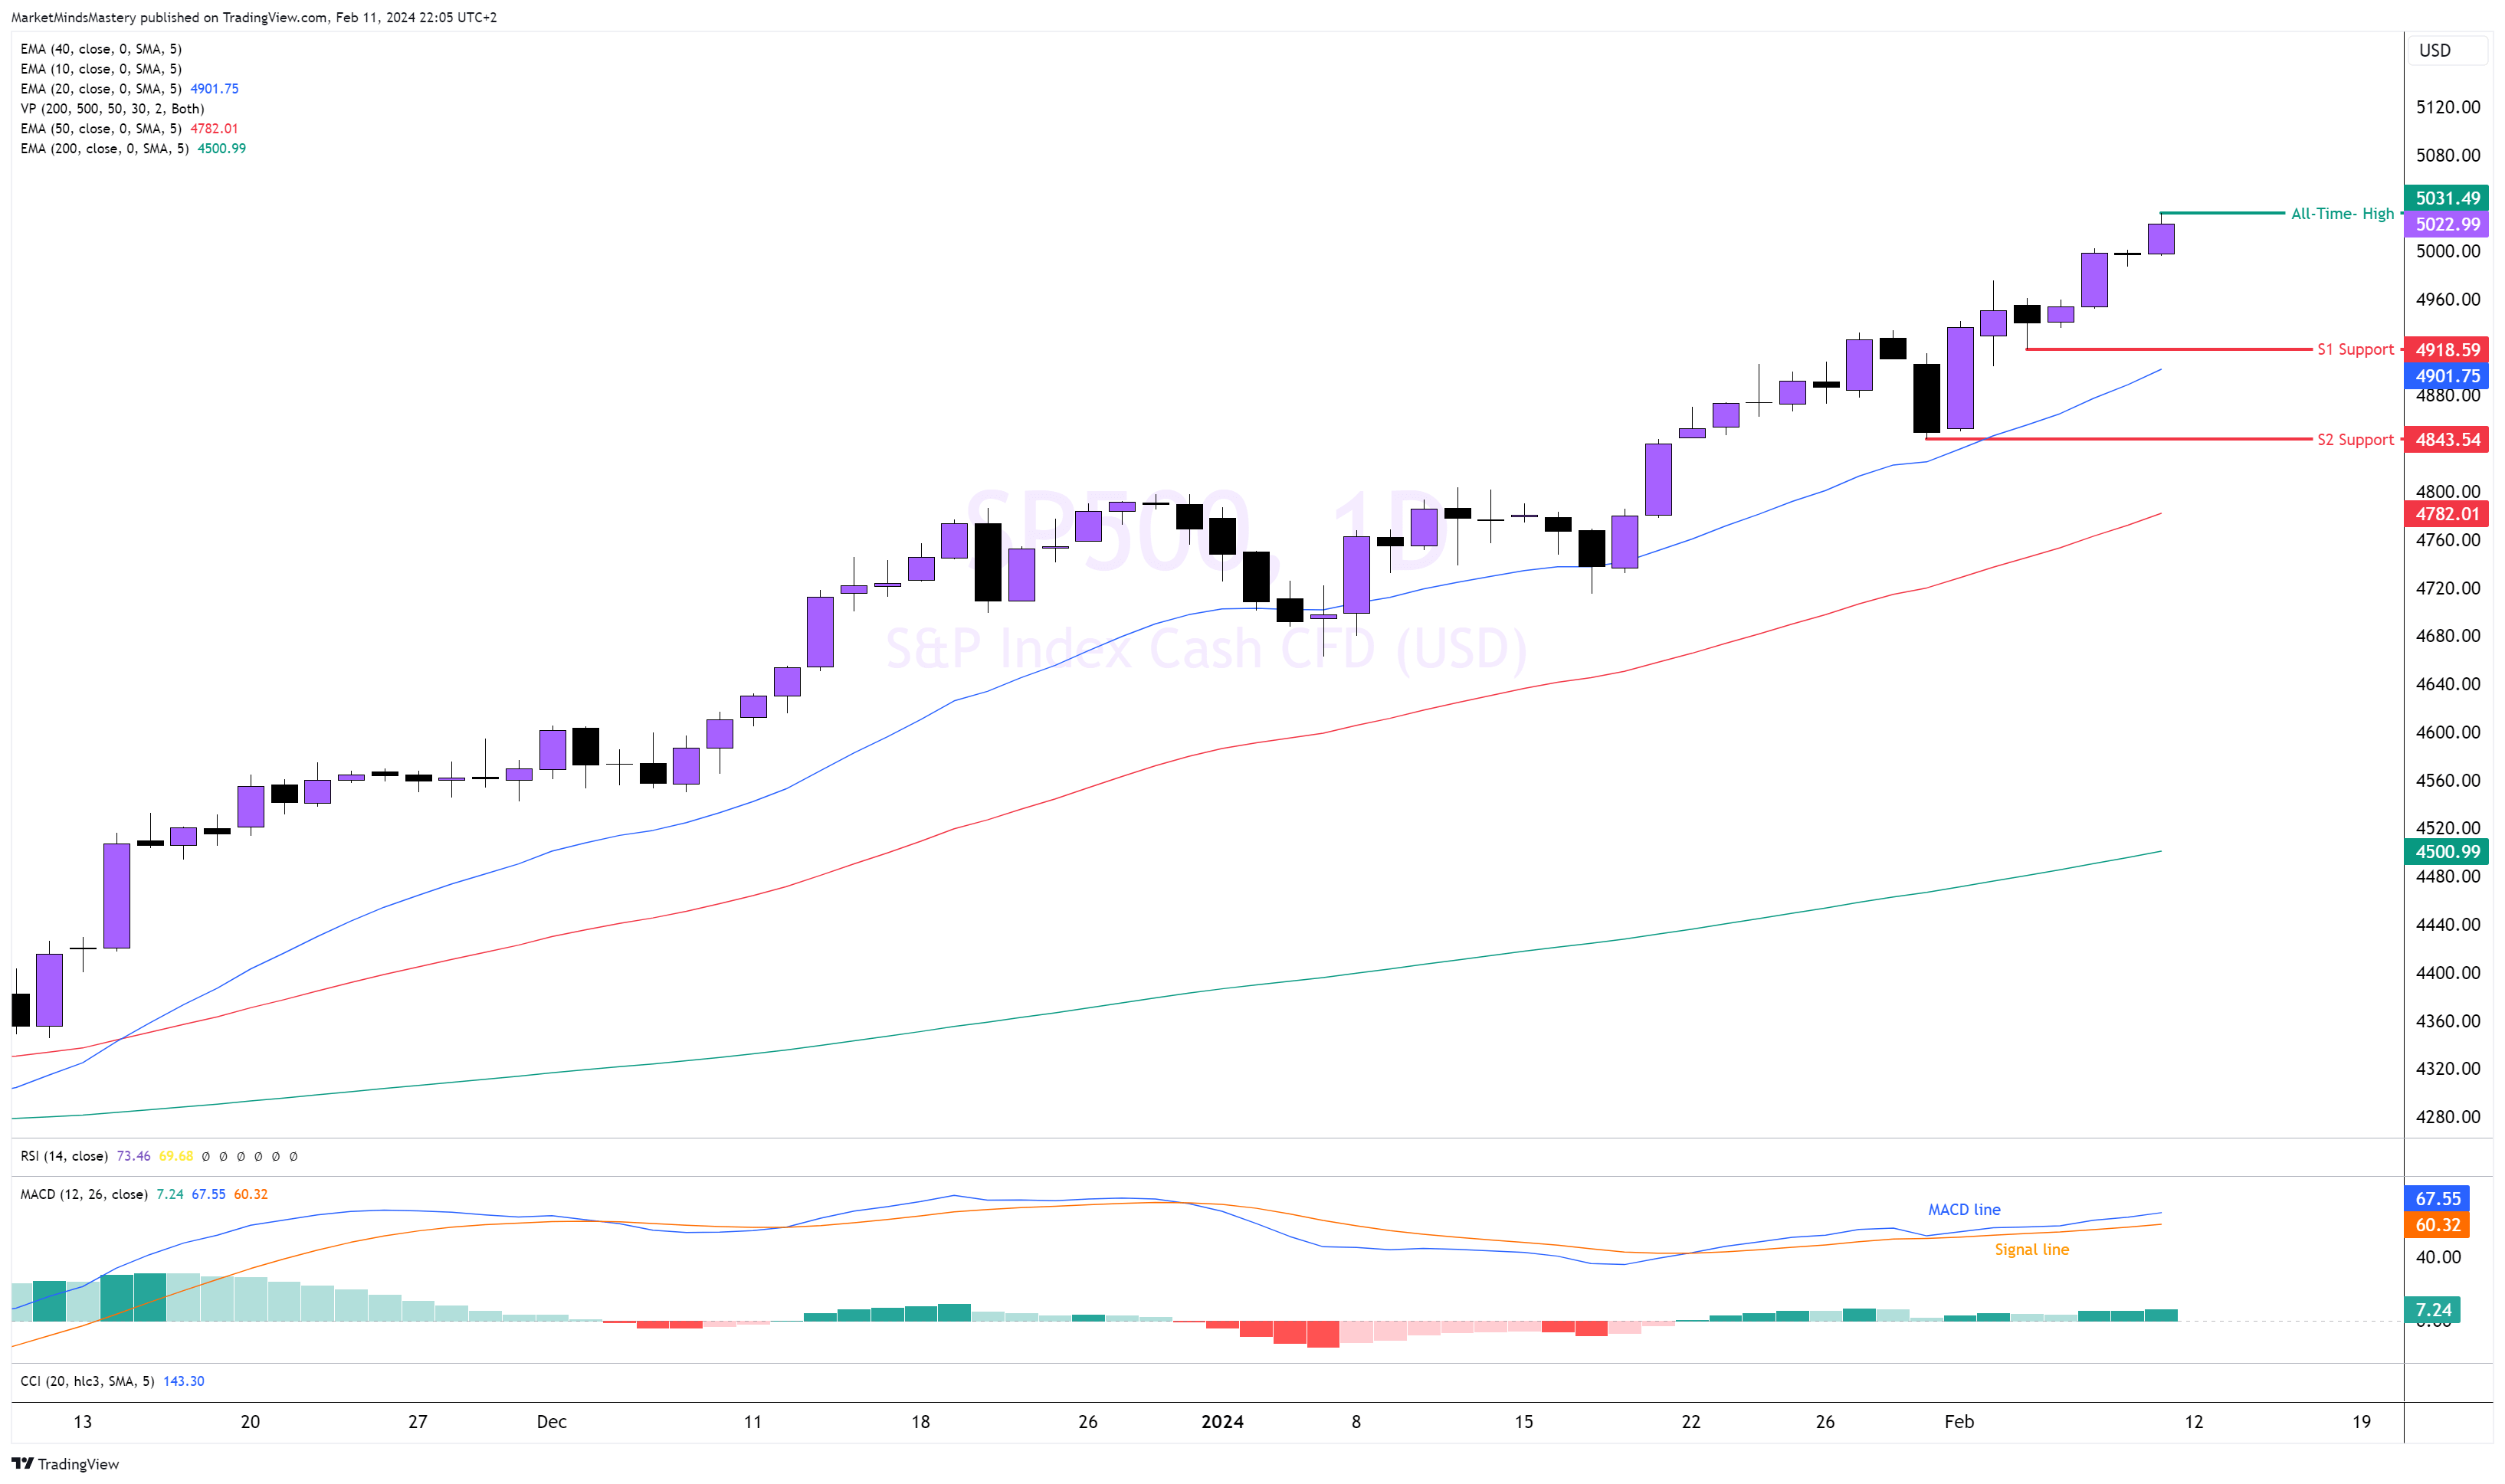
SP500, Daily
The SP500 set a new all-time high last Friday, as it did last week, and the index reached the 5031 area. The market is still in a well-defined and established uptrend. All three moving averages are in order, with the 20-period remaining above the 50 and the 50 above the 200. All three are well separated, and this is a bullish indication. The MACD line (blue colour) is above the signal line (orange colour), and both are above the zero line, which is also bullish. The price action on the chart prints long bullish candles, indicating the buyers mainly dominate this market. Retracements are shallow and short in duration, as per the black candles.
If the price keeps rising, the market will continuously create an all-time high price. If it declines, the first support was found to be the S1, approximately 4918. A further move lower, find the S2 support around the 4843.
US30, Daily
Following the upward move on the US30 that started four months ago when the moving averages crossed, the price is steadily rising with a series of higher highs and higher lows—also, all three moving averages, the 20, 50 and 200, point upwards. The MACD is above its zero line. All these are signs of a bullish market. Last week, though, the price reached an all-time high, but the MACD didn’t catch up. Therefore, a bearish divergence is shown on the indicator, showing exhaustion during the last upward move. A shooting star reversal candle appeared last Friday around the 38782. If the price declines, the first area of support, S1, is approximately 38103, slightly above the 20-period moving average. A further decline from that level finds the next support, S2, around 37822. If the price rises and penetrates the high of the shooting star candle, it will print a new all-time high.
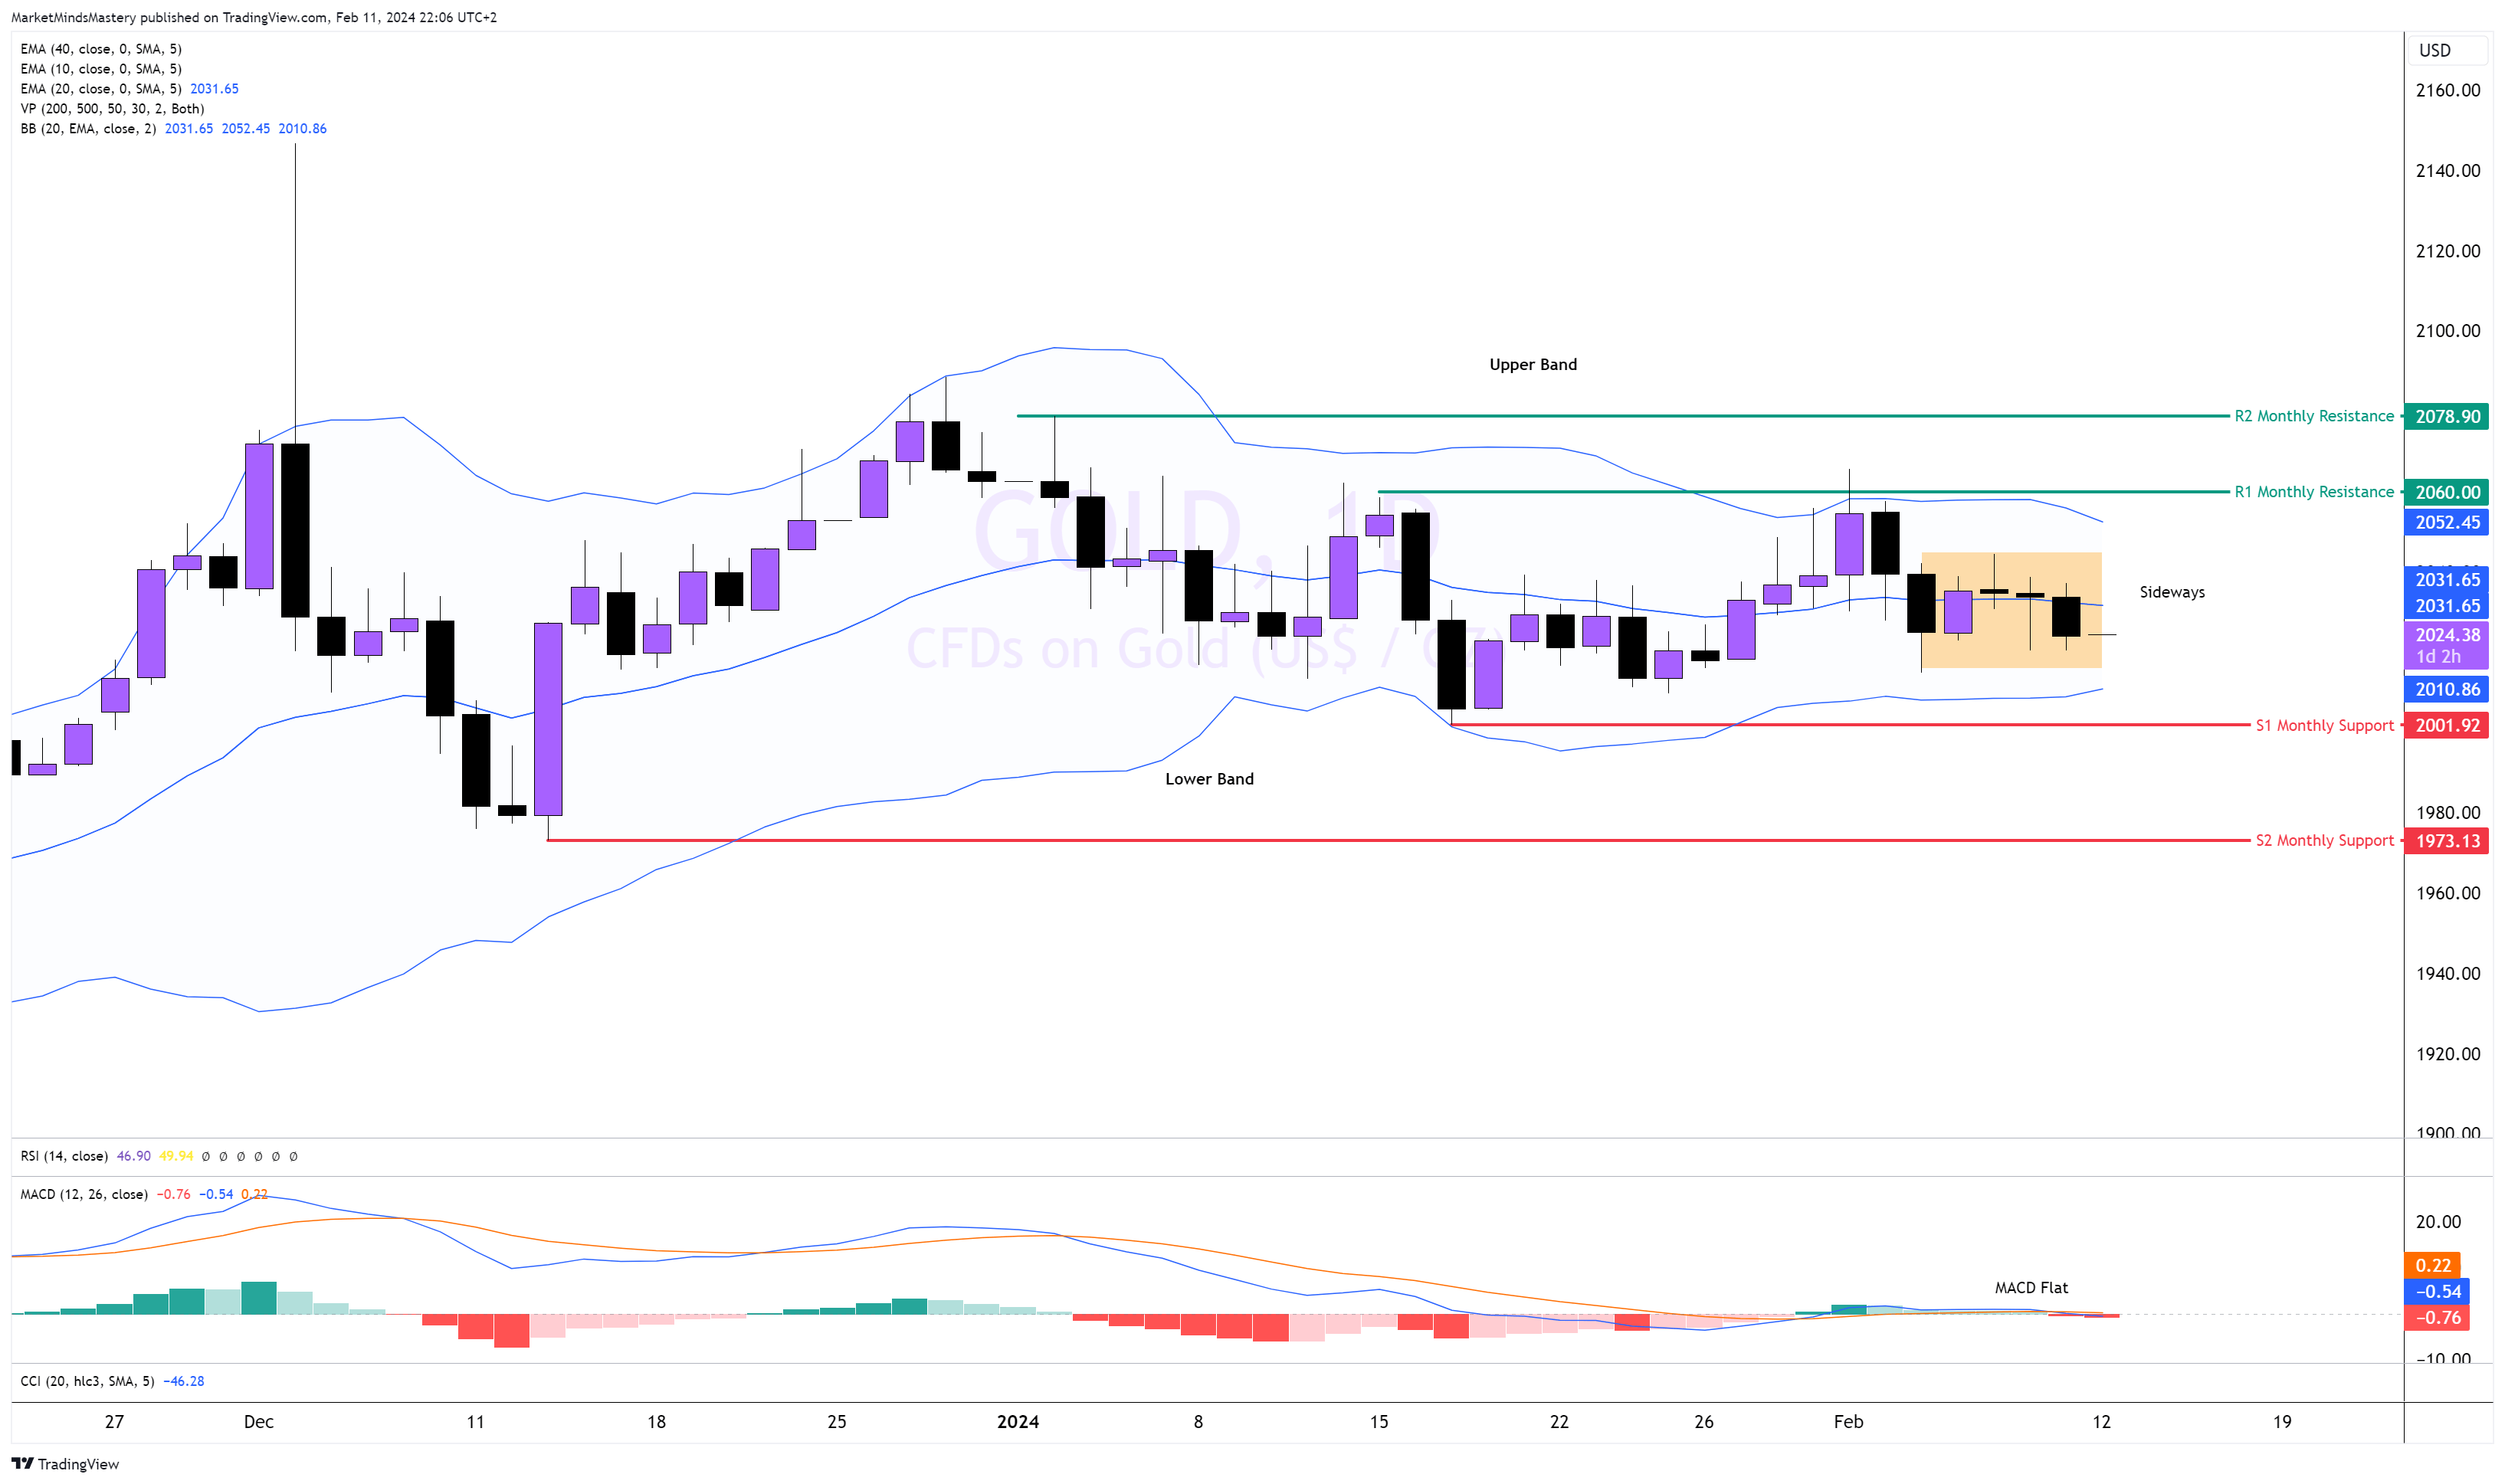
GOLD, Daily
Following the macroeconomic news from last week, Gold entered into a consolidation/ trendless phase. The price is still hovering around the 20-period moving average of the Bollinger band. The upper and the lower bands are flat, and the MACD is flat around the zero line. All these show the price is indirectionless. Therefore, if the price moves lower this week, we will find the first support, S1, around 2000. A level is a round number; traders usually look to trade from this level as they expect directional moves. If the price breaks below the S1 and moves lower, the next support area, S2, is around 1973. Oppositely, if the price moves upwards, the first area of resistance, R1, becomes the level around 2060. A close above it and a move upwards can find the next resistance, R2, approximately at 2078. This monthly level can attract a lot of order exchanges between buyers and sellers.
USOIL, Daily
The price of the USOIL is traded above the 50-period moving average. The market is bearish as the 50-period is below the 200-period moving average. A few weeks ago, the price was rejected once it interacted with the 200-period moving average. The upward movement of the price establishes an intermediate upward trendline T1. Based on all these, the primary trend is down, and the intermediate is up. The Commodity Channel Index (CCI) is above zero, and it is bullish. The 200-period moving average is the first dynamic resistance if the price continuously moves upwards. A further rise finds the Monthly resistance, R2, around the $79. If the price penetrates the recent swing high and moves upwards, the next resistance will be around $80. Conversely, if the price moves lower and closes below the 50-period MA, the upward trendline T1 can act as support. If the price decisively penetrates the T1, the first static support, S1, is the area around $70.
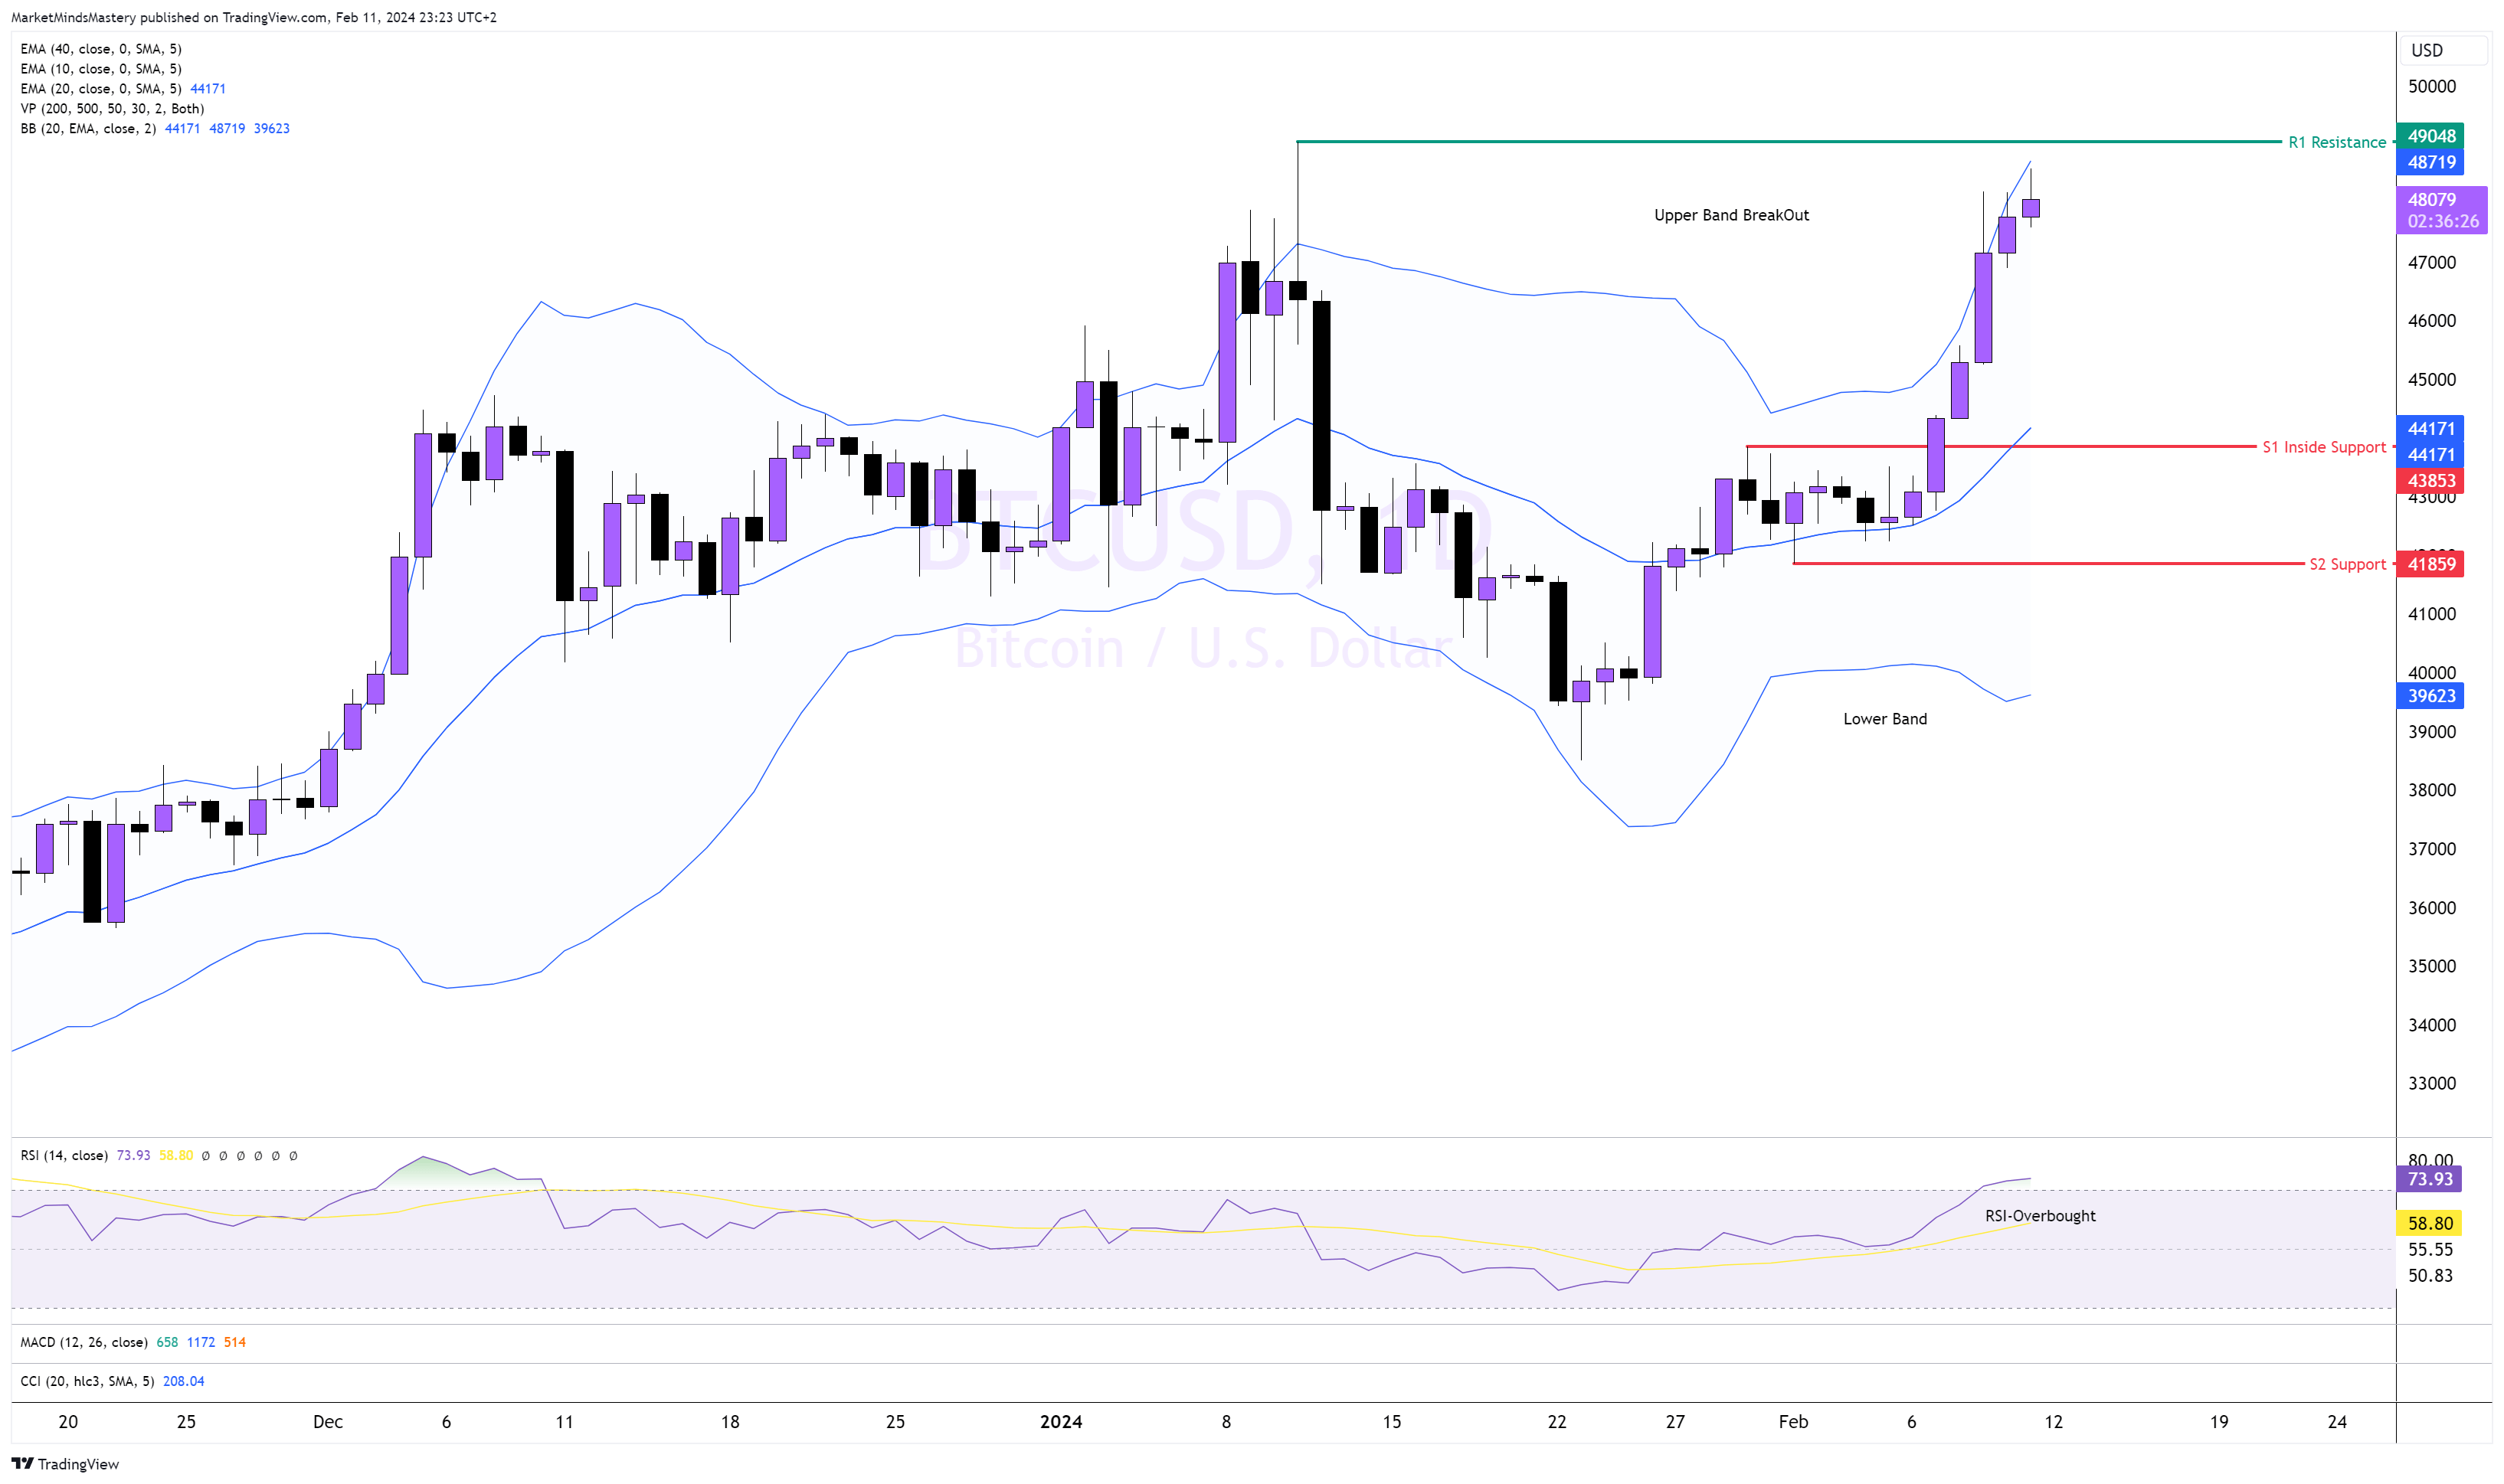
BTCUSD, Daily
Following the sideways move, the price traded between $42,000 and $43,500. The price broke out and moved upward since last week's trading, currently very close to $49,000. The price is “walking the upper band, " showing buyers control the market. The RSI oscillator is overbought, indicating bullish bias. If the price continues to increase, the first resistance, R1, is around $49,000. A break and a close above it can push the price to the next area of resistance, R2, approximately $52,000. In case the price declines and moves lower, the S1 inside support is found to be the first support in the market at $43,850. If the price declines further, the next support area, S2, is approximately $41,850.
👉 Click here to check our Challenges
👉 Don’t miss our Free Live Webinars
👉Join us on Discord
Risk Disclosure:
The Trading Pit offers only demo accounts to all users within the Challenges and Signal Provider Agreements (Scaling Plan). All assets and trading activities are purely virtual. Please note that we do not offer CFD (Contract for Difference) challenges to residents of Canada and the United States. All content and information on this website is for informational purposes only and should not be interpreted as financial advice. Also, remember that results achieved in the past are no guarantee of future results. It is essential to understand the risks associated with trading. If you are unsure, always consult an independent financial advisor.