The Trading Pit Week Ahead Market Outlook (April 22 – April 28)
The US Dollar was the market's primary force last week. The positive impact was primarily the outcome of the Retail Sales report, as it exceeded expectations. The weakest currency was the GBP, which experienced a substantial decline primarily due to the increase in the unemployment rate and the drop in retail sales in the UK despite the positive Consumer Price Index number.
On Monday, there won't be any significant news events in the market.
On Tuesday, in Germany, the Composite PMI (Purchasing Managers Index) will be reported, with the previous report being 47.7. The Manufacturing PMI is expected to be reported at around 42.9, as per the consensus, and the Services PMI is expected to remain above 50. Later, in the Eurozone, the Composite PMI is expected to stay above 50, the Manufacturing PMI is expected to remain around 46.5, and the Services PMI to be around 51.8.
The S&P Global Composite, Manufacturing, and Services PMI in the UK are expected to remain above the benchmark 50. During the NY trading session in the US, the S&P Global Manufacturing and Services PMIs are also likely to stay above 50. These events are helpful indications of the business activity in their countries across different sectors, such as manufacturing and services. Generally, if the reports are above 50, it is considered positive for the currency, whereas if it's below 50, it's considered negative.
On Wednesday, banks in Australia will be closed due to Anzac Day celebrations. Despite that, the primary inflationary indicator, the CPI (Consumer Price Index), will be reported, and this time estimates a significant drop compared to the same period a year ago. The previous yearly report was 4.1%, and the consensus forecast a drop to 3.4%. If this drop occurs and the market follows through, significant weakness of the AUD is expected to be seen on the chart. Considering the current strength of the US Dollar, the AUDUSD pair can experience significant moves primarily to the downside.
On Thursday, the GDP (Gross Domestic Product) in the US for the first quarter will be the only significant news event for the day. The previous report was 3.4%. This time, the consensus estimates a drop to 2.1%. As GDP measures the value of final goods and services produced in the United States, it is one of the most popular indicators of the nation’s overall economic health. Usually, this first-quarter report is significant as it estimates the primary market mover compared to the second and third releases, which are generally not significant enough to alter the growth picture meaningfully.
On Friday, the last trading day of the week, the Japanese yen will be focused on as the Bank of Japan reports the interest rate decision. Currently, the Interest Rates in Japan are at 0%, and as per the forecast, the BoJ is likely to keep them the same. During the day, the BoJ Monetary Policy statement will be released, and there will be a press conference. The last significant event affecting the Japanese Yen will be the CPI (Consumer Price Index), which is currently at 2.6%, and the expectation, as per the consensus, is to drop to 2.5%. If the BoJ keeps the Interest Rates unchanged at 0% and the CPI number drops, there is a high chance of weakness in the Japanese Yen. Therefore, potential bullish opportunities on the USDJPY may arise.
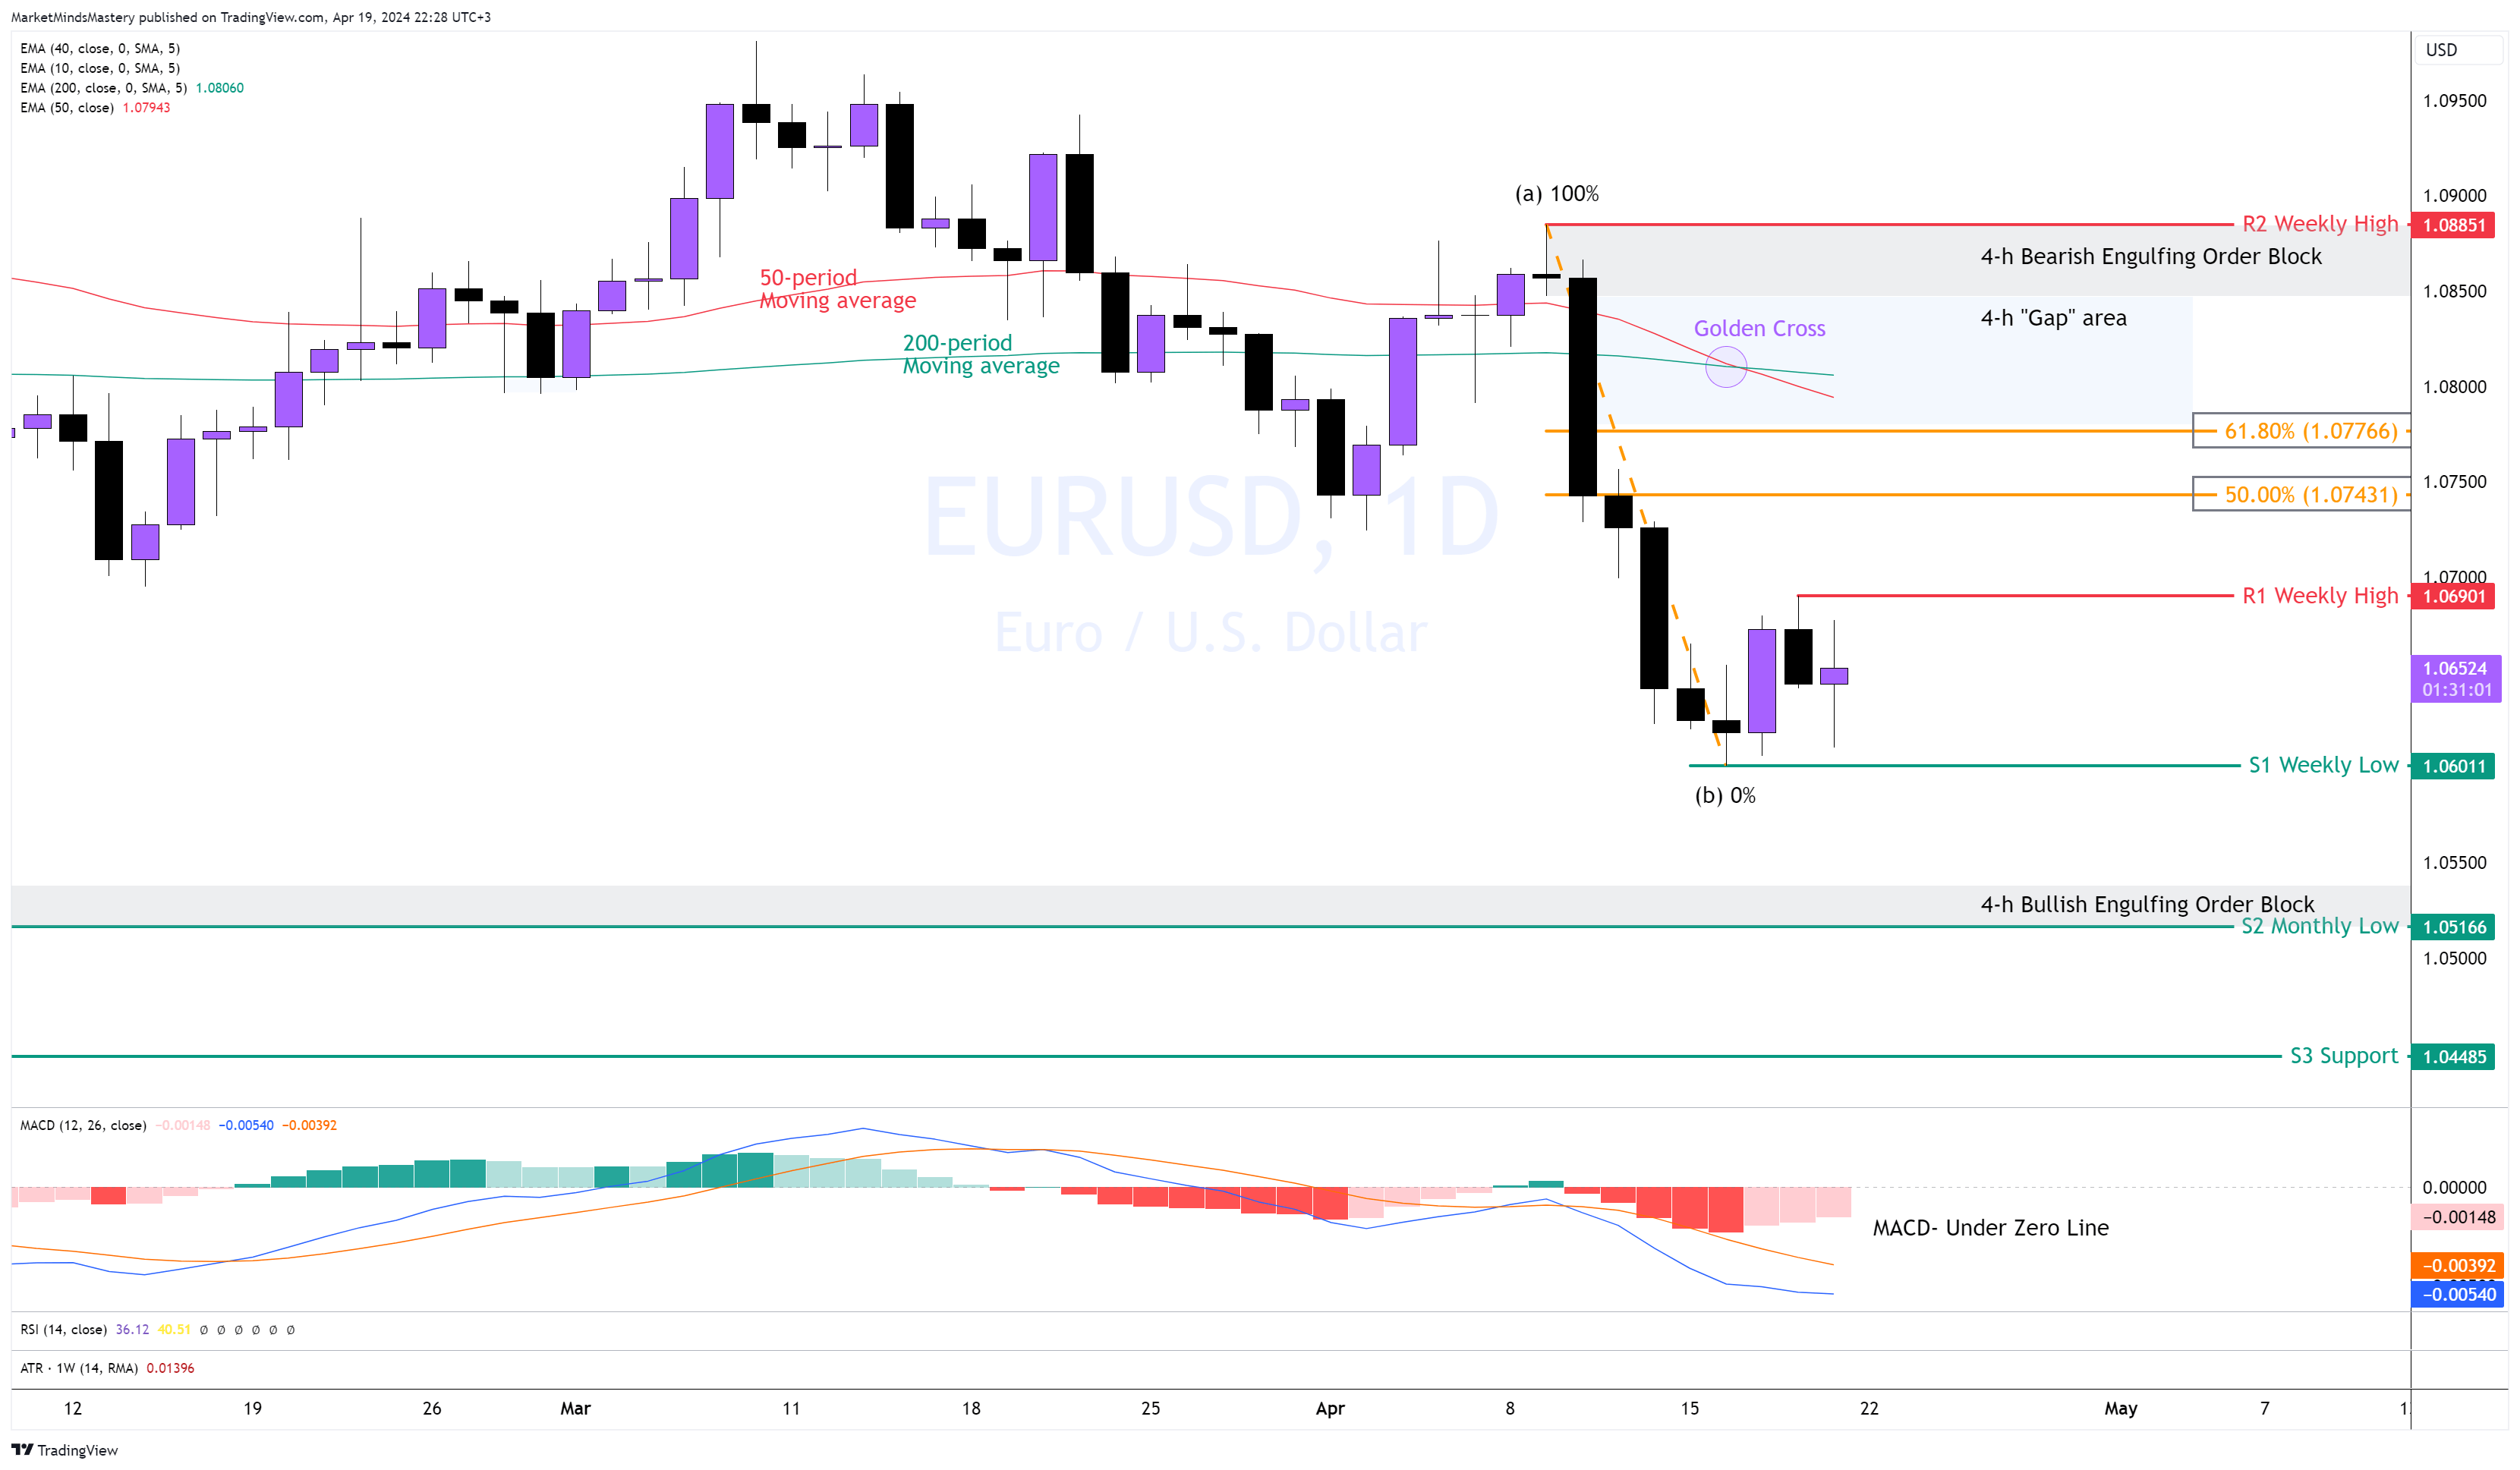
EUR USD, Daily

Following the Bearish Engulfing candle printed two weeks ago on the weekly chart, the market ended with a doji candle in approximately the 80 pips range last week. It signifies that selling pressure in the market wasn't sufficient to sustain the bearish momentum. Consequently, the price on the daily chart traded within a narrow range.
Once the 50-period moving average crossed under the 200-period moving average, the Golden Cross indicated bearishness in the market.
Additionally, the MACD is trading below its zero line, with the MACD line below the signal line, indicating bearishness.
If the price continues downward, the first area of support, S1, is the previous week's low, around 1.0611. A penetration of S1 and a lower move could lead to finding support at S2, a monthly low at approximately 1.0516, with a 4-hour Bullish Engulfing Order Block forming.
On the other hand, if the price finds support, bounce-off and moves upwards the first resistance level, R1, will be the previous week's high, around 1.0690. If the price breaks above R1 and moves higher, the moving averages can act as dynamic resistance, along with the Fibonacci golden ratio of 61.8% retracement from point (a) to point (b). If the price surpasses the Fibonacci levels, it may enter the 4-hour “Gap” area under the R2 resistance around 1.0850, which also hosts a four-hour Bullish Engulfing Order Block.
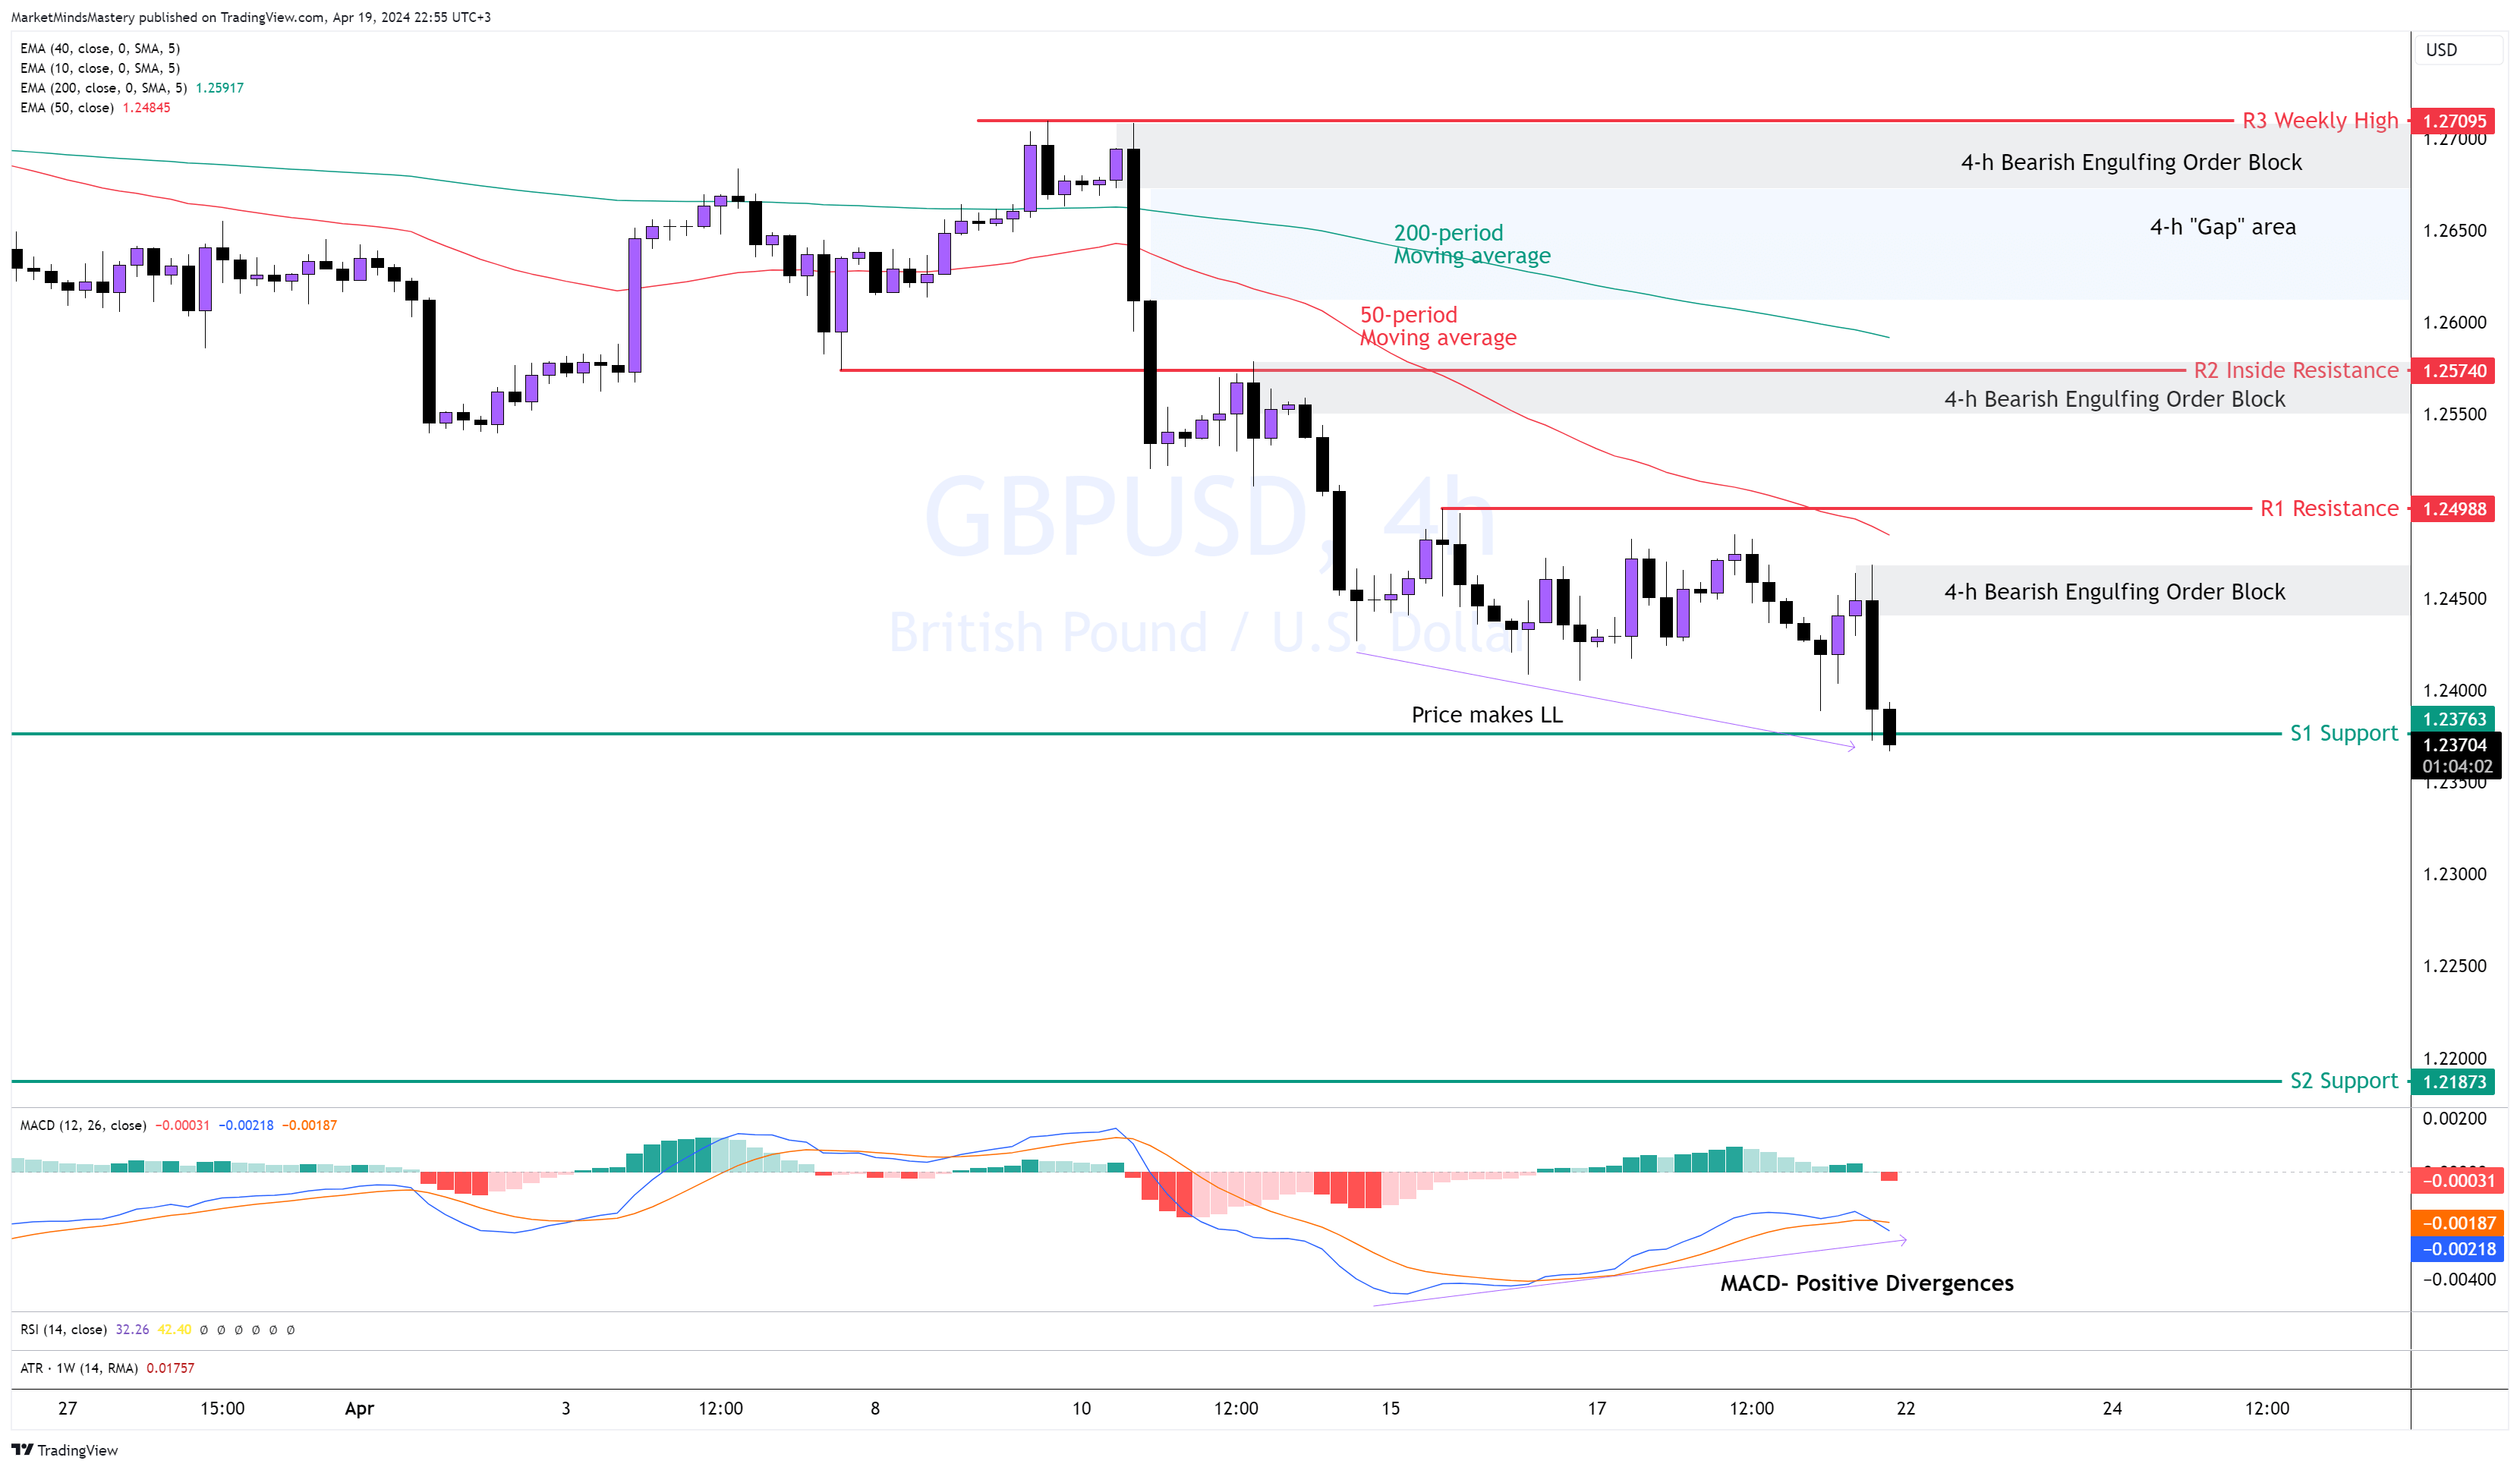
GBP USD, 4H
Even though the CPI numbers reported last week in the UK were positive, the GBPUSD pair dropped, indicating weakness in the Pound. The 50-period moving average is below the 200-period moving average on the 4-hour chart, indicating bearishness. The market forms lower highs and lower lows, another indication of a bearish trend.
On the other hand, the MACD shows positive divergences, indicating a discrepancy between the price’s direction and the indicators’ movement.
The price is around the S1 support area, approximately 1.2376. Starting Monday, if the price continues moving downward and remains below the S1 support, it could decline further until the S2 support around 1.22.
On the other hand, if the price finds support and moves upwards, the first area of resistance, R1, is around 1.2498. This static level includes the dynamic 50-period moving average, slightly below the R1 resistance. Additionally, there is a 4-hour Bullish Engulfing Order Block. However, if the price breaks above R1, close above it, and moves higher, the following significant resistance area is the R2, around 1.2574, coinciding with a Bearish Engulfing Order Block.
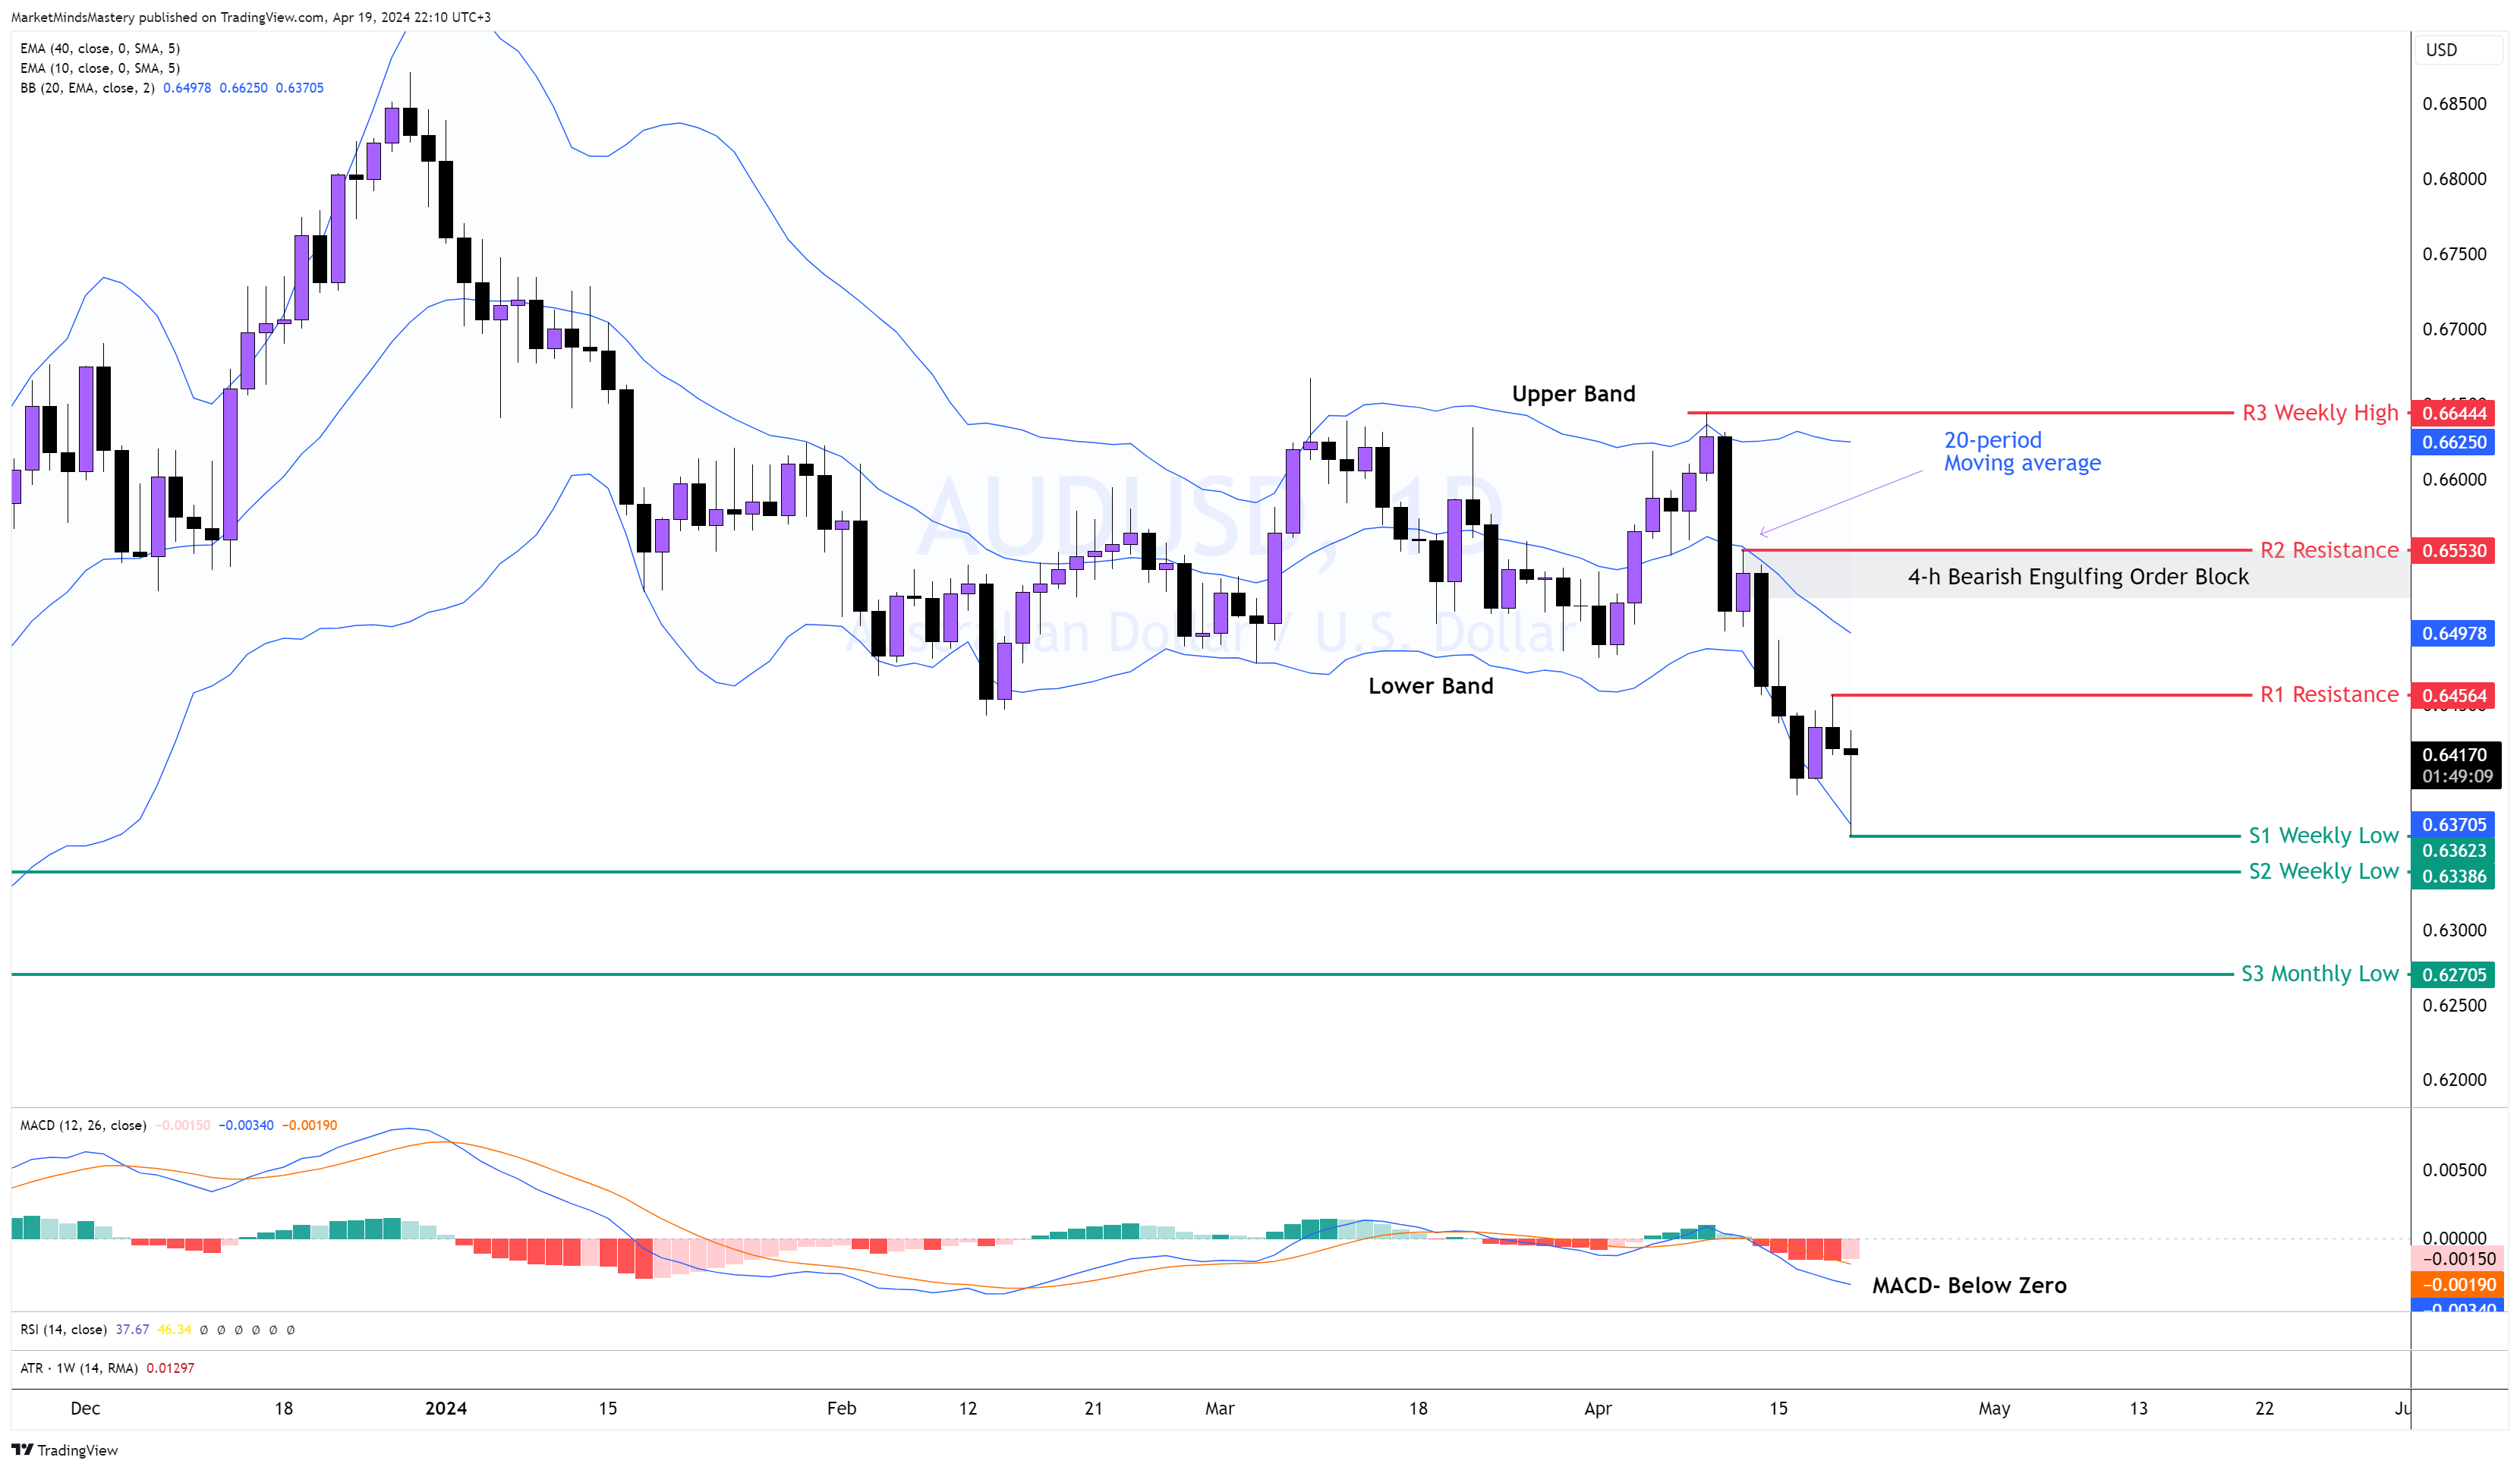
AUD USD Daily
Following the downward AUDUSD move, the price broke under 0.645 and continued moving lower. It hugged the lower band until the previous Friday when a long-legged doji/ dragonfly candle formed. We mark the low of this candle as the S1 weekly low, around 0.6362. The price has formed lower lows and lower highs, indicating bearishness. Also, the MACD is trading below the zero line, another bearish indication.
Starting Monday, if the price continues to move downwards, the first support area, S1, is the previous week's low, around 0.6362. If the price continues to move downwards, the following support area, S2, is around 0.6338, 20 pips below the S1.
On the other hand, if the price finds support, bounce-off and moves upwards, the first resistance area, R1, is around 0.6456. If the price breaks, closes above the R1 and moves upwards, the next resistance area, R2, is around 0.6553. These resistance levels are significant as a Bearish Engulfing Order Block coincides with the 20-period dynamic moving average.
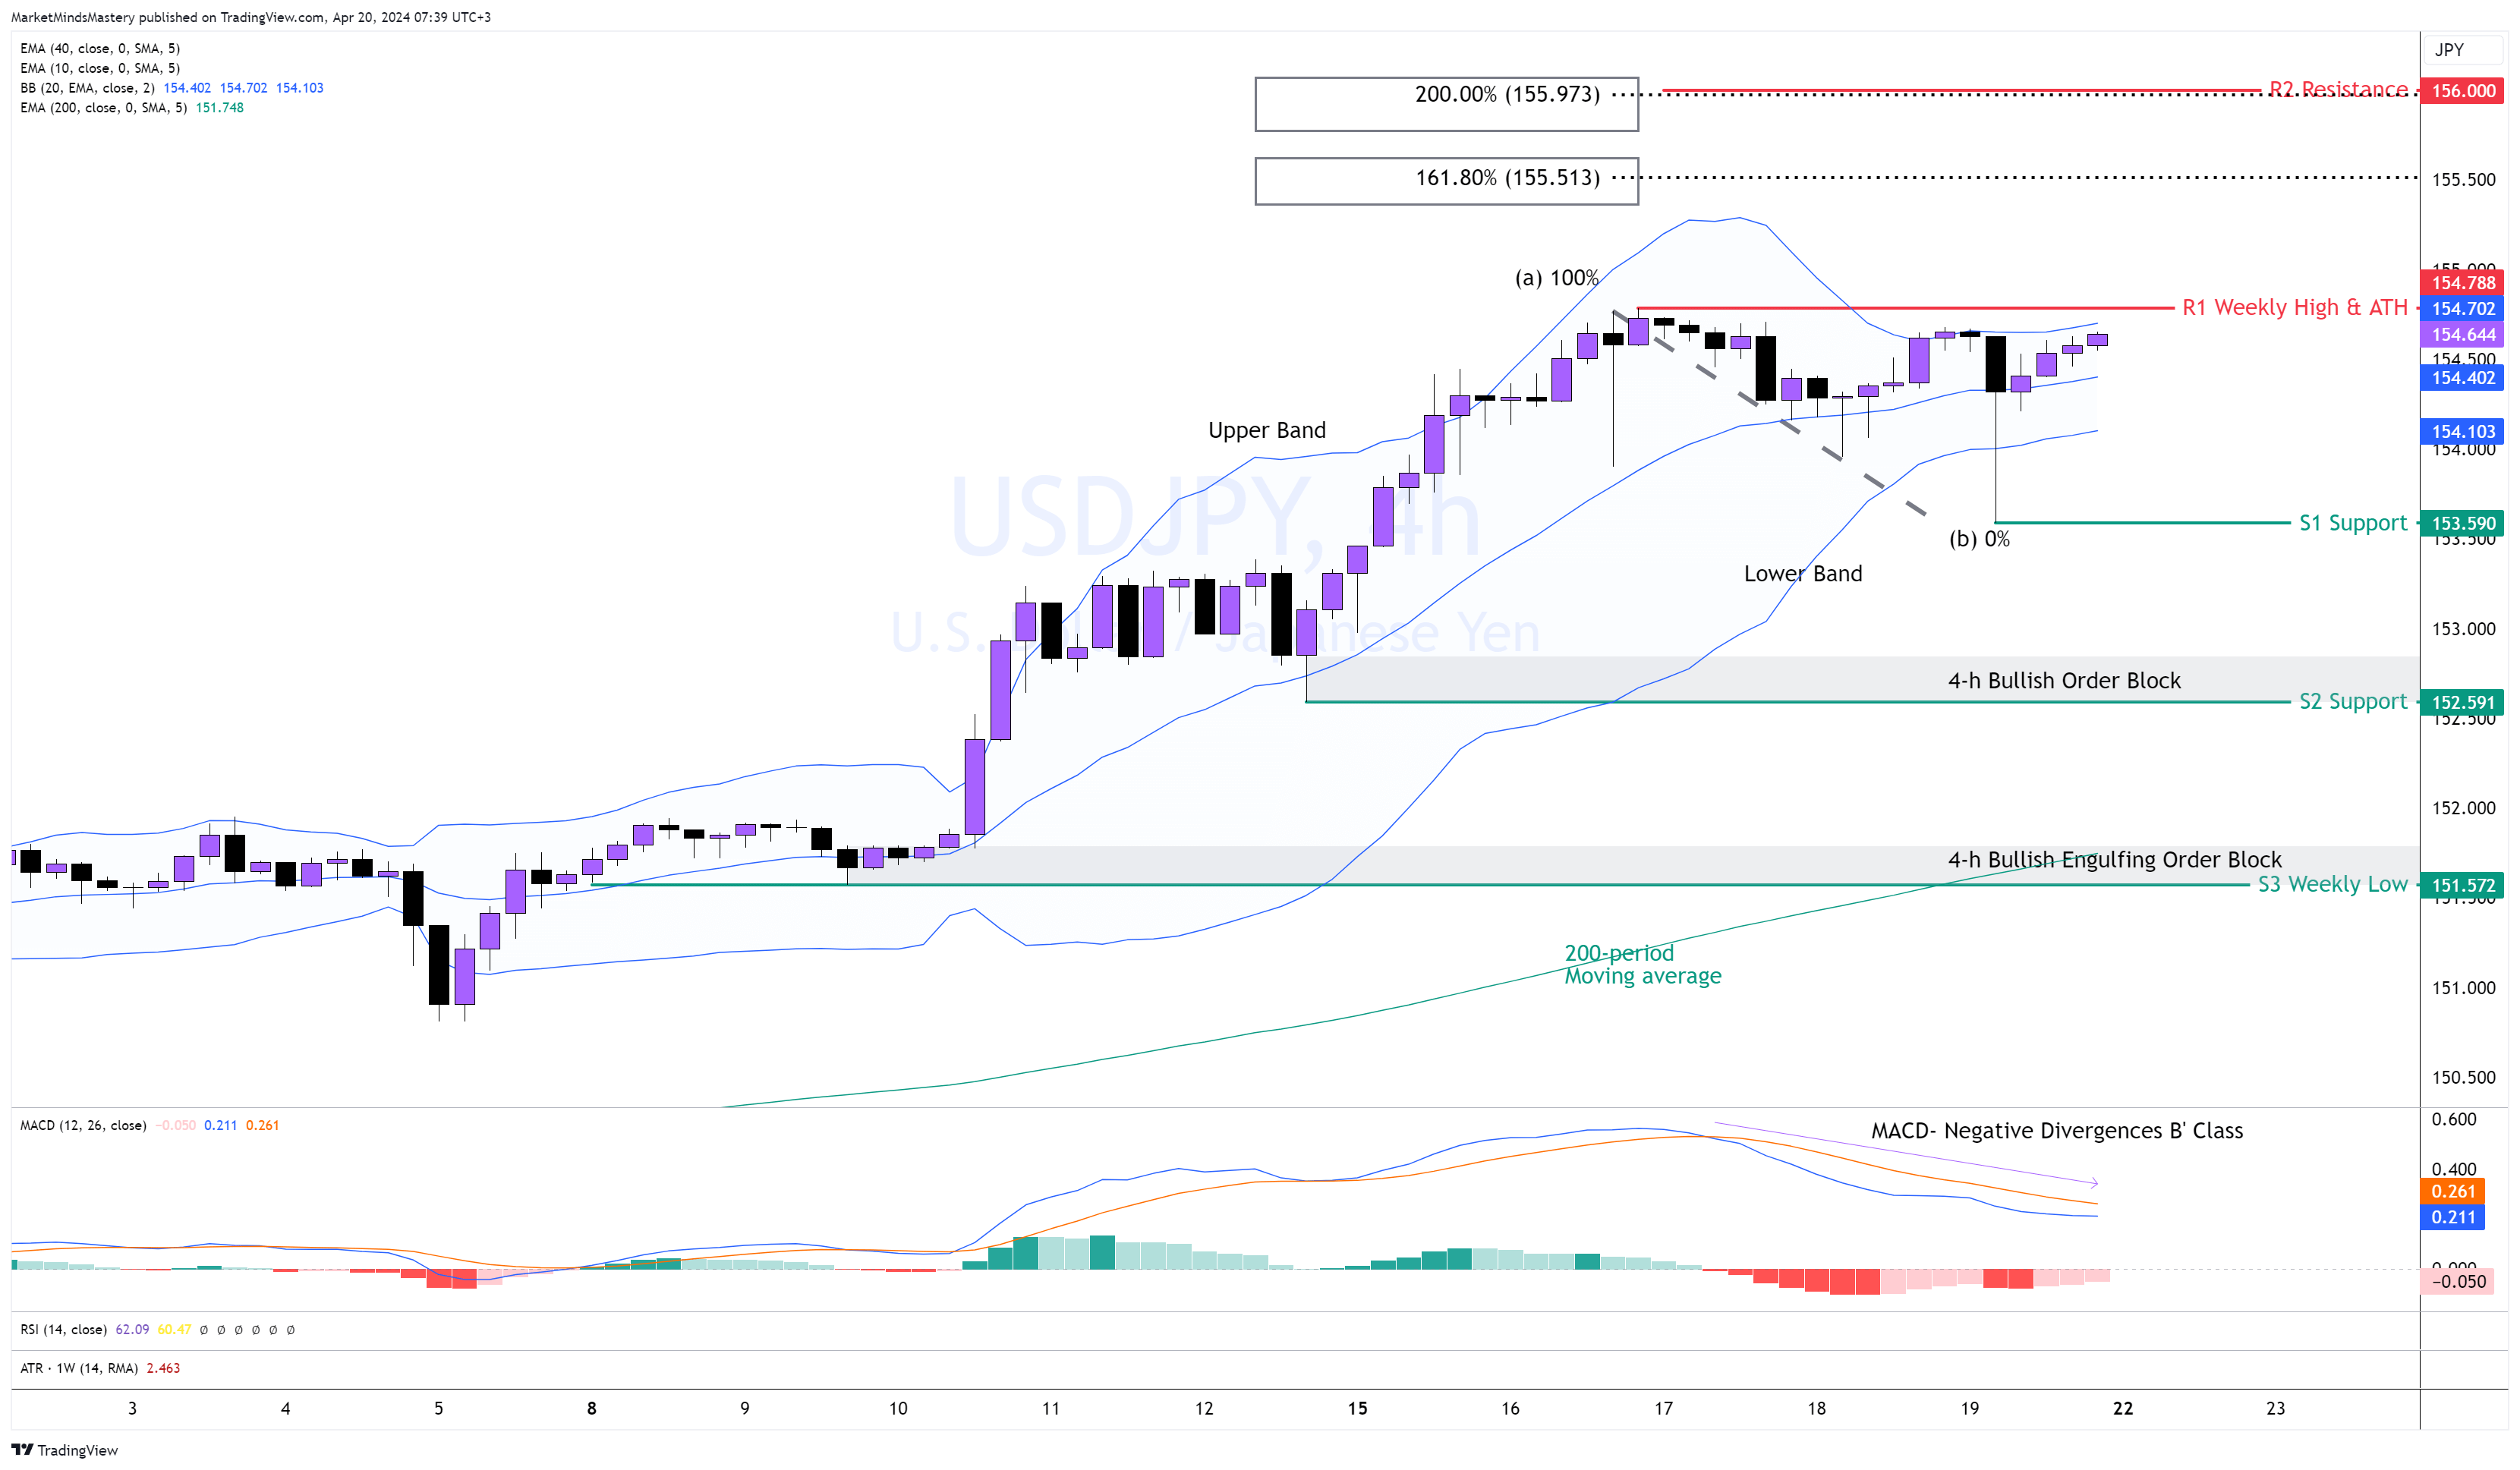
USD JPY 4H
The strength of the US dollar last week forced the USDJPY pair to move upwards, reaching a new All-Time High of around 154.78. During this upward breakout, the MACD showed signs of a healthy uptrend. Towards the end of the previous week, the price attempted to create a new upward move but ended up with an equal top around the ATH price. Therefore, the MACD printed negative divergences B’ class, indicating a weak upward move.
The price maintains its higher low formation, indicating that buying pressure is still in the market. Additionally, the price is contracting within the Upper and Lower Bands of the Bollinger Band indicator, called the “squeeze of the Bands”.
If the price increases, the first resistance area, R1, becomes the ATH around 154.78. We can use the Fibonacci extension if the price breaks and closes above R1 to find the following resistance levels.
We measure the swing from point A to point B to find the 161.8% and the 200% extension level, which can become the R2 and R3, respectively.
On the other hand, if the price declines and moves downwards, the first area of support, S1, is around 153.59. If it continues moving downwards, the next support area, S2, is around 152.59. A Bullish Engulfing Order Block rests on the 4-hour timeframe at this level.
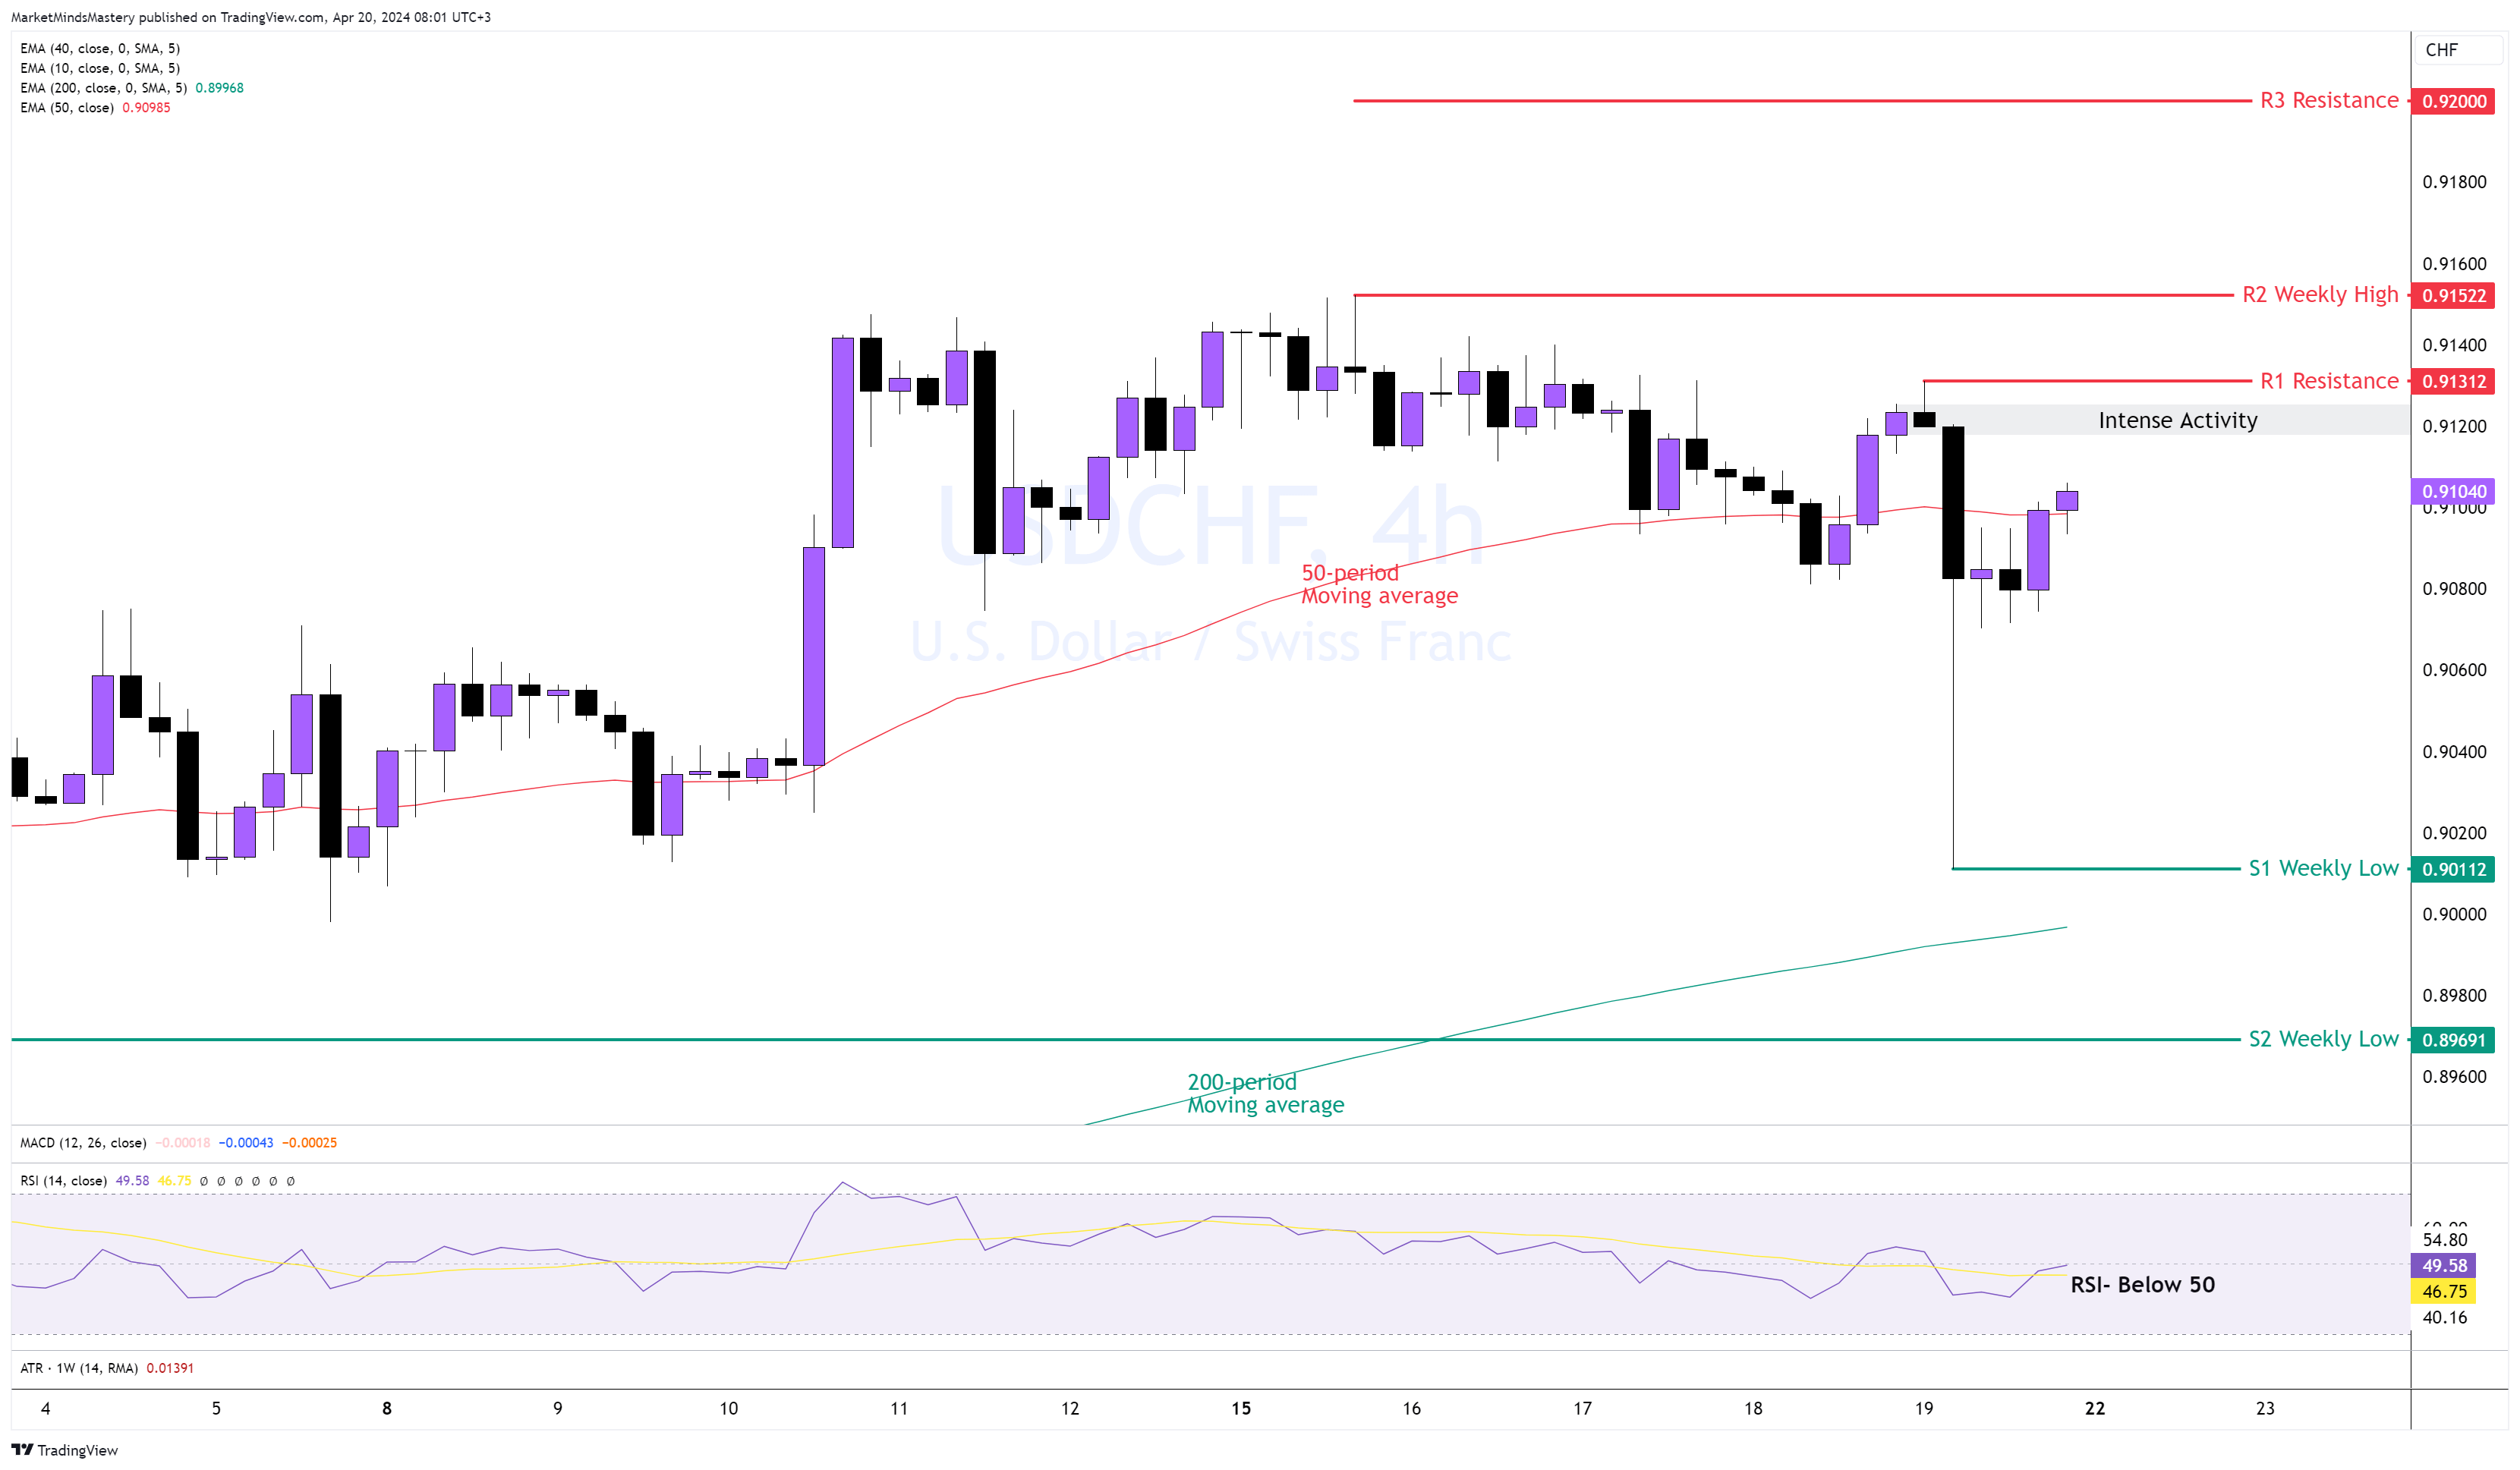
USD CHF 4H
The previous week’s candlestick pattern was a hanging man price action on the weekly chart, a strong reversal pattern typically found in an uptrend based on candlestick analysis. The massive sell-off occurred on Friday, creating lower highs and lower lows on the 4-hour chart, indicating bearishness. The RSI is below 50, which is a bearish indication. Even though the 50-period moving average is above the 200-period moving average and is a bullish signal, as we mentioned a few times, the moving averages are lagging indicators.
Starting Monday, if the price continues to form lower highs and lower lows in the 4-hour timeframe and moves downwards, the first support area, S1, will be the previous week's low at approximately 0.9111.
If the price closes below the S1 and continues its downward move, the next support area, S2, is approximately 0.8969.
On the other hand, if the price finds support, bounces off and moves upwards, the first resistance area, R1, is around 0.9131. If it surpasses the R1 and keeps rising, the following resistance area, R2, is the previous week's high, around 0.9152.
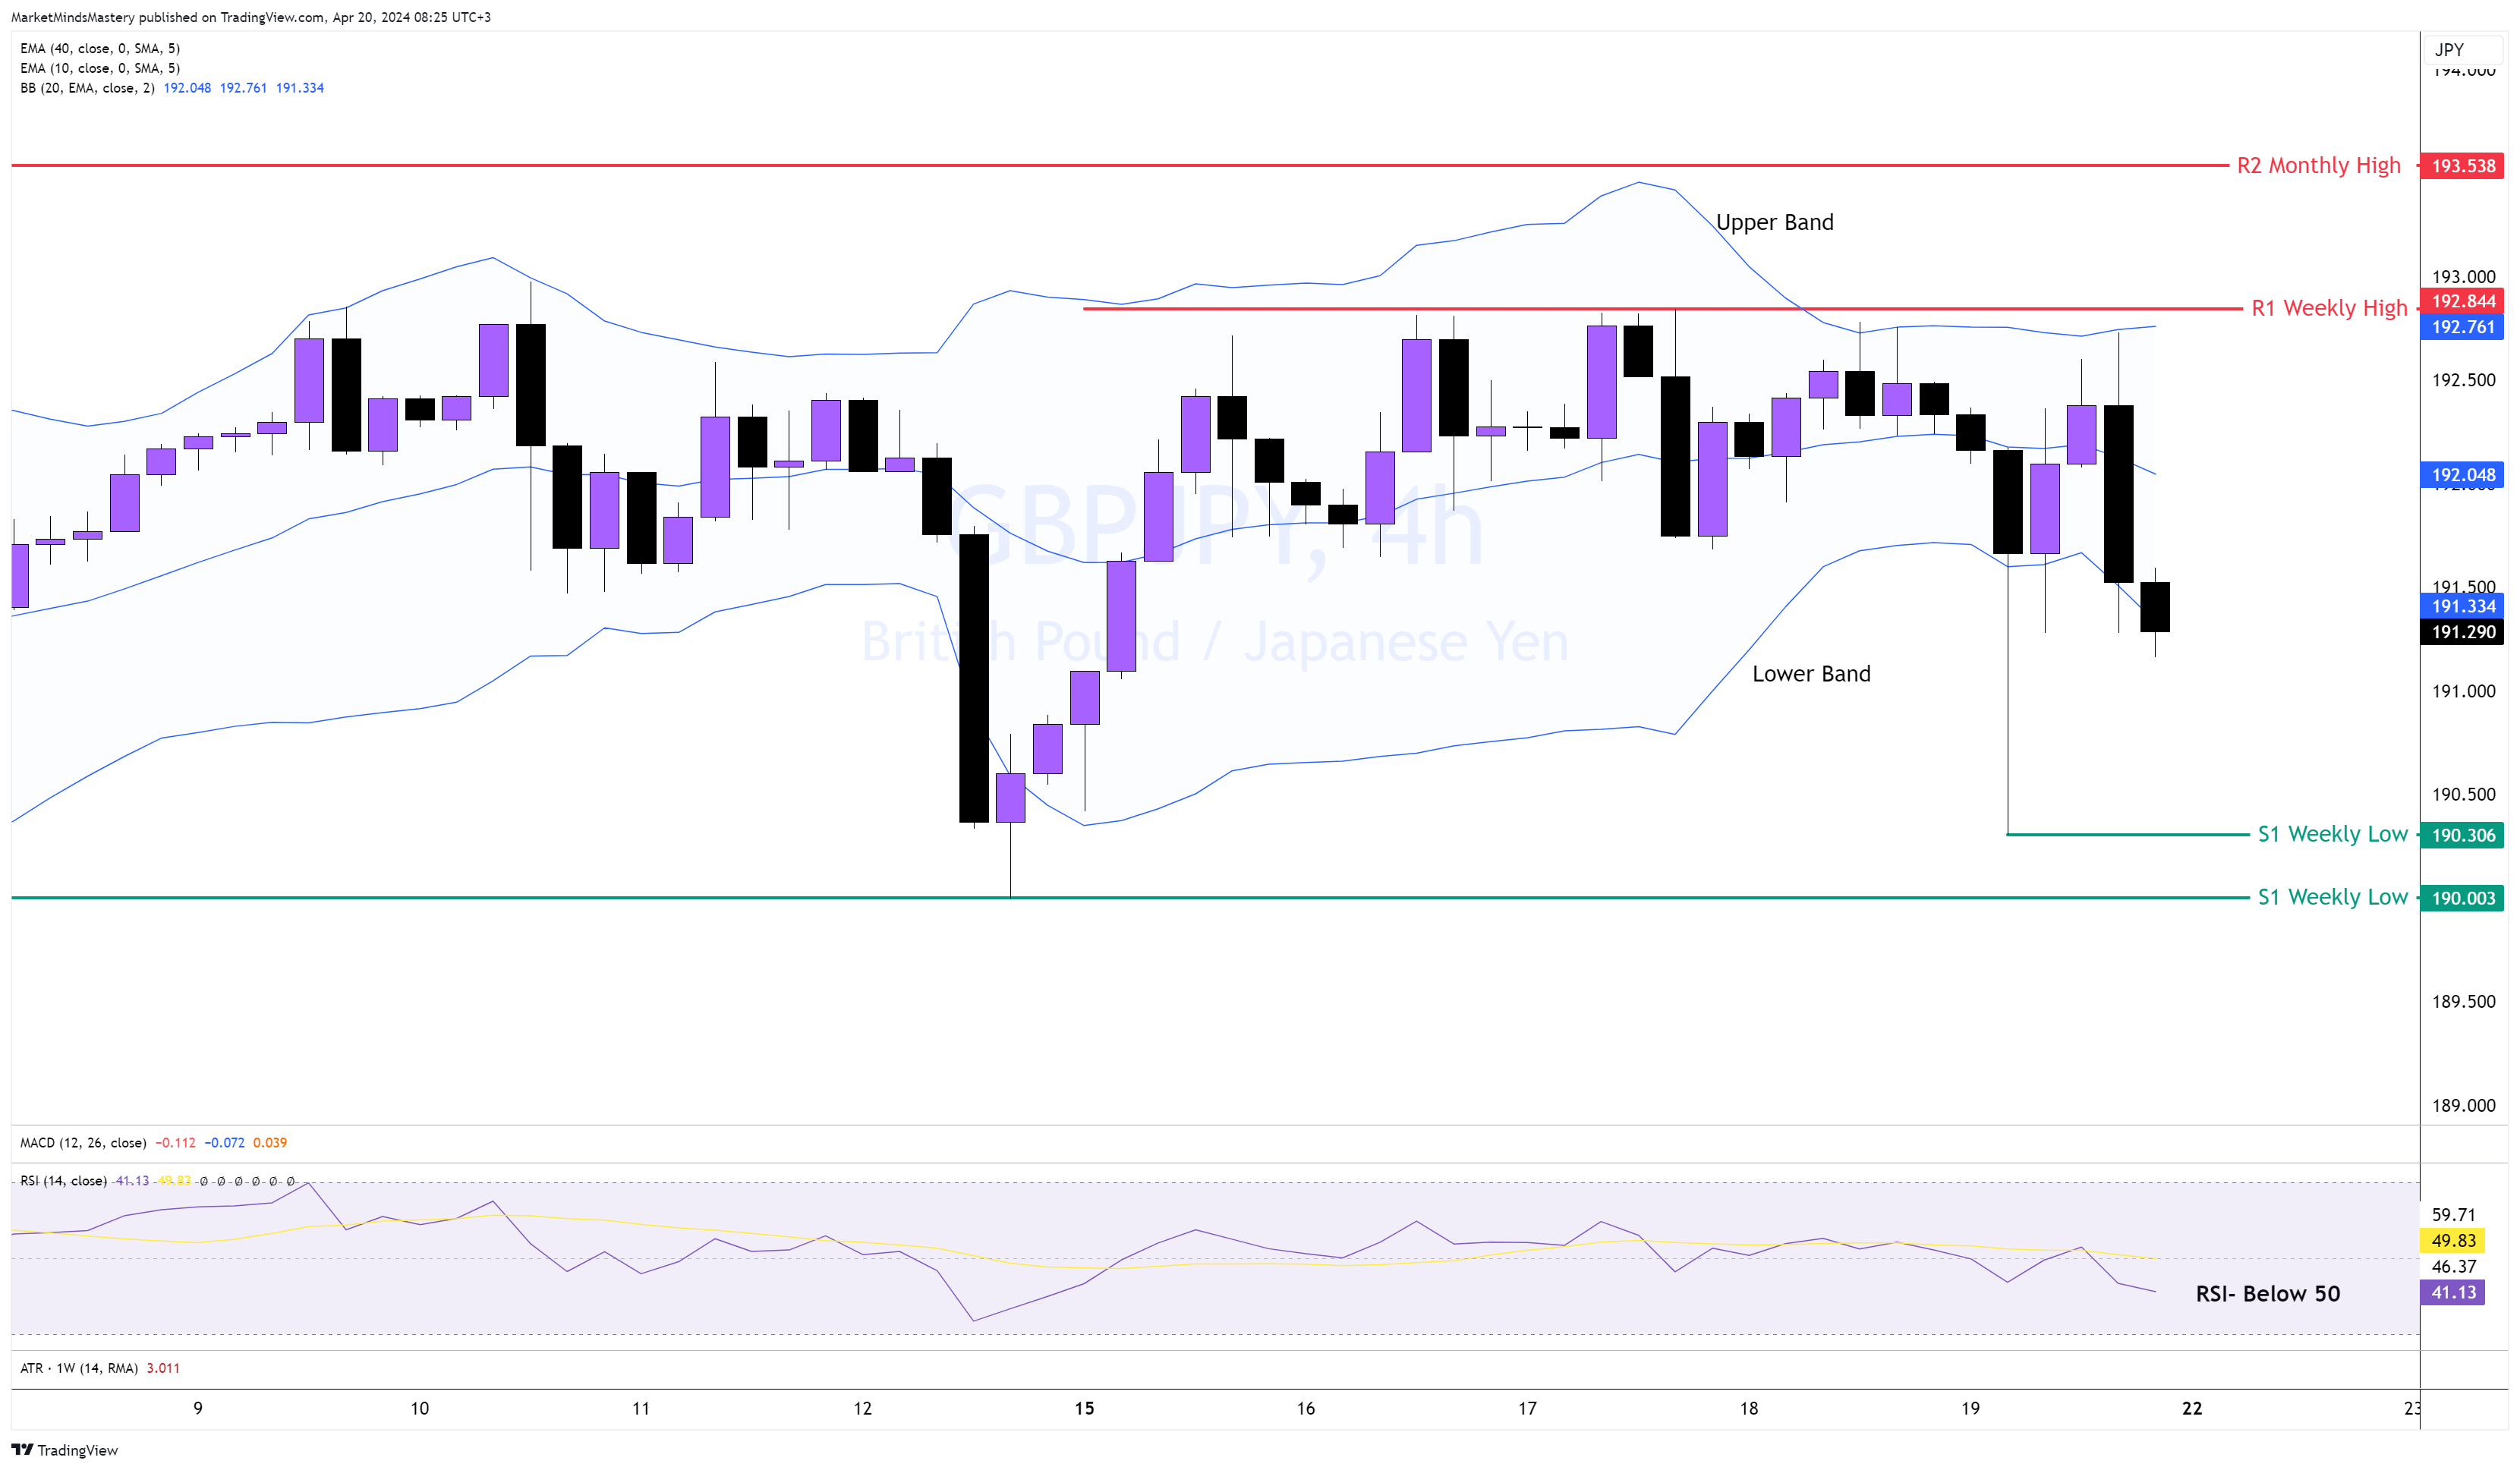
GBP JPY 4H
The price on the weekly chart ended with an inside candle, indicating no significant move caused by either buying or selling orders. As a result, the market in the 4-hour timeframe traded sideways. Therefore, this week, the market must break above the previous week's high or below the last week's low to establish a directional move. Under these market conditions, trending indicators like moving averages are less beneficial.
Looking at the Bollinger Bands, we observe that the price trades within the upper and lower bands without a break outside them. The RSI oscillator under 50 indicates that more selling orders exist than buying orders in the market.
If the price continues to move lower, the first support area, S1, will be the previous week's low, around 190.30, slightly above the S2 support of around 190. A breakout below these levels could lead to a directional downward move.
On the other hand, if the price moves upward, the first resistance area, R1, is the previous week's high, around 192.84, and the next resistance area is the previous month's high, around 193, which is the R2 resistance. Similarly, a breakout to the upside could lead to a significant upward move.
If the price continues to trade within the boundaries of the previous week's highs and lows, we may see the sideways move continue. In this case, buying orders are attracted to the support areas, while selling orders are attracted to the resistance areas.
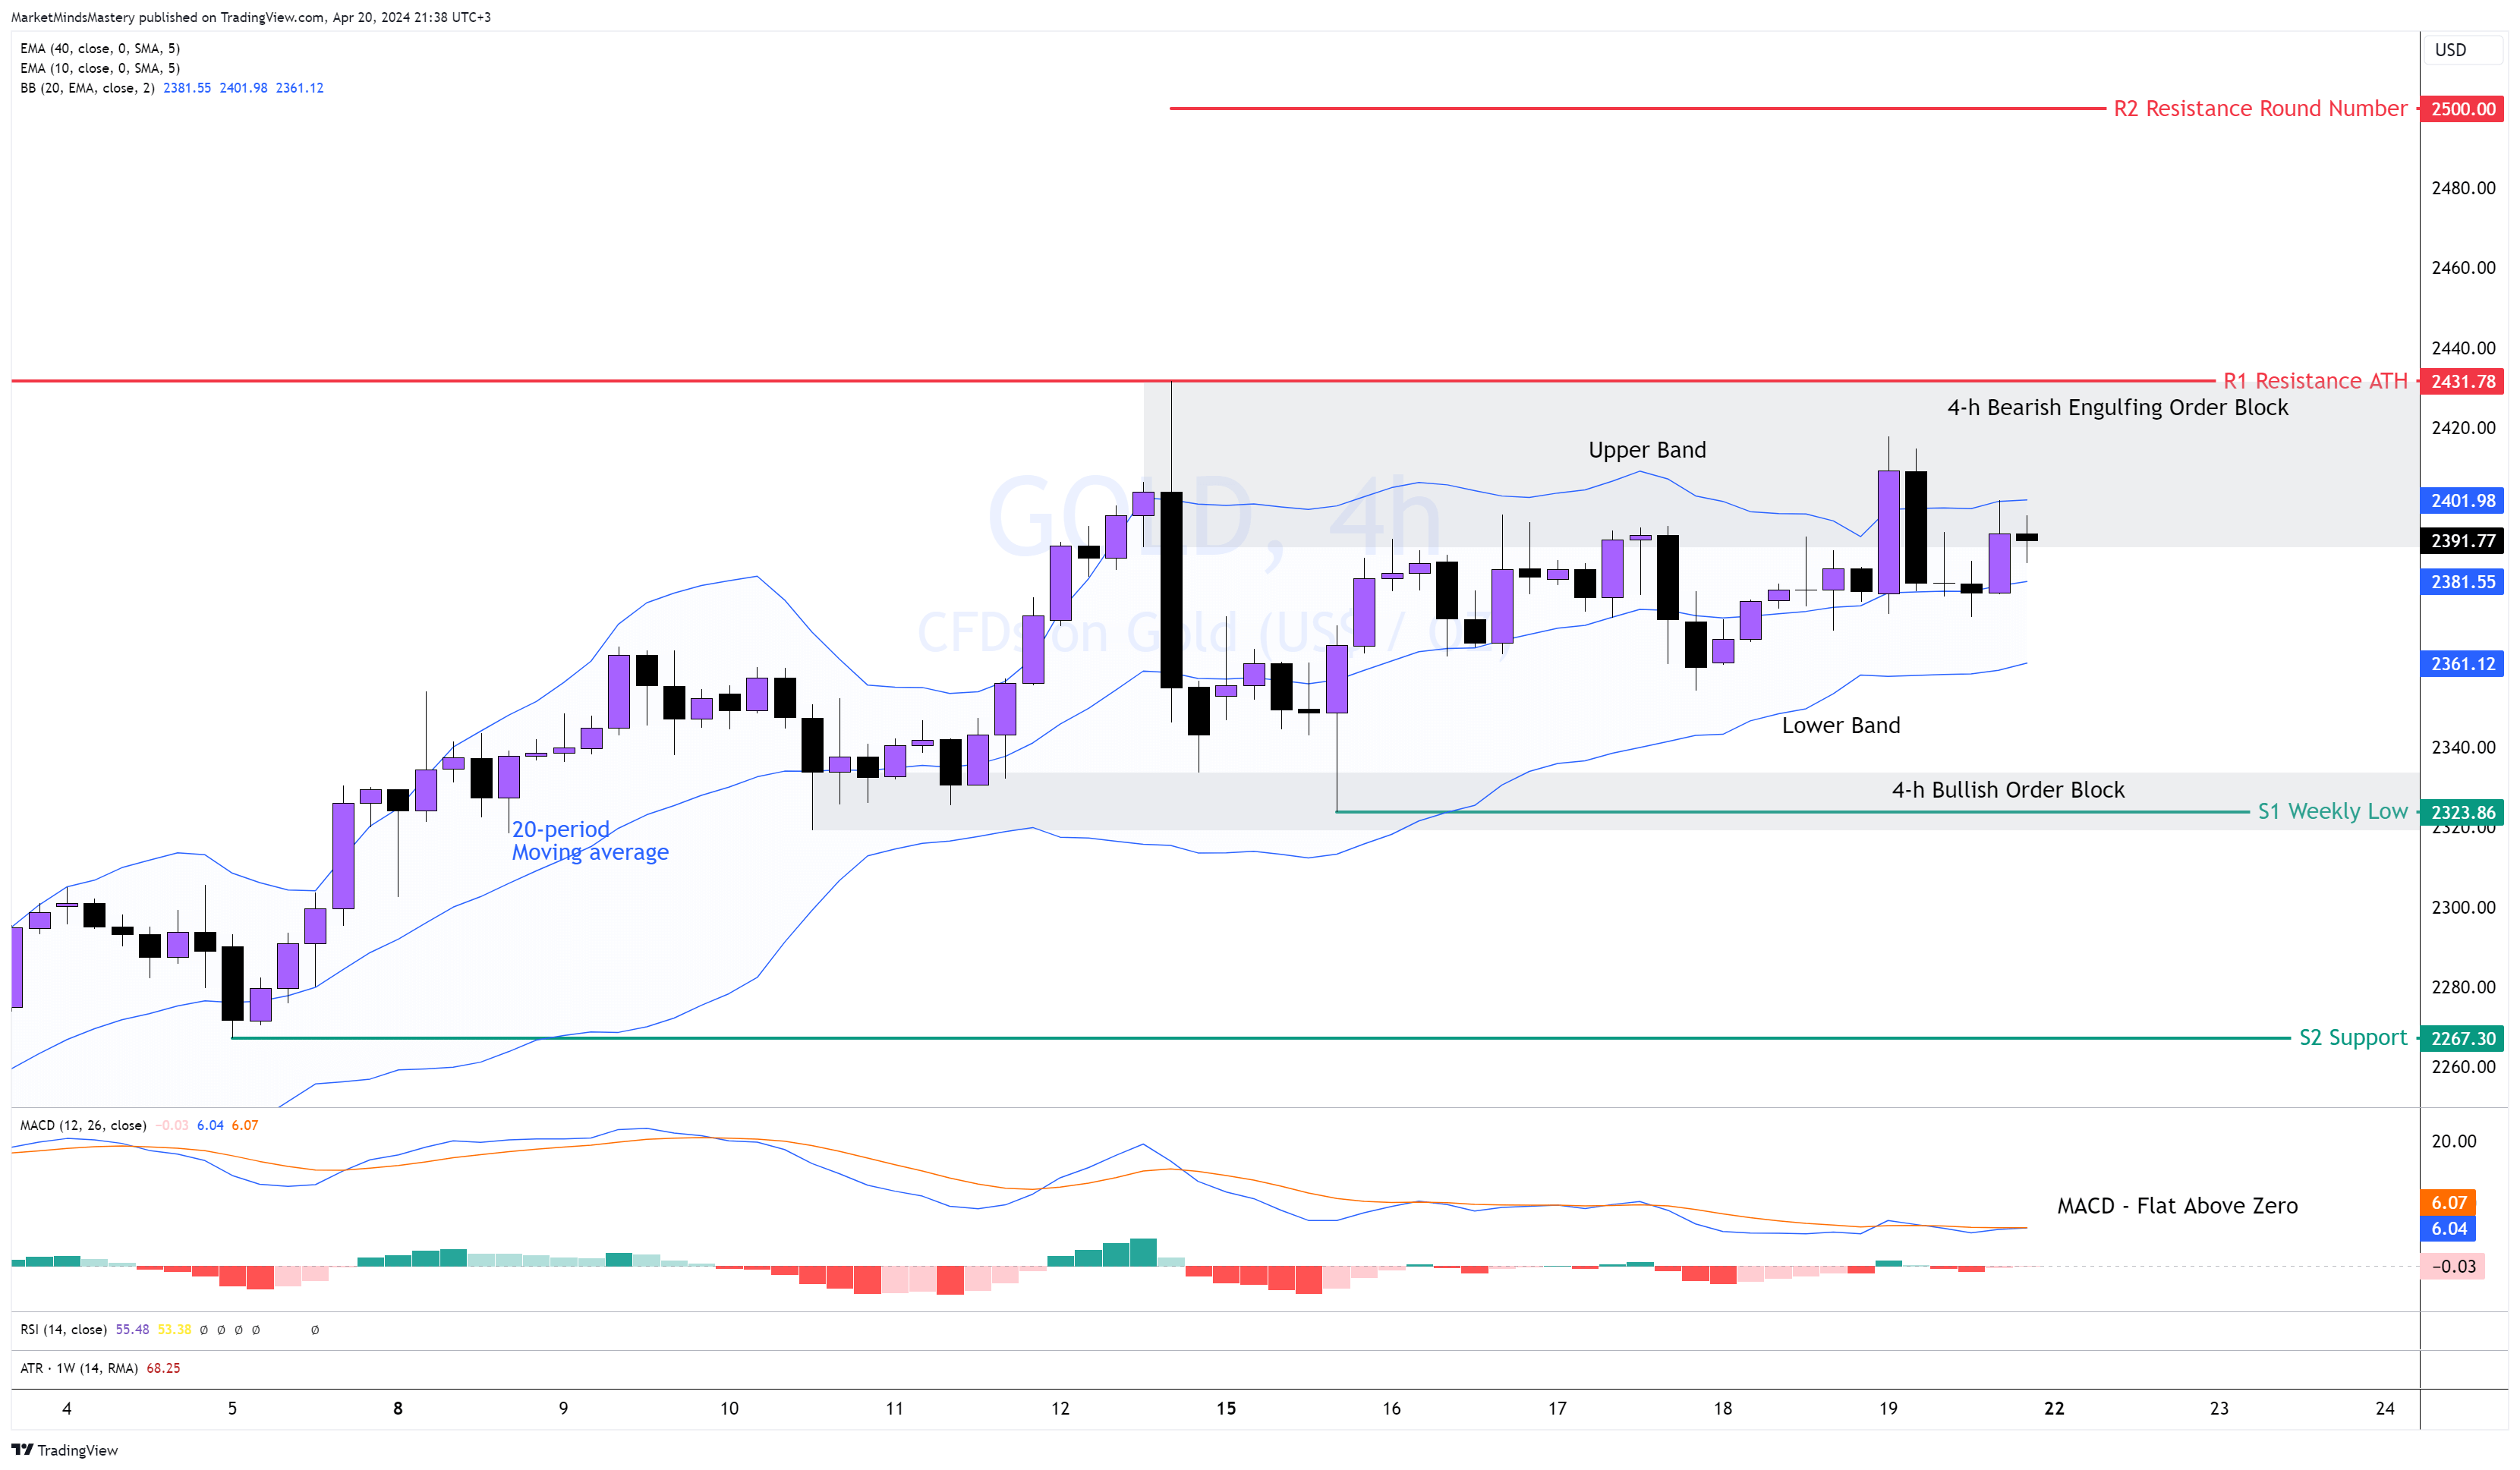
GOLD, 4H
The price of Gold didn't reach any new All-Time Highs (ATH) the previous week. Instead, it ended with an inside candle. It suggests there was no imbalance between buying and selling orders to control the market. Despite the primary uptrend per the weekly time frame, intermediate and minor trends can still show a downtrend in the lower time frames during corrections in the primary trend.
The upper and lower bands of the Bollinger Bands are flat, indicating sideways move. The 4-hour Bearish Engulfing Order Block was triggered last week and is still valid. The MACD is flat around the zero line, indicating a sideways market.
If the price moves upward and closes above the Bearish Engulfing Order Block, the first resistance R1 will be the ATH, around $2431. A break and a close above R1 could lead the price to the next resistance area, R2, around $2500.
Opposively, if the price enters a corrective phase on the weekly chart, which means it will move downwards, the first support area, S1, will be the previous week's low, around $2323, with an Order Block formed based on the wicks of the candles. It reveals the significance of recent buying orders accumulated at this level. If the price breaks below S1 and continues moving lower, the next support area, S2, is around $2267.
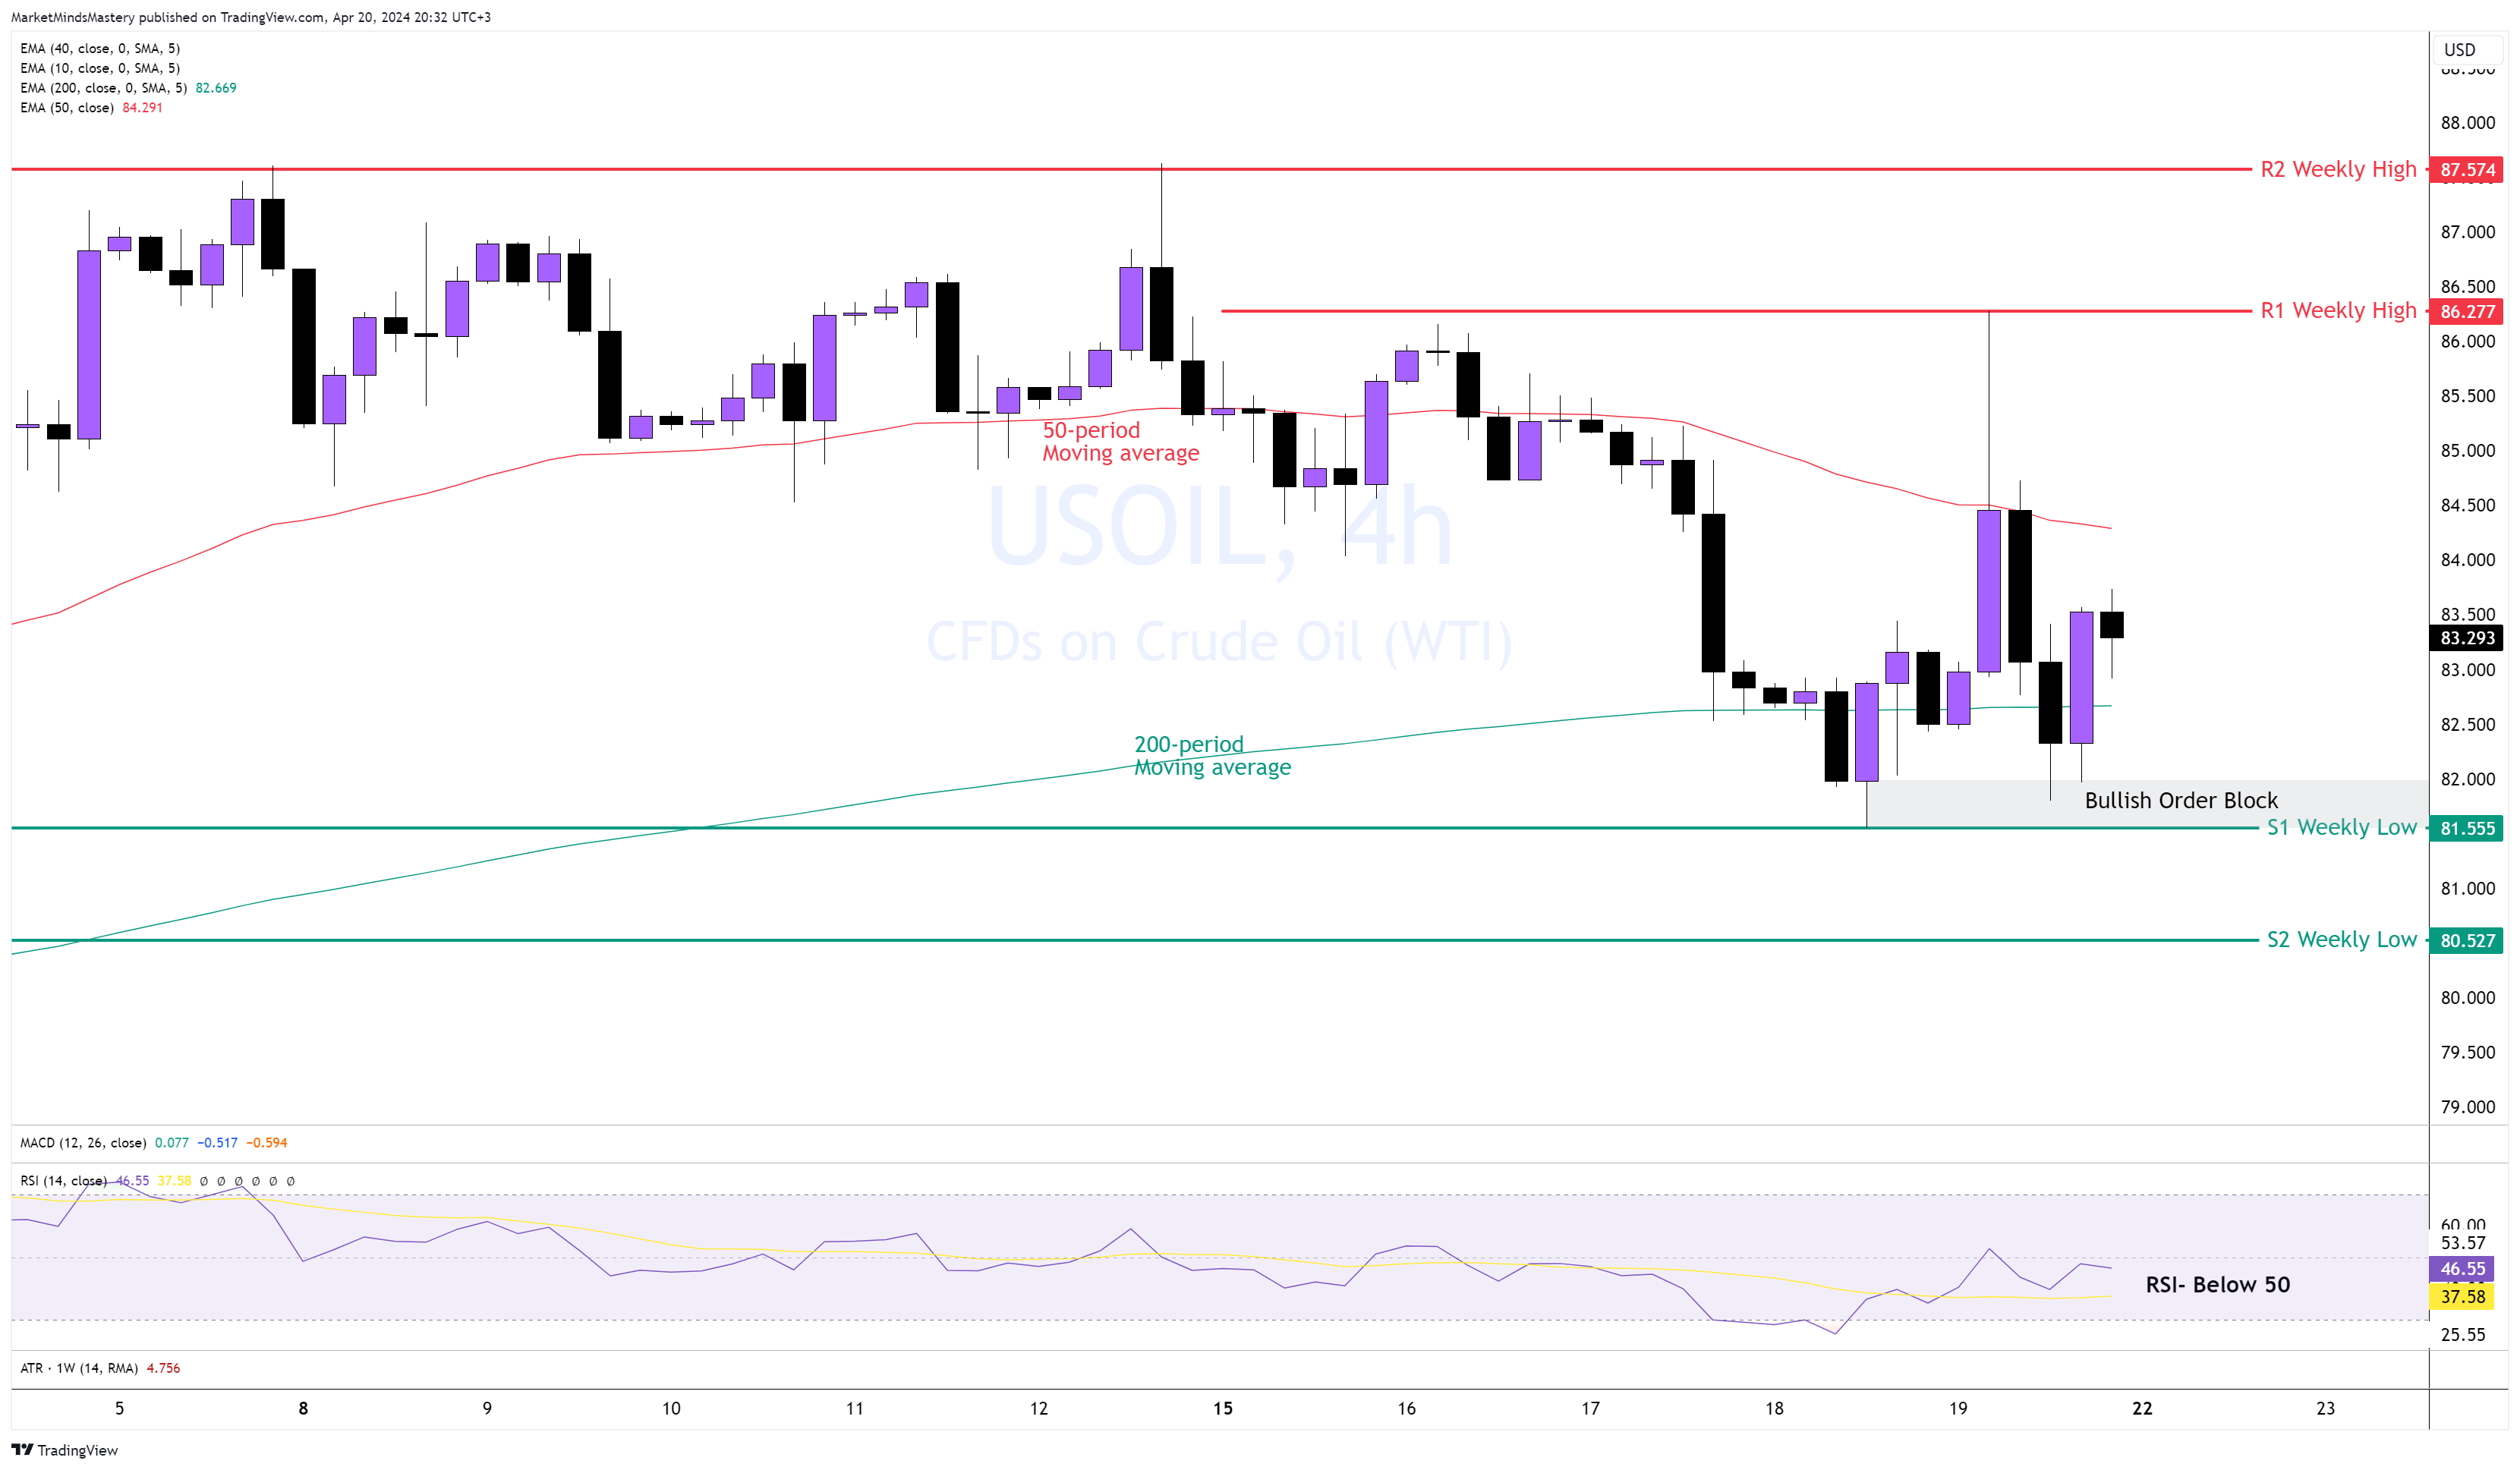
US OIL 4H
Following the downward move that occurred at the beginning of the previous week, as expected due to the weekly correction, the price found support at the critical Bullish Engulfing Order Block marked on the chart during last week's analysis. It bounced off this support and moved upwards. Based on the weekly chart, the long-term or primary trend is upward. However, the 4-hour timeframe has not yet shown a change in market direction. In other words, the price hasn't formed higher highs and higher lows.
The 50-period is above the long-term 200-period moving average, indicating bullishness. The RSI is slightly below 50, around 46, which is a bearish indication. If the price respects the support from the Bullish Engulfing Order Block and continues moving upward, the first resistance area, R1, is the previous week's high, around $86.27.
If the price breaks and closes above the R1, the following area of R2 is approximately $87.57.
On the other hand, if the price declines and moves downwards, the first support area, S1, is approximately $81.55. If the price declines more, it will find the next support area, S2, around $81.55. This price level is a weekly low, and penetration of this price level might resume the 4-hour chart downtrend.
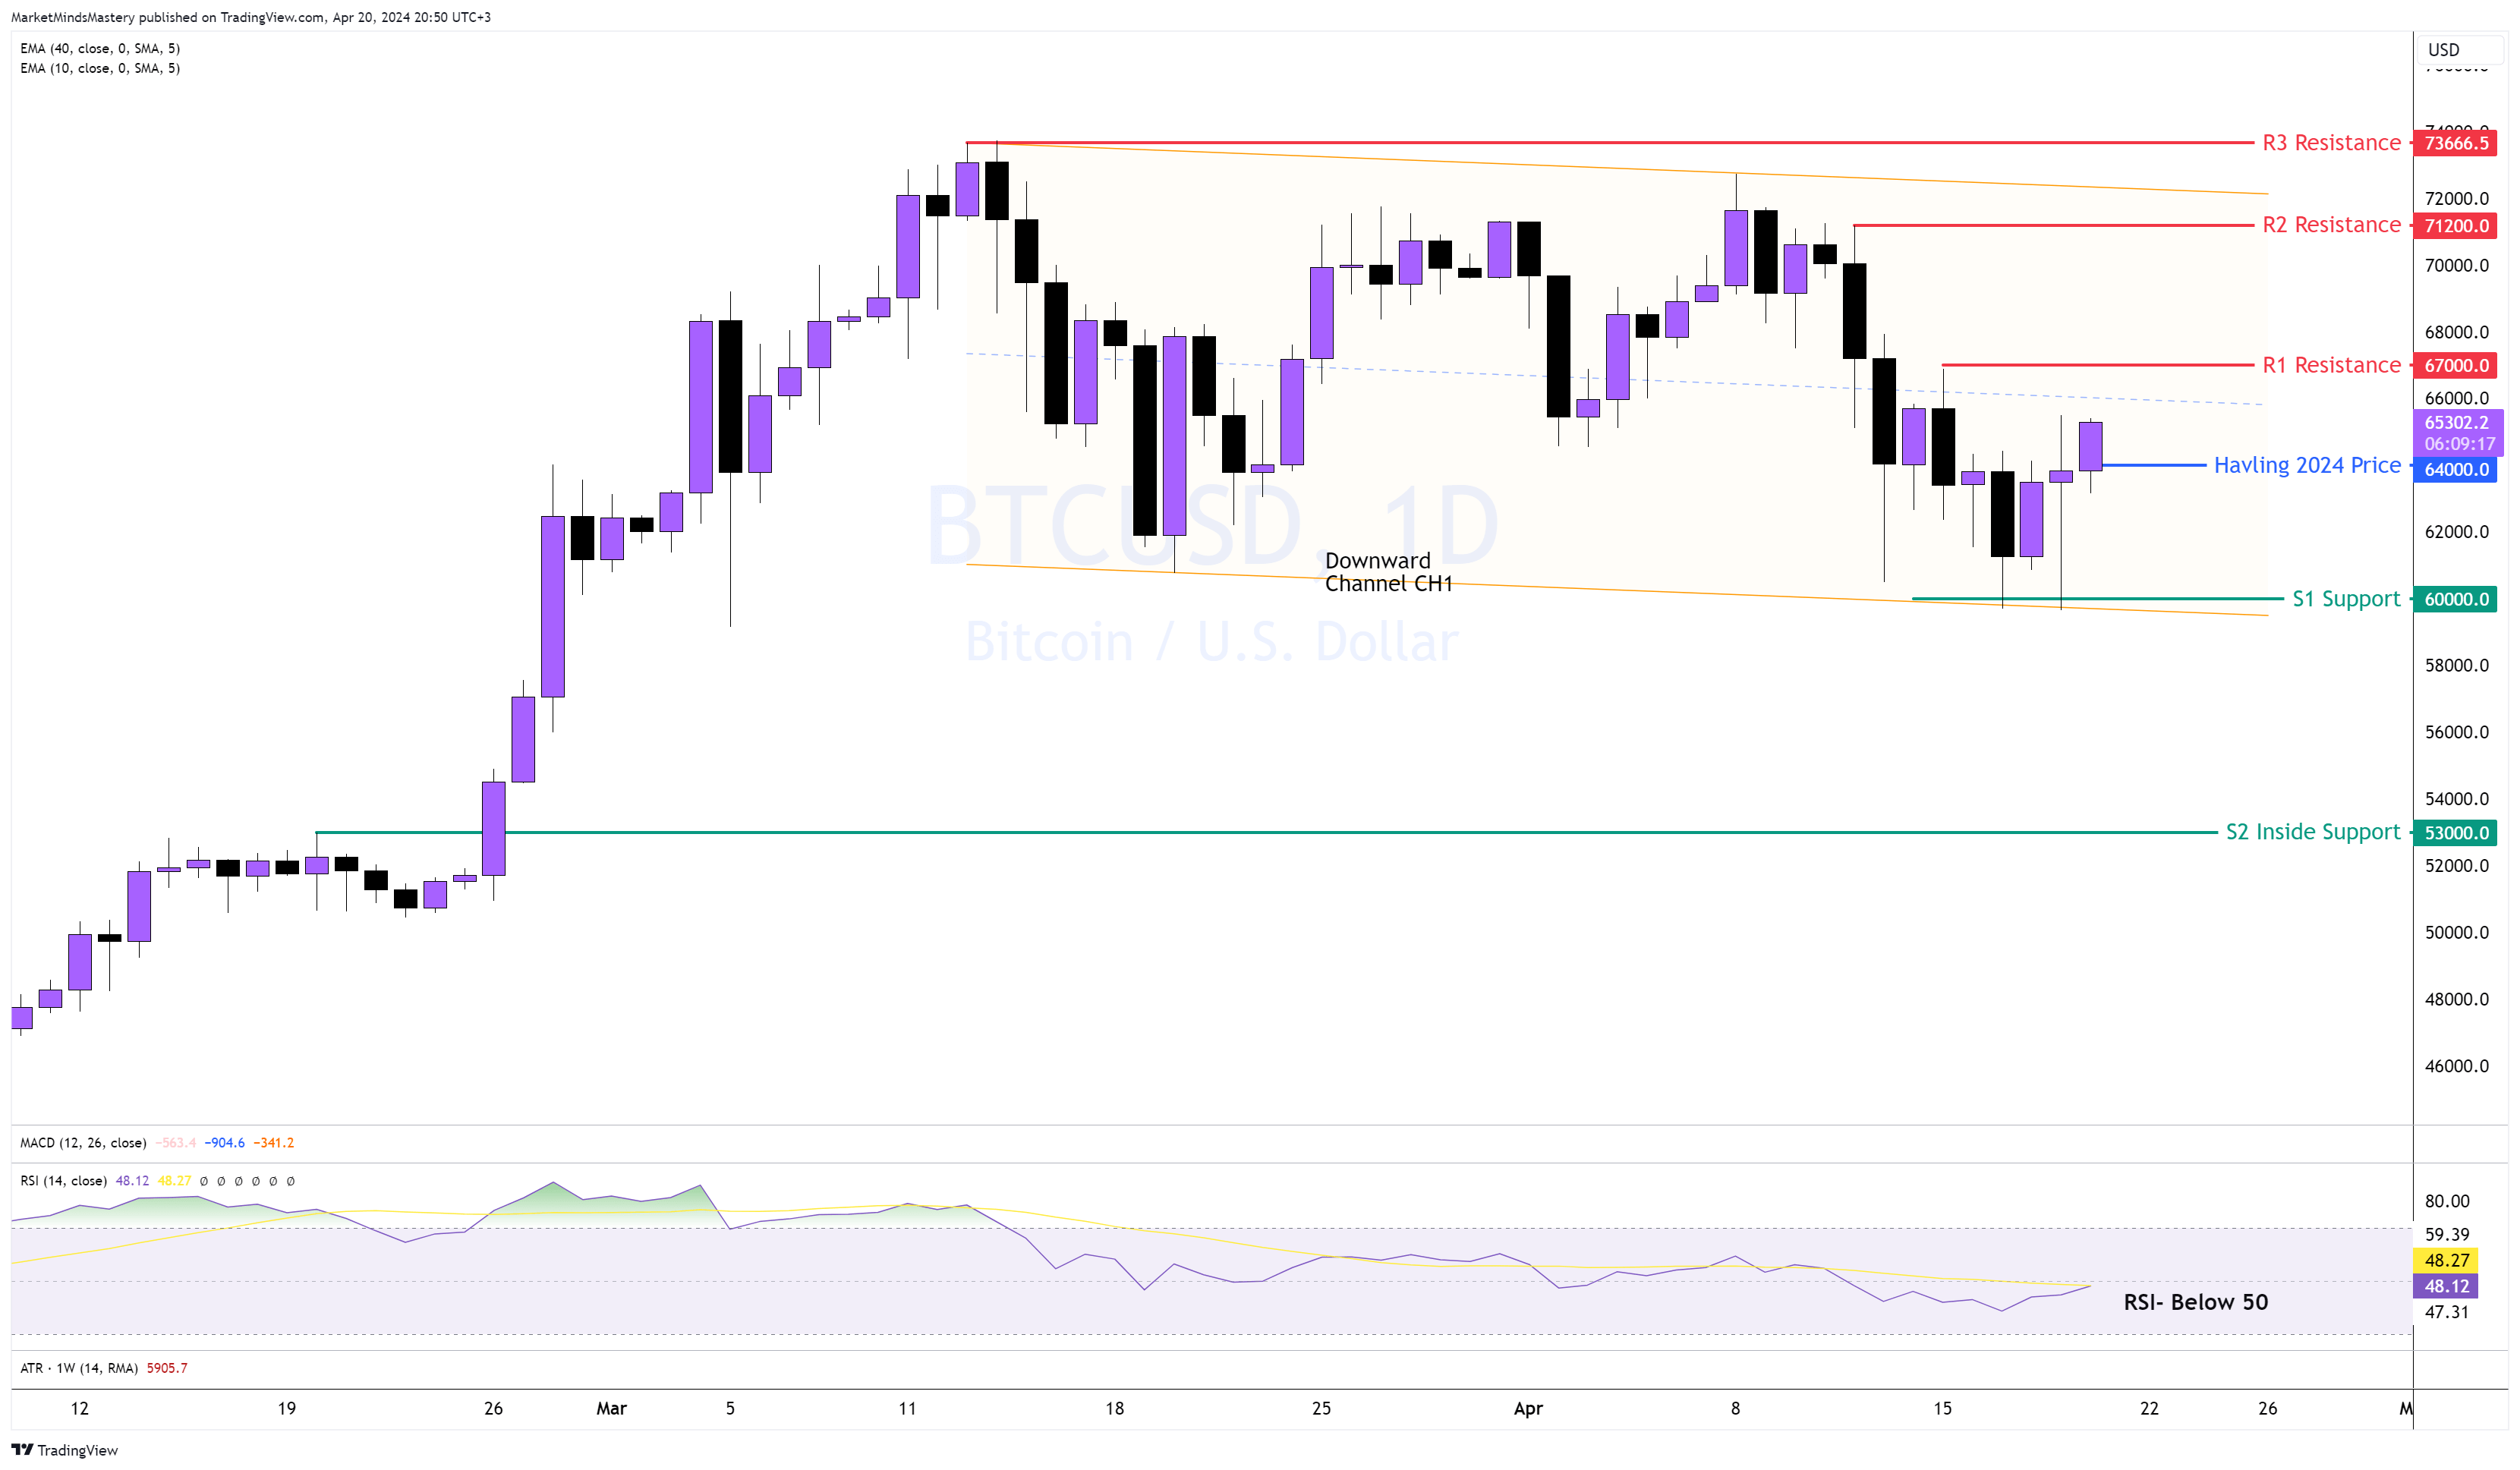
BTC USD DAILY
The Bitcoin halving occurs once every four years. This year, it happened on the 20th of April, around $64,000. Right after the event, the price started to increase. Bitcoin halving is when the Bitcoin operation by miners reduces to half.
Looking at the Daily chart, it's evident that bullish momentum persists as higher lows are maintained. However, the market hasn't formed a new higher high yet, and the current consolidation move can be captured using a downward channel CH1. At this point, we must clarify that no lower lows occurred. Therefore, the bullish sentiment remains.
The RSI oscillator is below 50, indicating bearishness. If the price continues to increase, the first resistance area, R1, is approximately $67,000. If the price breaks above R1, closes above it and continues to move upward, the next resistance area, R2, is around $71,200.
On the other hand, if the price declines and moves downwards, the first support area, S1, is approximately $60,000. If the price breaks below S1, closes under it and continues to decline further, the next support area, S2, will be inside support of around $53,000.
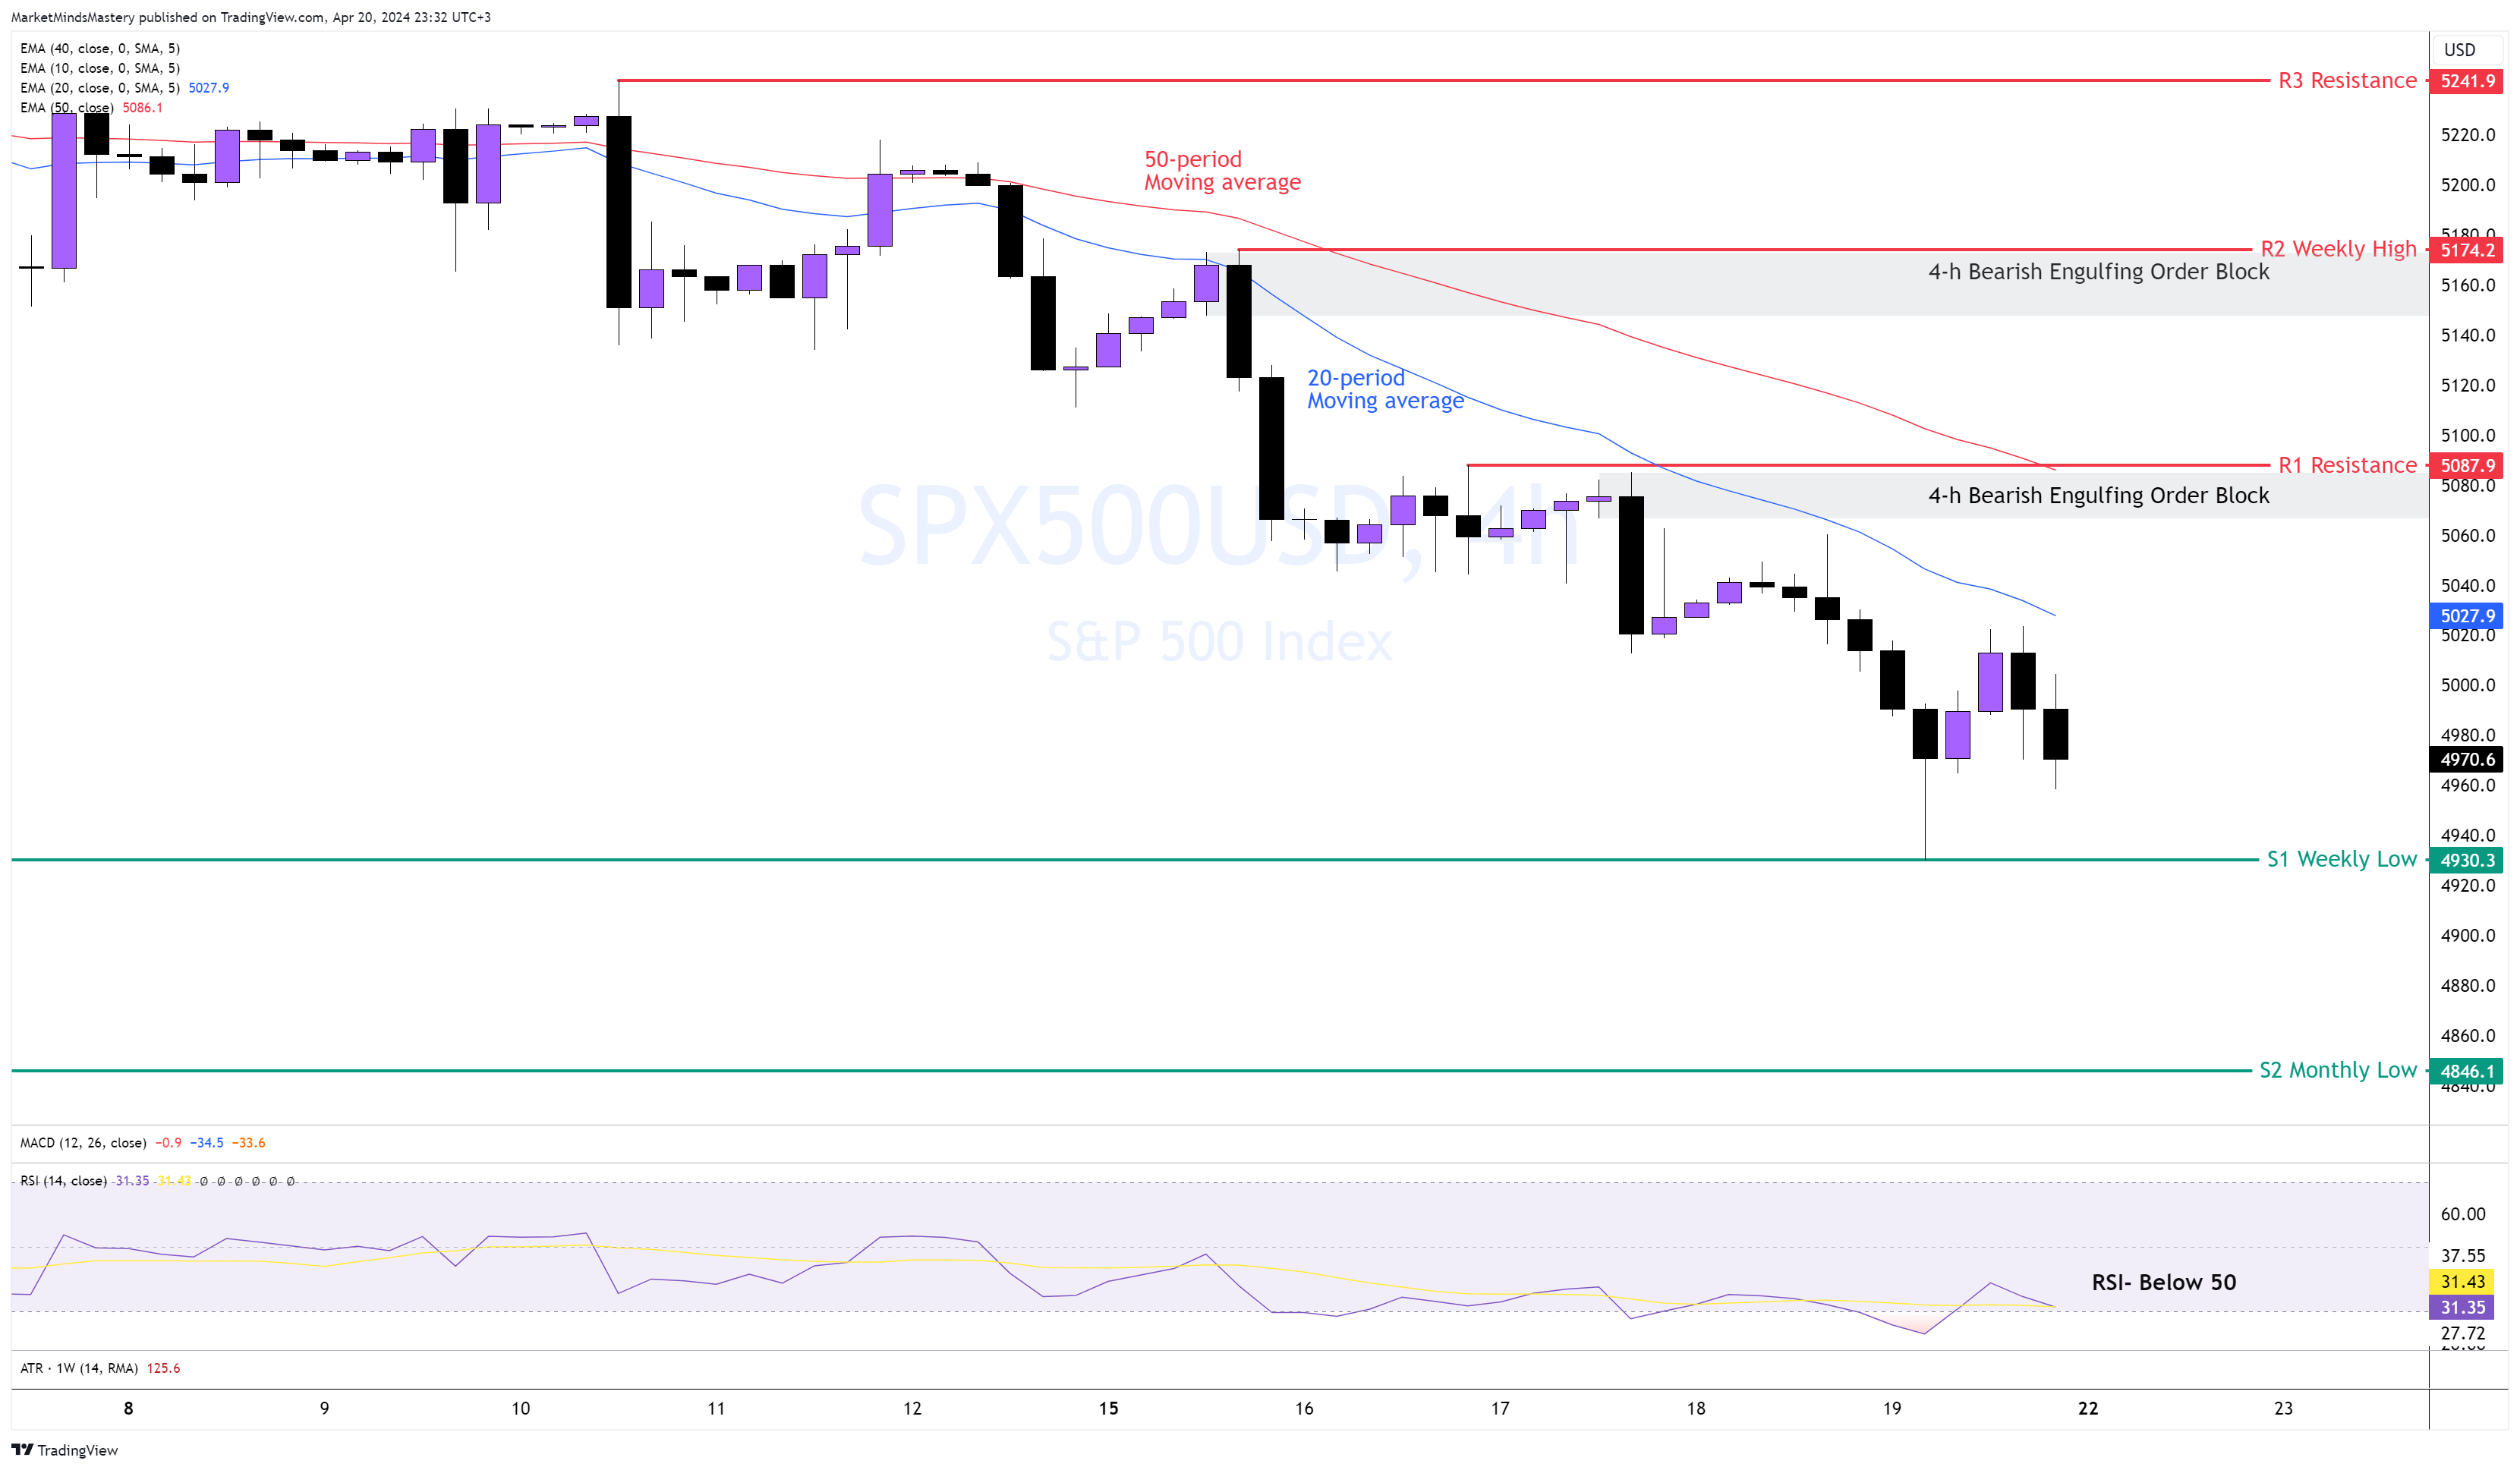
SP 500, 4H
It is the first time since October 2023 that the price of the major US indices has corrected to this level. The 4-hour chart shows a well-established downtrend defined by lower and lower highs. An essential aspect of this downtrend is the size of the Bearish candles (black), which are much longer than the bullish candles (purple). Additionally, the 20-period moving average is below the 50-period moving average, indicating bearishness.
The RSI is under 50 and very close to the overbought area, another bearish indication.
Starting Monday, if the price continues to decrease, the first support area, S1, will be the previous week's low, around $4930. If it breaks and closes below S1 and declines further, the next support area, S2, is approximately $4846.
On the contrary, if the price bounces off and moves upwards, the first resistance area, R1, is around $5087. A 4-hour Bearish Engulfing Order Block formed at that level per the chart. If the price surpasses R1 and moves upwards, it will signal a trend reversal. A continued rally above R1 will lead the price to the next resistance area, R2, around $5174, the previous week’s high price.
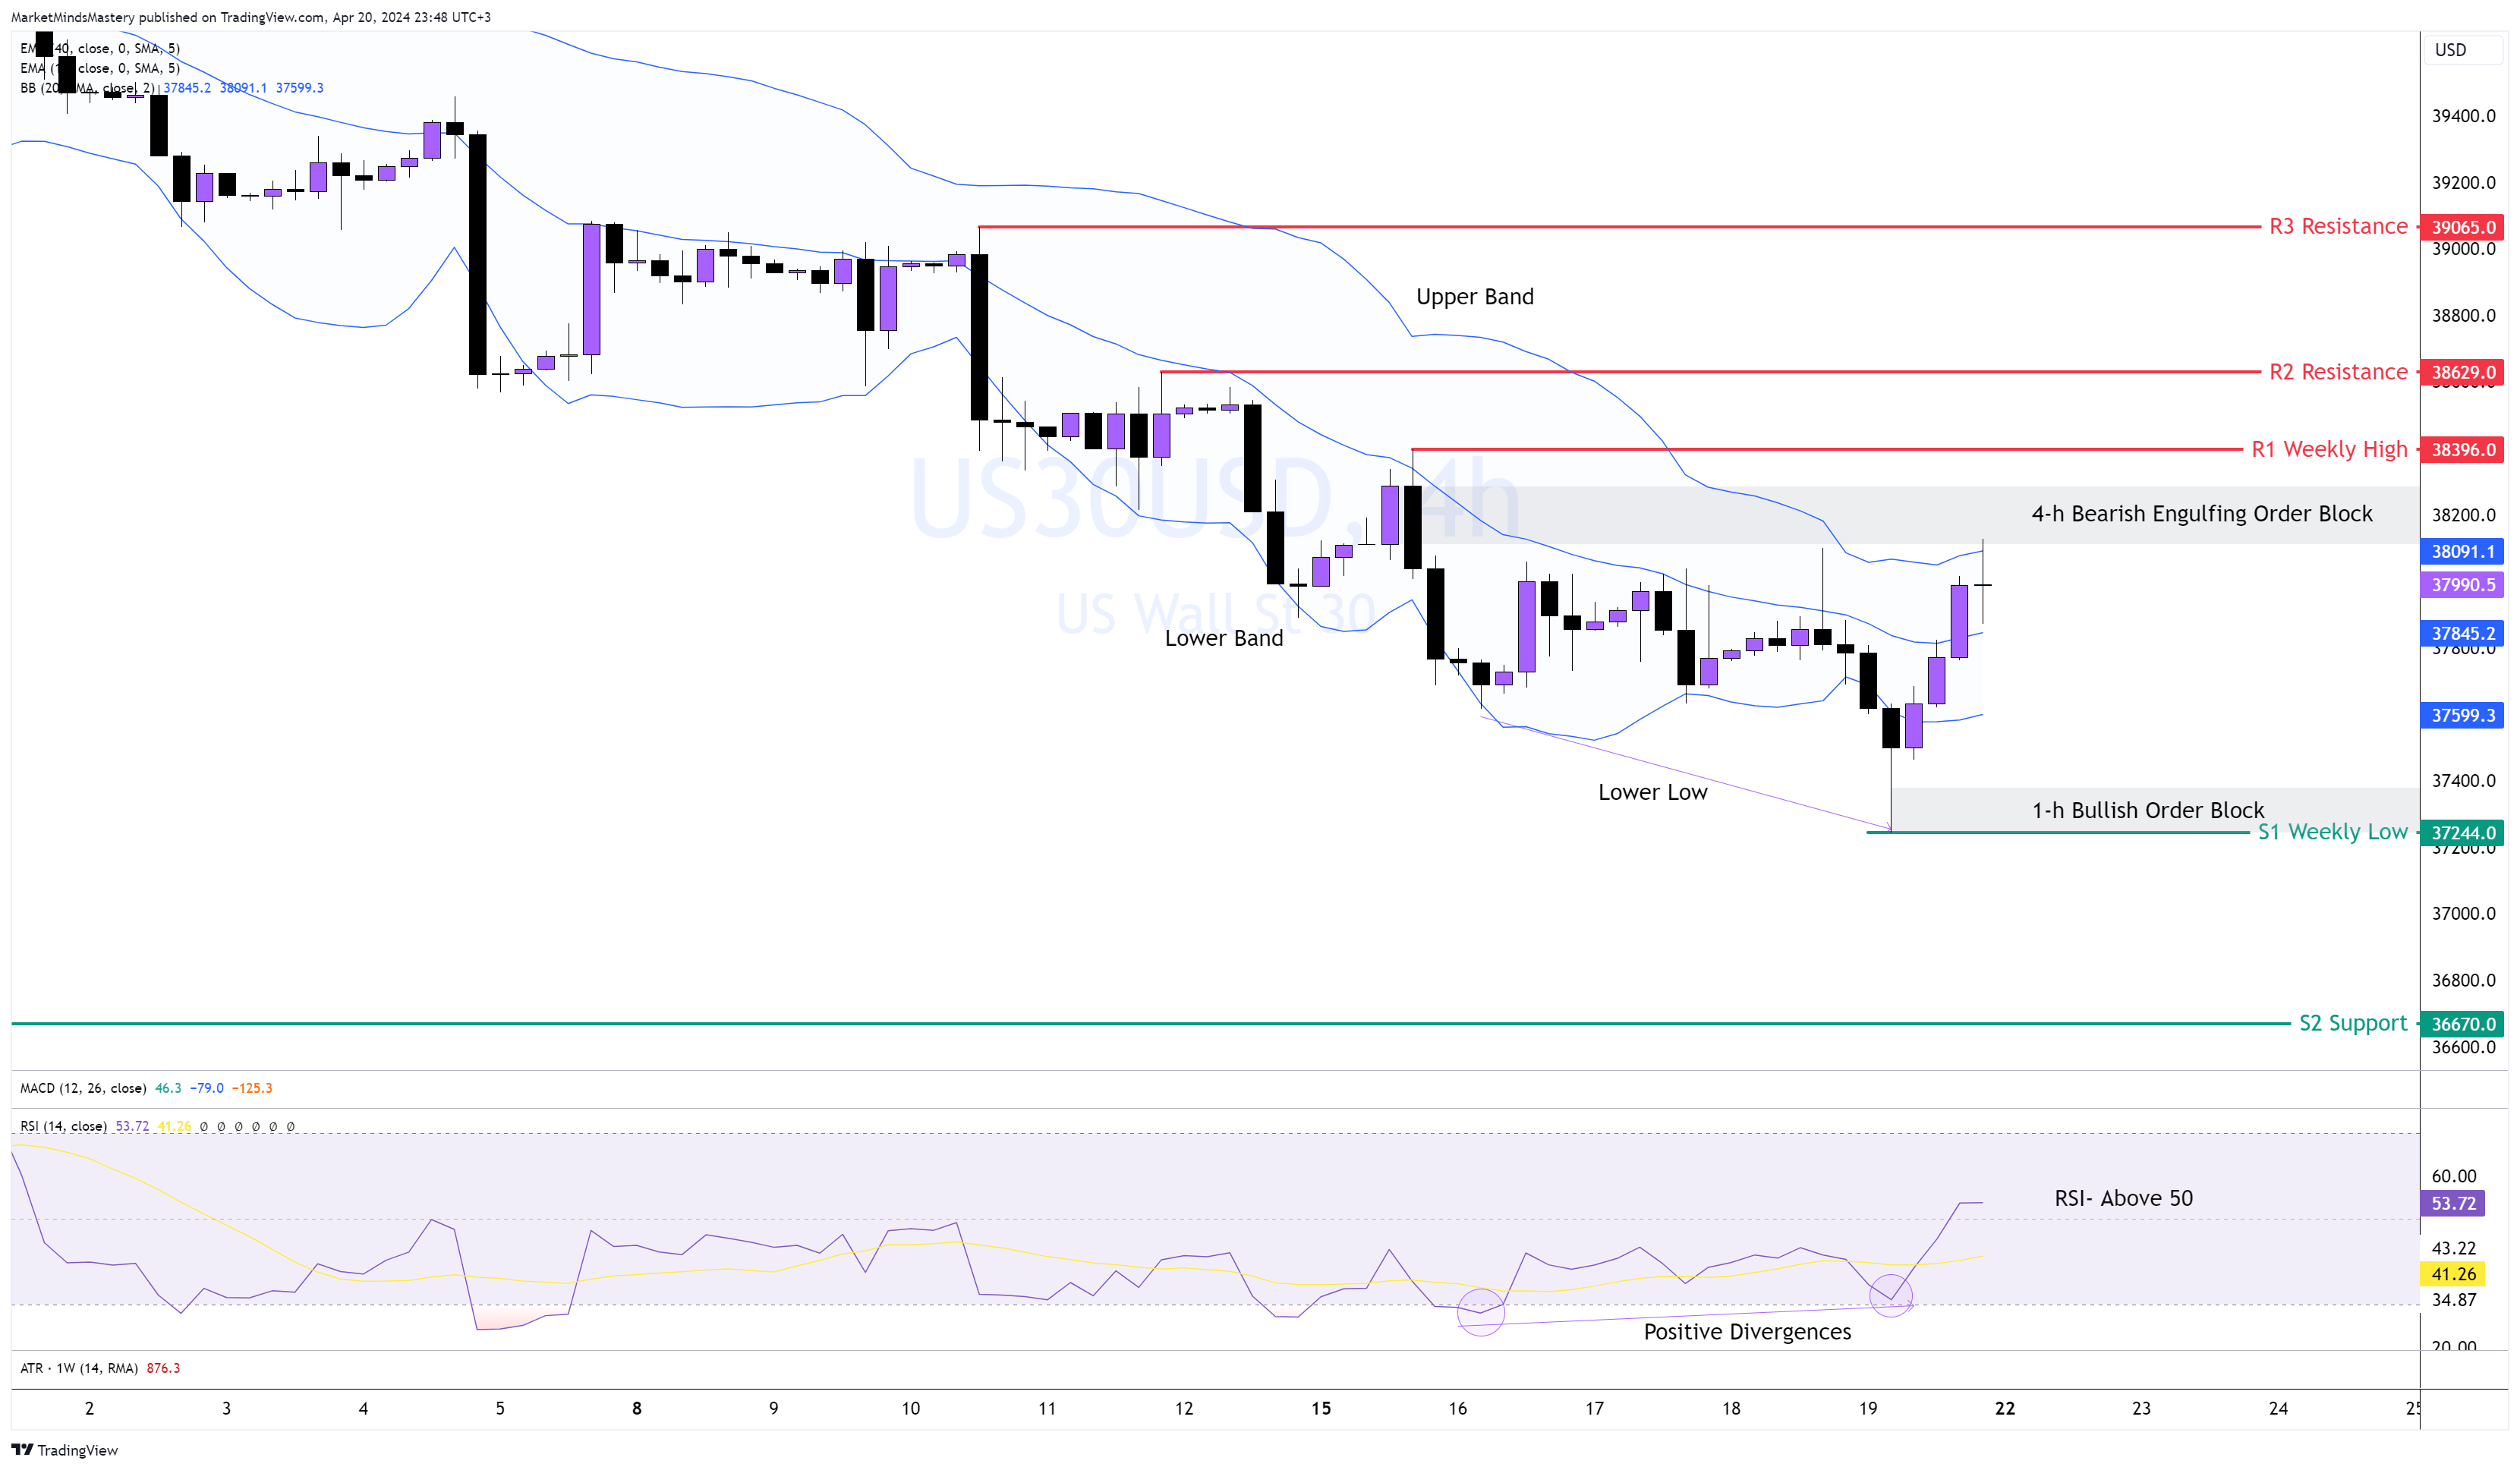
US 30, 4H
The downtrend that started on the 4-hour chart a few weeks ago continued during last week’s trading sessions. The price continues to form lower lows and lower highs, indicating bearishness.
However, an early indication from the RSI oscillator is the appearance of Positive Divergences on the previous Friday. The RSI could not follow through despite the price making a new low, showing a lack of downward momentum.
Currently, the price is trading within a sideways move. Towards the end of the previous Friday's trading session, the price entered into the area of the Bearish Engulfing Order Block.
Starting Monday, if the price declines from the Order Block and moves downwards, the first support area, S1, is the previous week's low, around $37244. An hourly Bullish Engulfing Order Block is marked on the chart. If the price continues declining, the next support area, S2, is around $36670. Conversely, if the price bounces off and moves upwards, the first resistance area will be the previous week's high, around $38396. If the price penetrates R1 and moves higher, the next resistance area is at R2, approximately $38629.
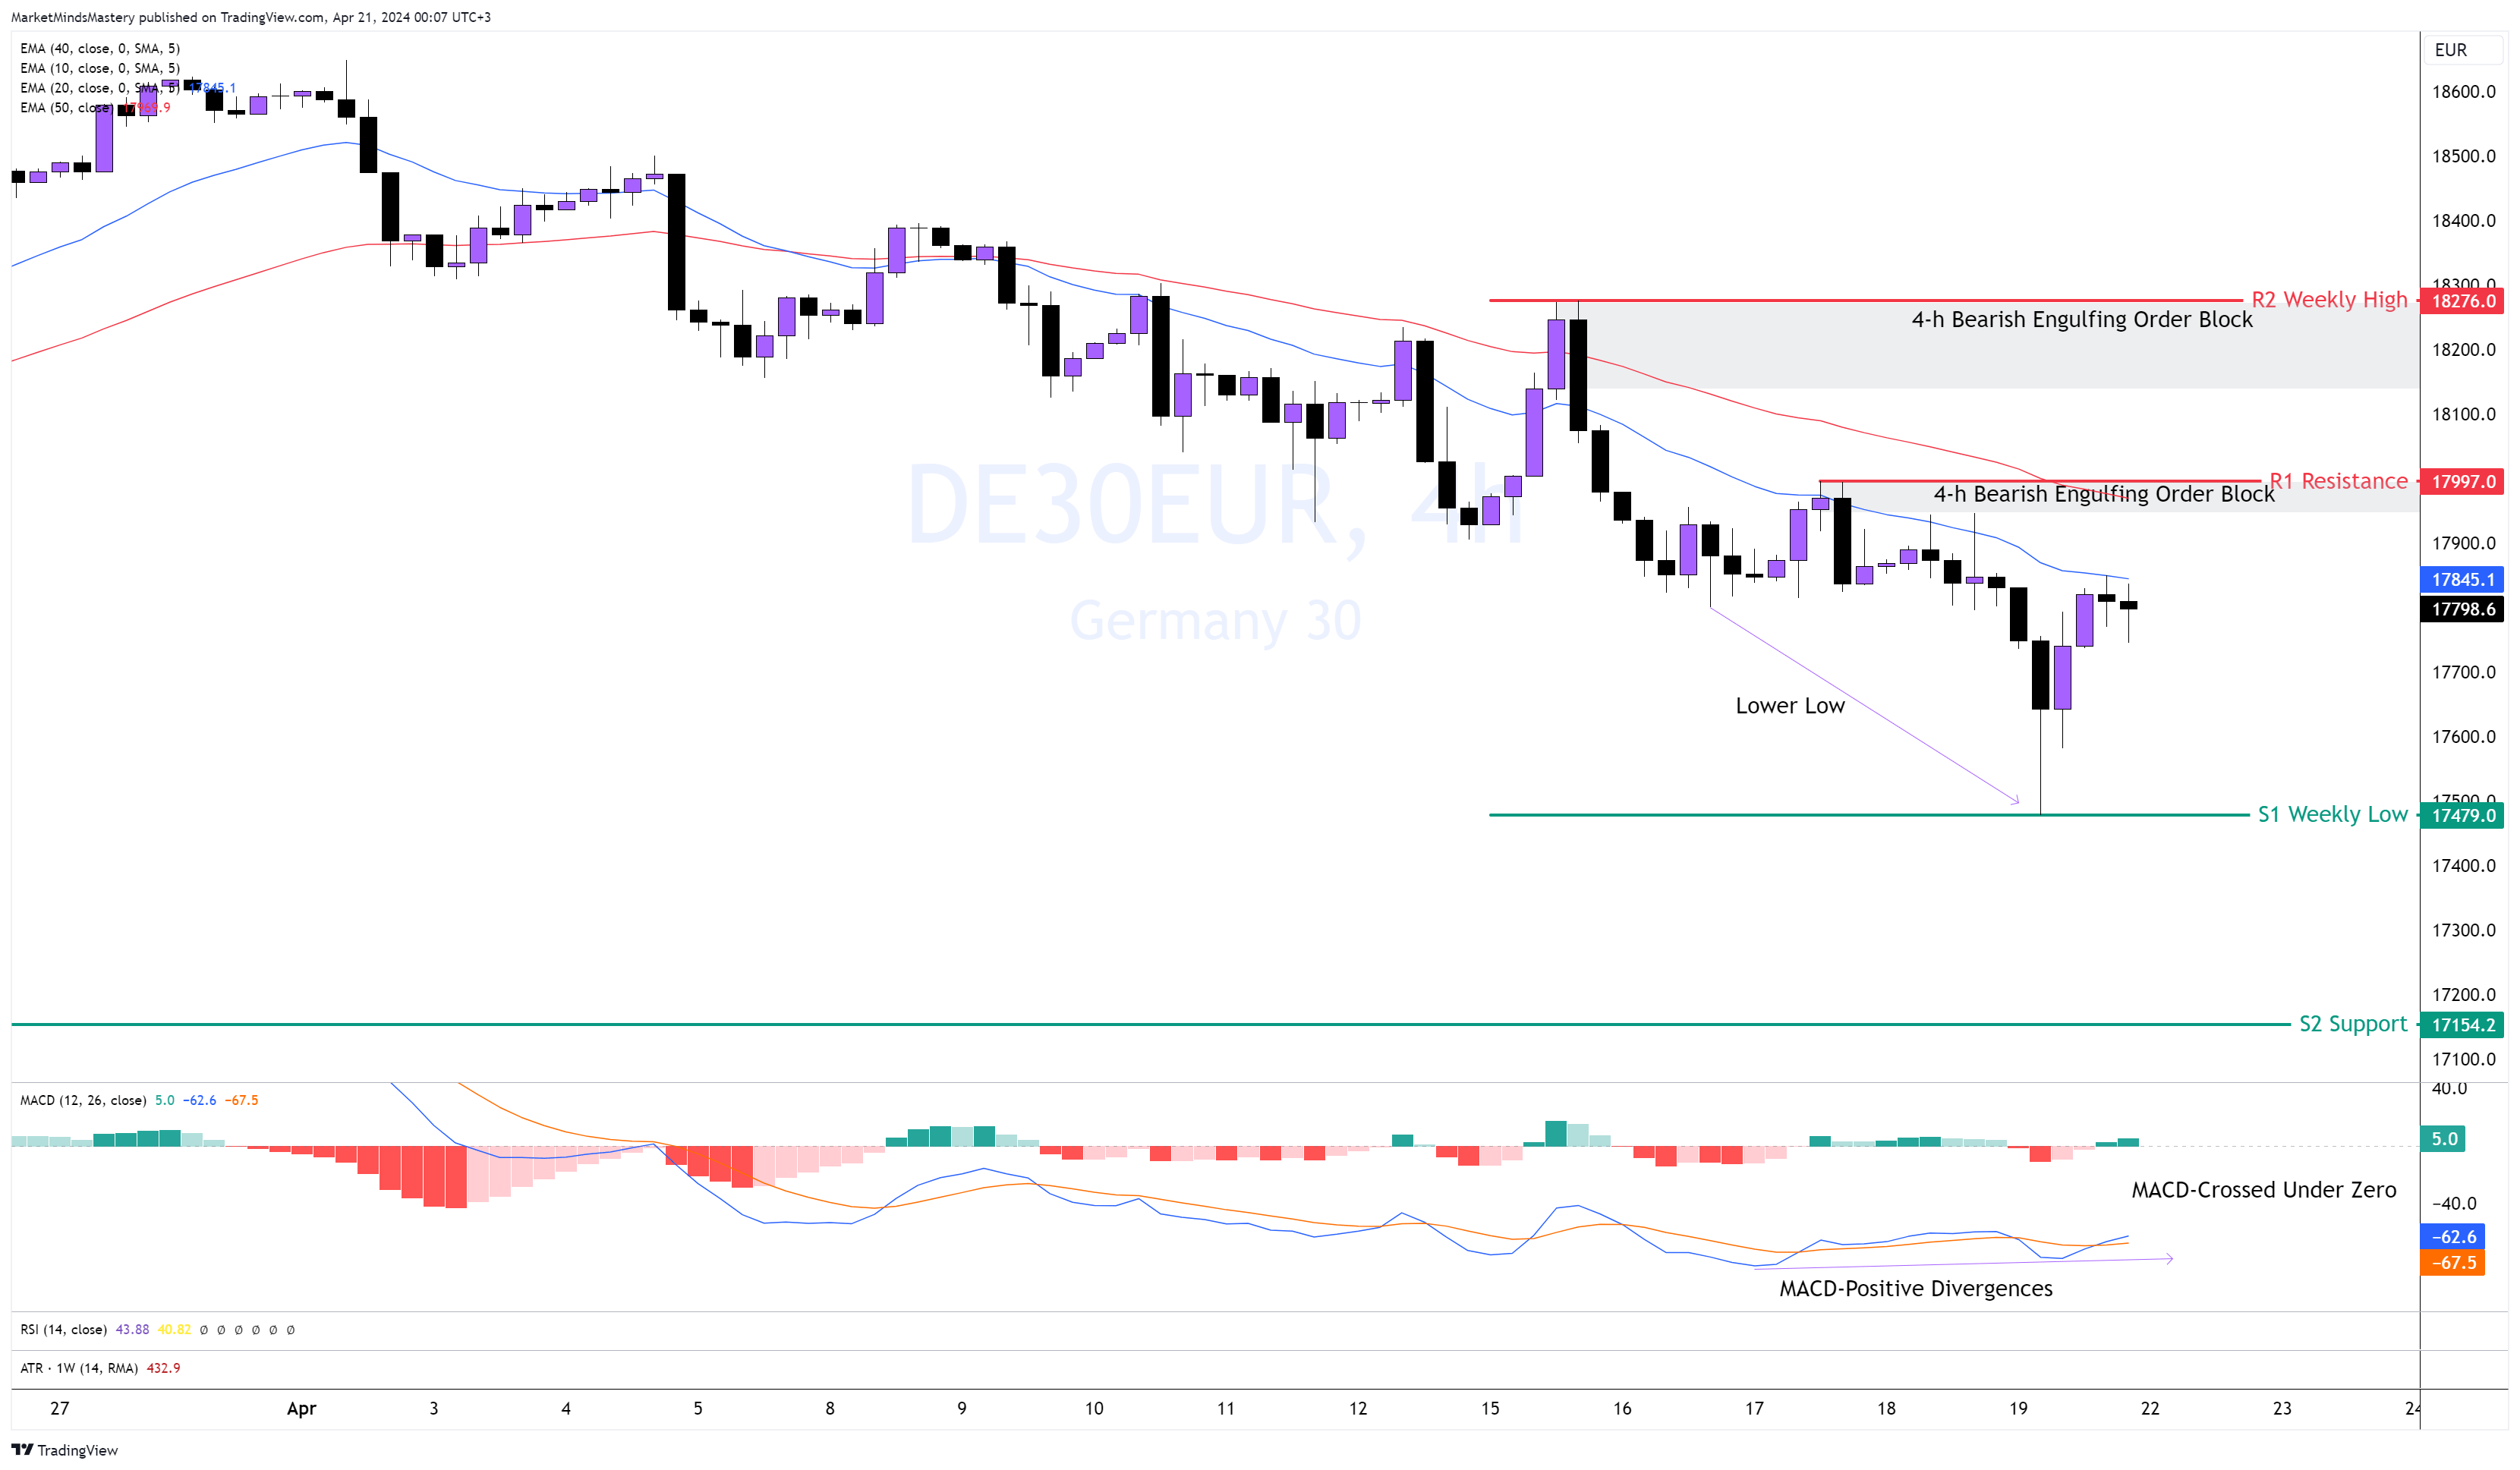
GER 30, 4H
Based on the weekly chart, last week, the price declined, forcing the 4-hour chart into a clear downtrend. The price kept declining in a series of lower highs and lower lows.
The MACD is below zero, which is another bearish indication.
The 20-period moving average is below the 50-period moving average, which also has bearish implications.
There are a few important things to observe about that MACD in his chain. First, the price created a new low during the latest downward impulse leg, but the MACD failed and created Positive Divergences. Additionally, the MACD line crossed above the Signal line while the MACD was still under zero. Usually, These last two observations will keep traders alert for possible trend reversals.
If the price continues moving downwards, the first support area, S1, is around 17479, which is the previous week's low. If the price breaks and closes below S1 and continues declining, the next support area, S2, is around 17154. Conversely, if the price moves upwards, it will enter into the 4-hour Bearish Engulfing Order Block under the R1 resistance around 18000.
As this is a round number, traders and market participants consider this a significant market price level. If the price surpasses R1 and continues rallying, the next resistance area, R2, is around 18276.
👉 Click here to check our Challenges
👉 Don’t miss our Free Live Webinars
👉Join us on Discord
Risk Disclosure:
The Trading Pit offers only demo accounts to all users within the Challenges and Signal Provider Agreements (Scaling Plan). All assets and trading activities are purely virtual. Please note that we do not offer CFD (Contract for Difference) challenges to residents of Canada and the United States. All content and information on this website is for informational purposes only and should not be interpreted as financial advice. Also, remember that results achieved in the past are no guarantee of future results. It is essential to understand the risks associated with trading. If you are unsure, always consult an independent financial advisor.