The Trading Pit Week Ahead Market Outlook (February 5 – February 11)
As we enter the week of 5-11 February, financial markets are still reacting to last week's unexpectedly high Non-Farm Payroll report, which sent the US Dollar soaring against major currencies like the EURUSD, AUDUSD, NZDUSD, and the potential breakout in GBPUSD. This week, as volatility is expected to ramp up starting with Fed Chair Powell's speech, the stakes are high with a lineup of crucial economic releases on the docket. From the ISM Services index to Australia's trade balance and pivotal interest rate decisions, there's a wealth of data poised to sway market sentiment. This concise preview hints at the rich analysis and insights that follow. Dive deeper below to navigate the potential market shifts and strategise effectively in the week ahead.
The market's surprise last week was the unexpected NFP report, which was much higher than the forecast. In events like this, when the actual number hits the estimates, the markets react in a way that may cause directional moves. On Friday, after the NFP report, the US Dollar appreciated and gained strength, adding to the development of a downtrend on the EURUSD, AUDUSD, NZDUSD and perhaps the breakout to the downside of the GBPUSD consolidation.
The Japanese Yen’s weakness helps the Greenback bid the market higher continuously. The market volatility is expected to increase from Monday onwards, with Powell’s speech being the week's first event. Last week, the FED kept the Interest Rates unchanged at 5.5%. Here is a summary of the FOMC press conference. They stated that the economy is growing steadily, but job growth has slowed slightly. Still, there are many jobs available, and unemployment remains low. Inflation, however, is still high compared to last year. They aim to have lots of employment and keep inflation at around 2%.
They said they were managing the risks of inflation and employment better now. They are watching inflation closely because they are still determining how the economy will do. They decided to keep the federal funds rate target range steady at 5.25% to 5.5% to help with their goals. They will look at new information and how things are changing before making decisions about the federal funds rate. They will only lower the rate if they are sure inflation is nearly 2%. They will also keep reducing the government and mortgage-backed securities they own to help control inflation.
On the same day, they will report the ISM Services number in the US and expect to read a number above the benchmark 50. An appreciation of the US Dollar by the market participants can add to the dollar's strength this week.
In Australia, on Monday, the Trade Balance number will be released. As a commodity currency, the AUD is sensitive to events like this, as this shows the difference between the imports and exports in the country. On Tuesday, it is time for the Reserve Bank of Australia to report their Interest Rates. They estimated keeping the unchanged and leaving them at 4.35%. Generally speaking, reading the technical chart, the Aussie is one of the weakest currencies.
If the Interest Rates stayed unchanged and the market followed through, we expected more weakness in the currency. Therefore, it gives room for the AUDUSD and the AUDCAD to decline and strengthen both the EURAUD and GBPAUD. Regarding the EURO, on Tuesday, the Eurozone will report the Retail Sales for December, which is expected to remain at 0.1%.
On Friday, they will report the Harmoinize CPI, an inflationary measurement scheduled to stay at 3.1% in Germany. The banks in New Zealand will be closed on Monday due to Waitangi Day. On Tuesday, the unemployment rate is expected to rise 4.3% from 3.9%, and the employment change will increase from -0.2% to 0.3%. On Thursday, the Reserve Bank of New Zealand will announce the Inflation expectations for the first Quarter. So far, the only available information is the last report at 2.76%. A piece of positive news can help the Kiwi to gain strength. However, currently, the NZDUSD is trending downward.
On Friday, Canada will report the unemployment rate, which is expected to increase from 5.8% to 5.9%. If this happens and the Loonie (Short for the Canadian Dollar) weakens, the USDCAD may offer tradable opportunities to the upside.
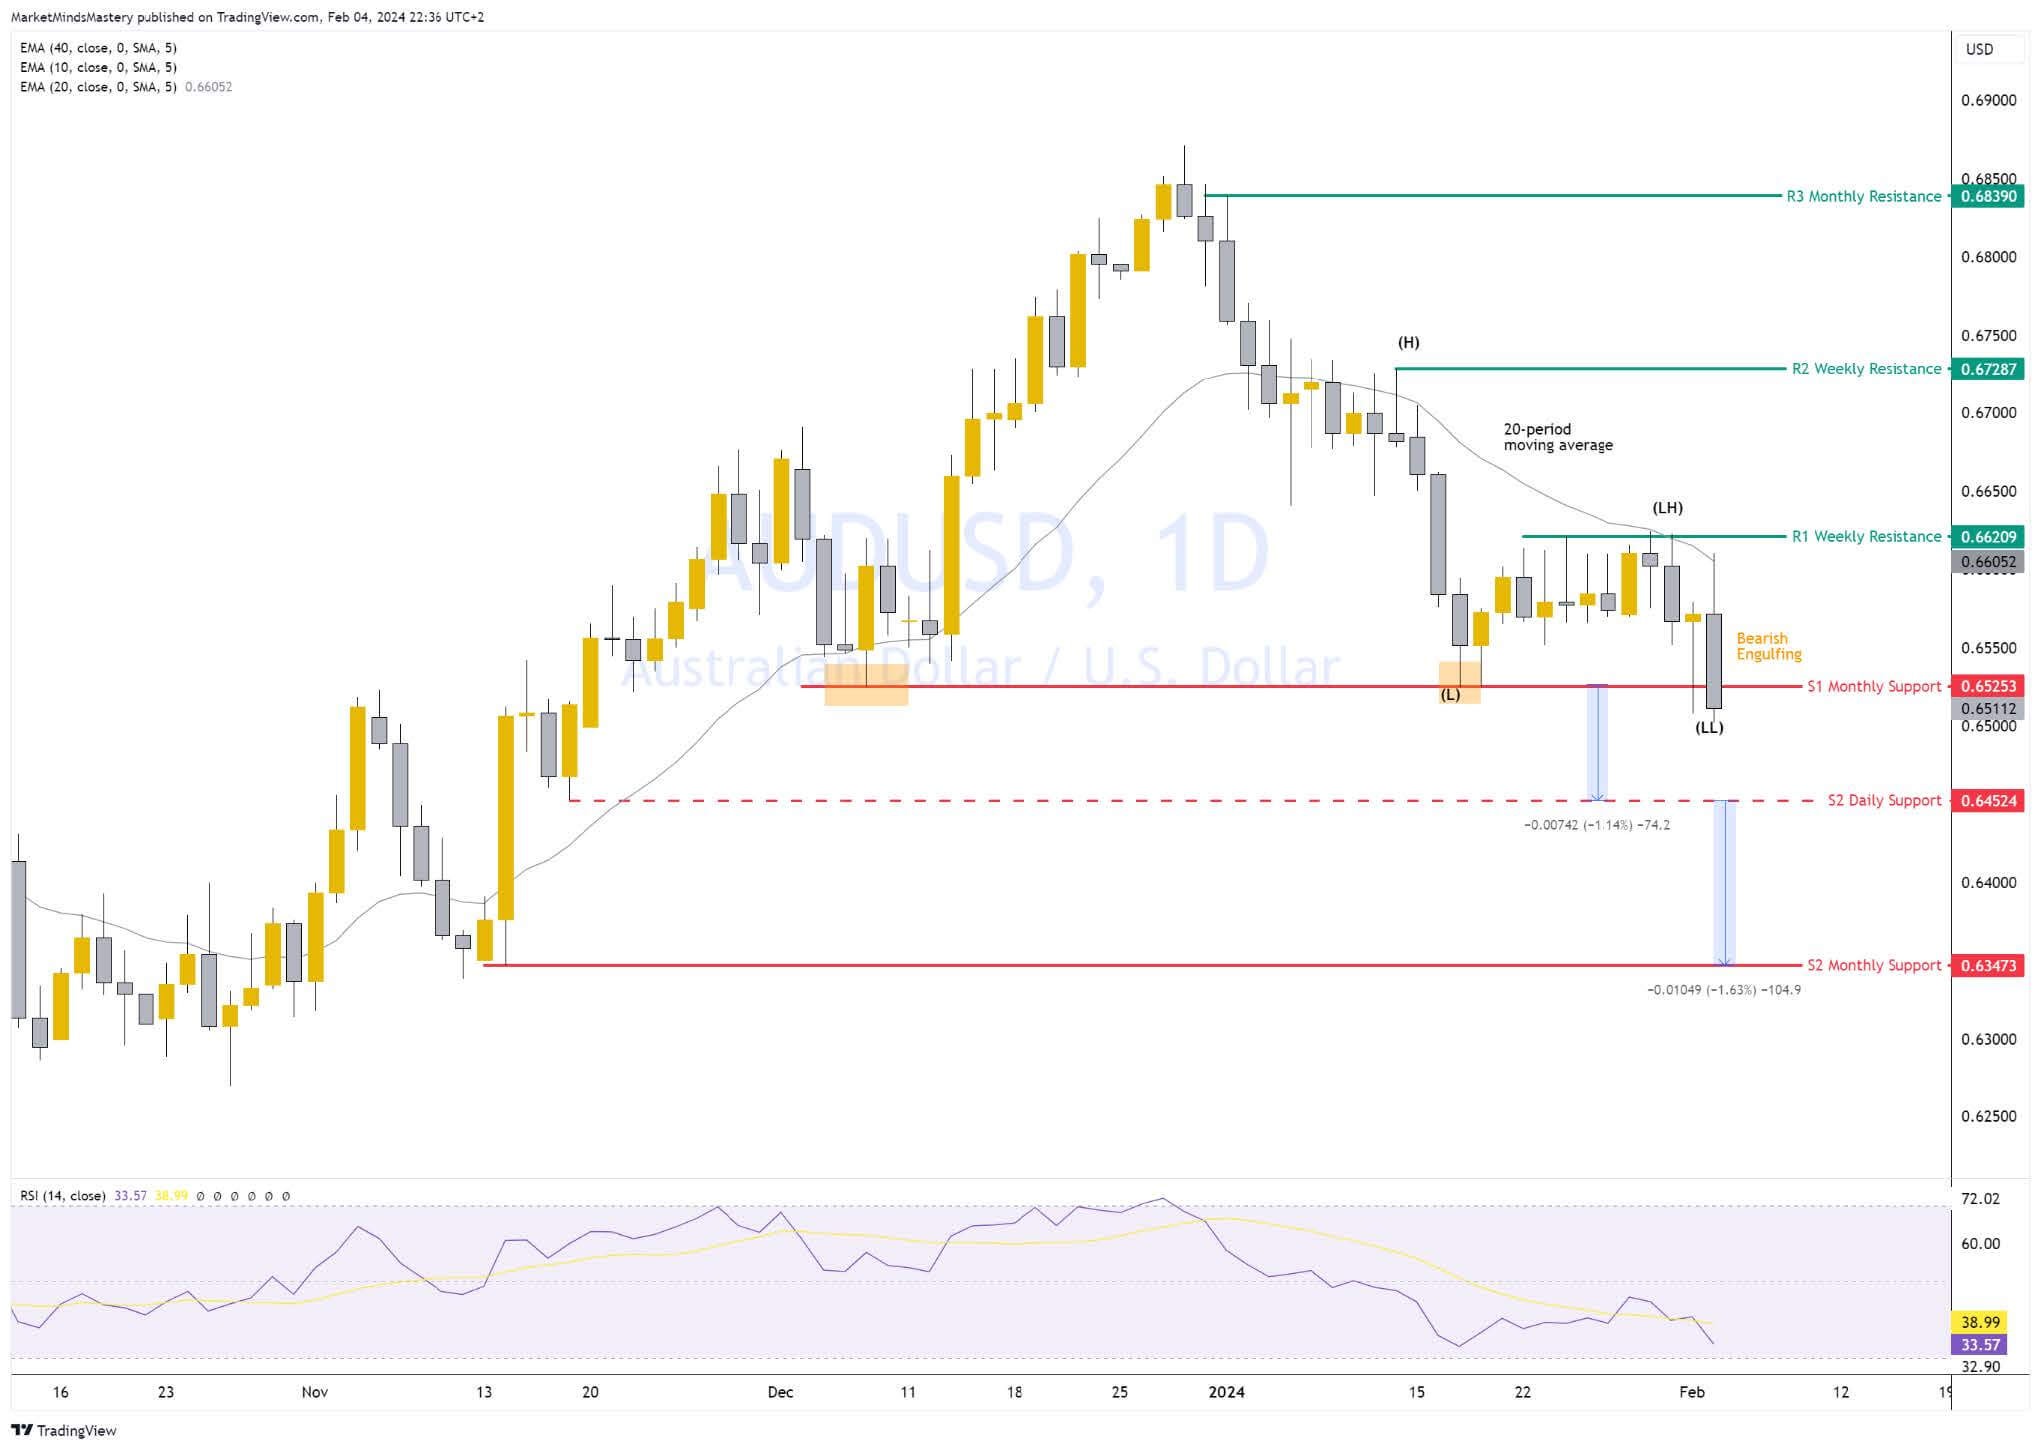
AUDUSD

The price on the daily chart ended as a Bearish Engulfing reversal on Friday after the Non-Farm Payroll. This is significant because the price created a new market low (LL) just above 0.6500. If the price continues lowering, the next area of support, S2, will be around 0.6425. A break and close below it can lead the price to the next area of support, S3, approximately 100 pips, around 0.6347. If the price bounces upwards, the first resistance, R1, is a weekly level around 0.6620. The RSI is below 50, indicating bearish momentum.
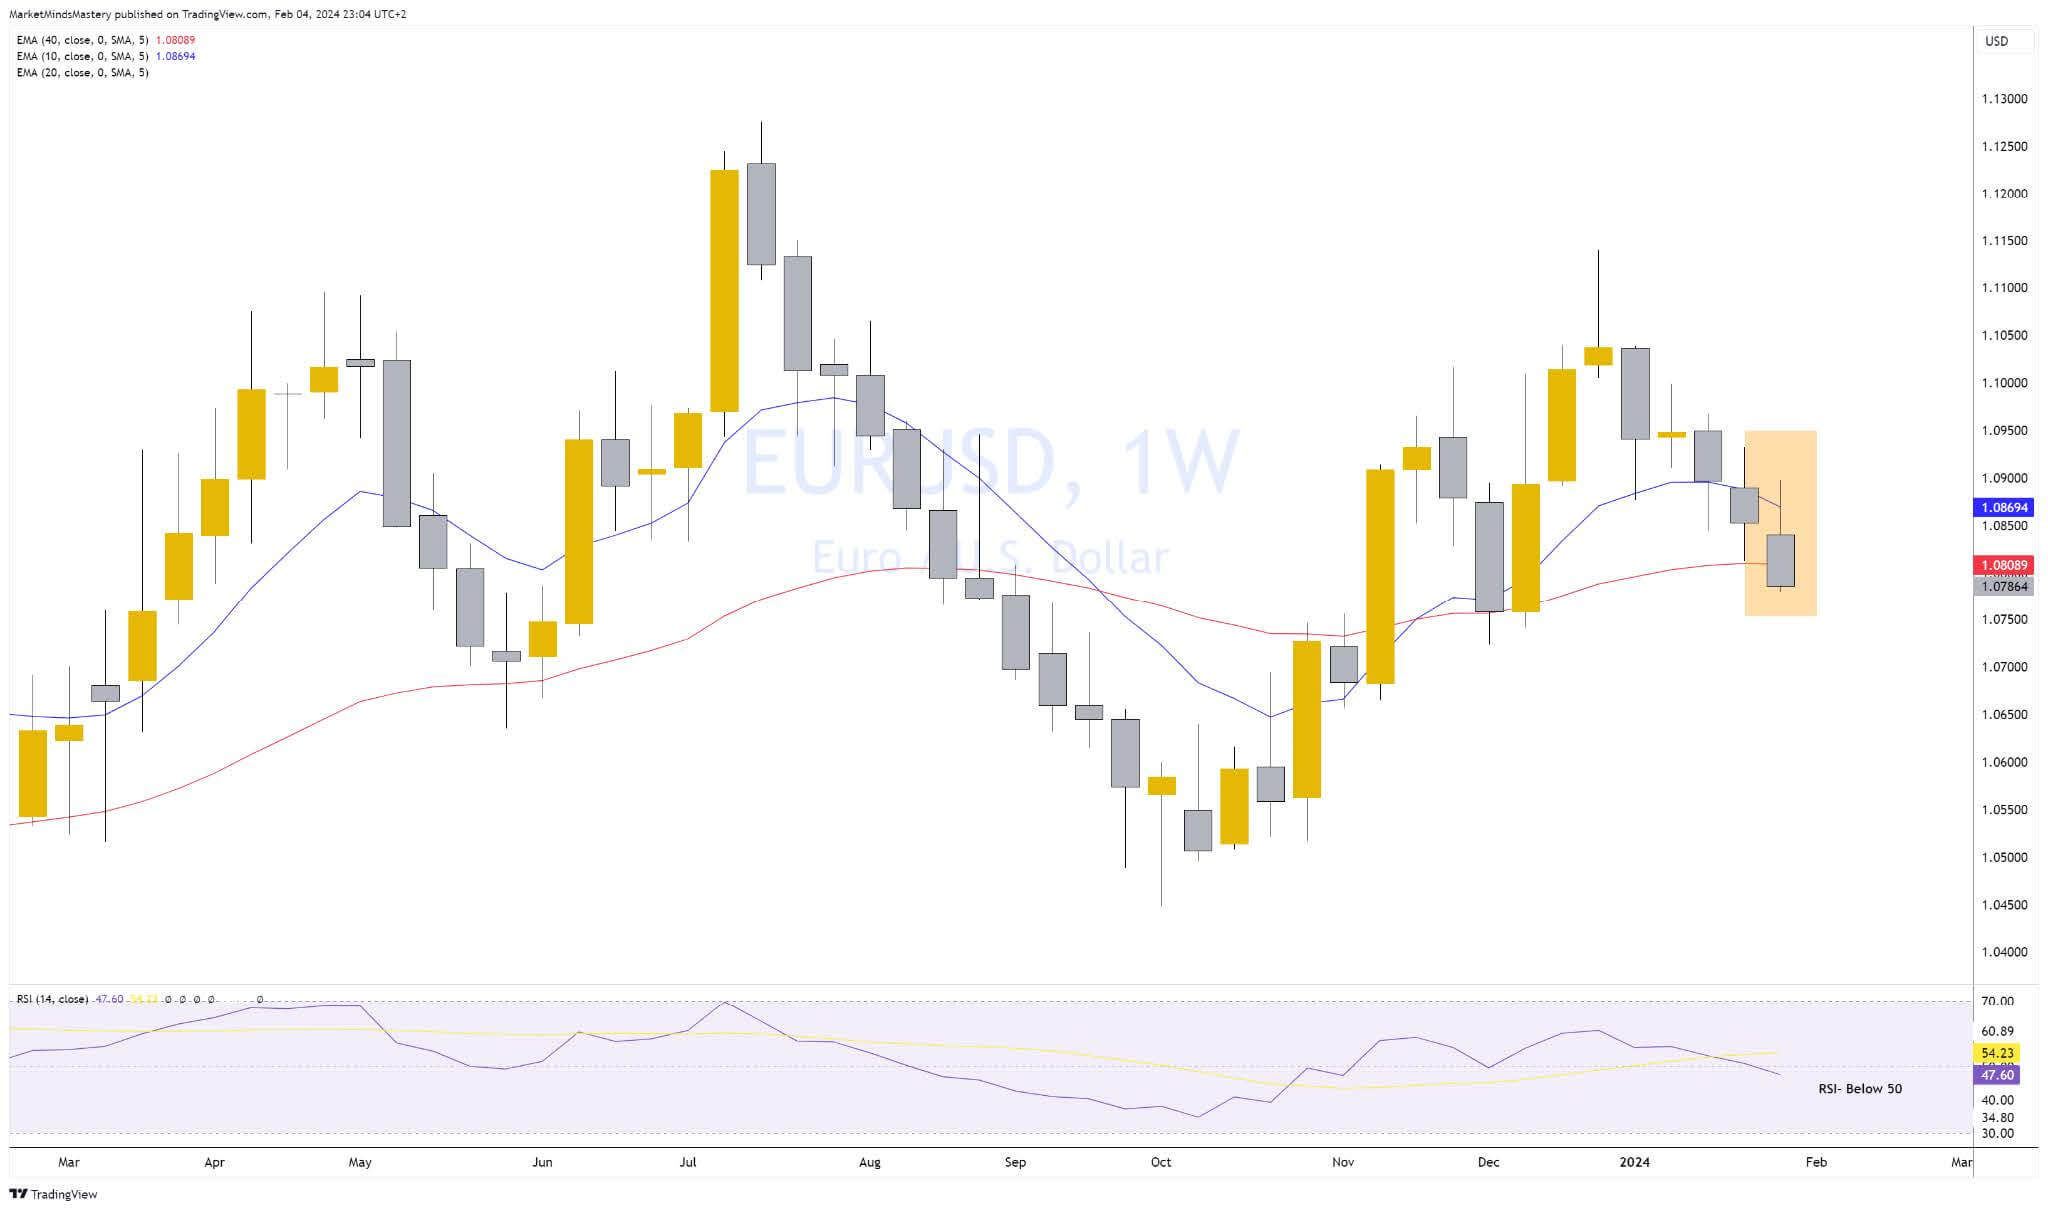
EURUSD, Weekly
The price on the weekly chart ended as a bearish candle, rejected the 20-period weekly moving average and closed below the 40-period weekly moving average. Both indicate a bearish scenario. The weekly RSI is below 50, which is also bearish.
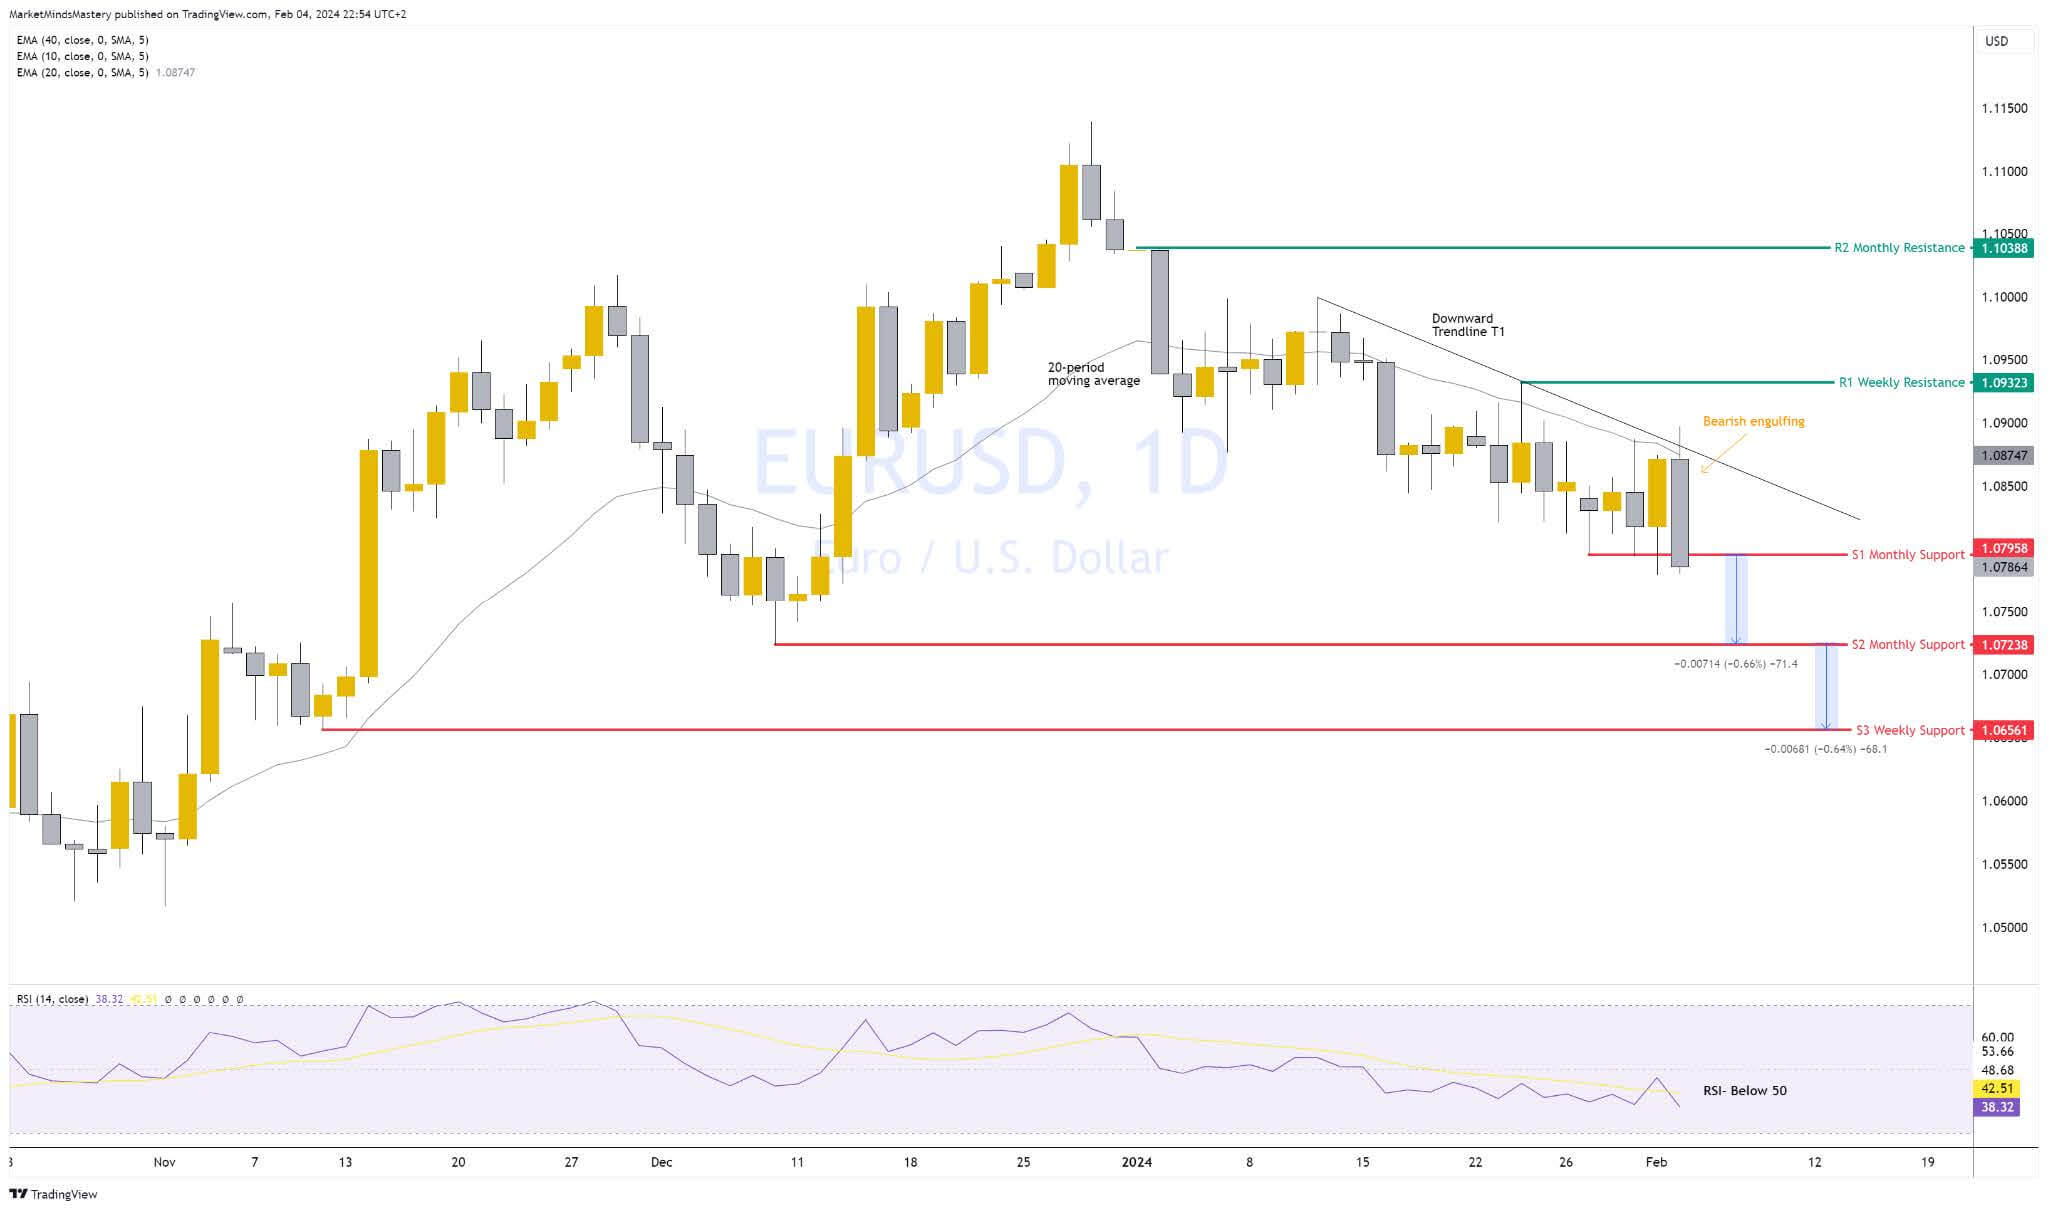
EURUSD, Dailly
The price rejected the 20-period moving average on the daily chart, which is bearish. On Friday, the downward trendline T1 was tested for the 3rd time. The bearish engulfing candle formed indicates the price will likely decline. Currently, the price is resting at the S1 monthly support of around 1.0795. If the selling pressure continues next week and the price declines, the next support area is the S2 monthly level, around 1.07238. If the price bounces upwards and moves higher, the first resistance area is the dynamic 20-period moving average along with the downward trendline T1.
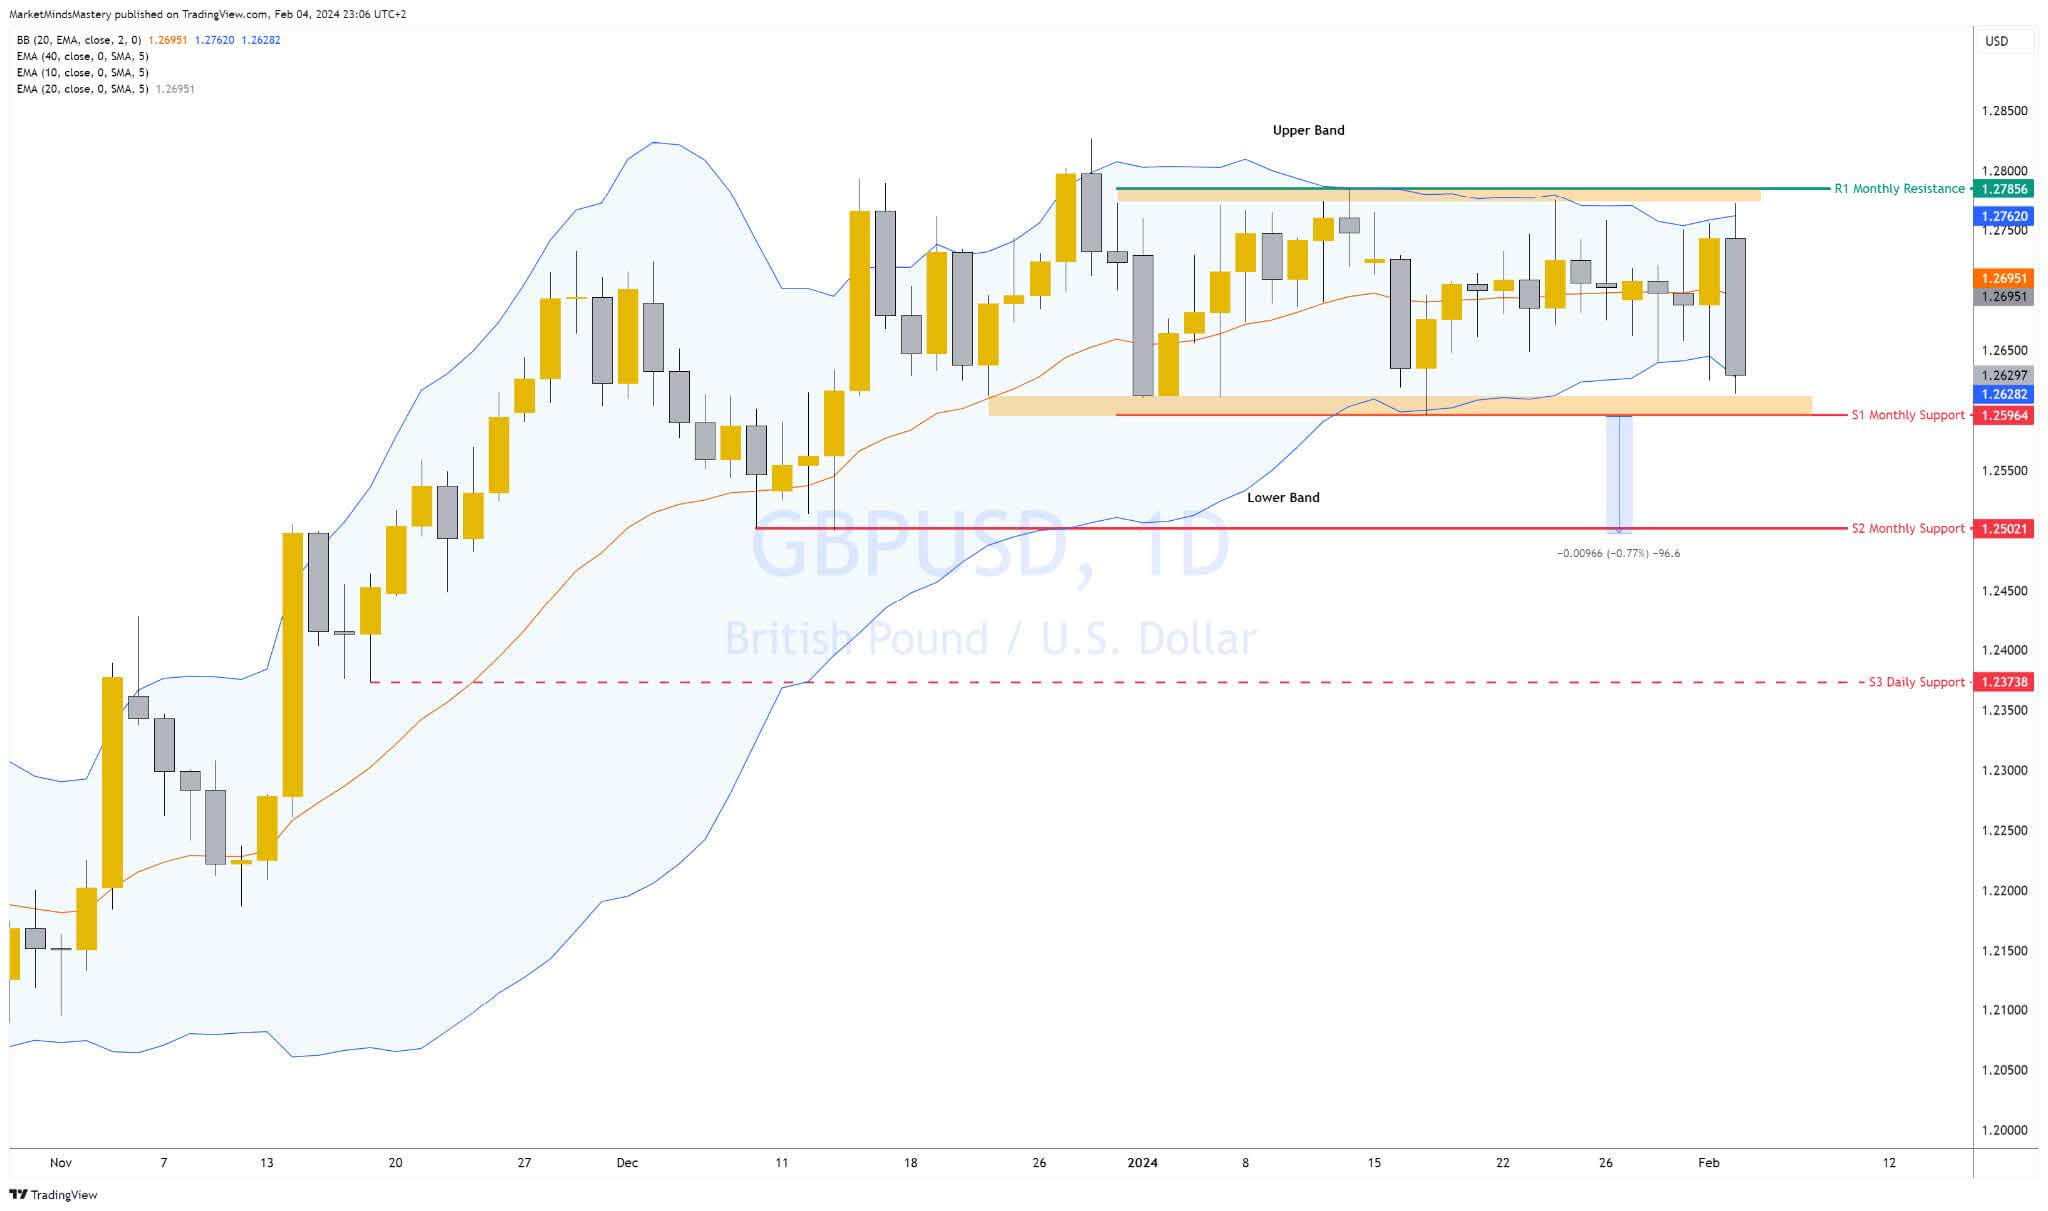
GBPUSD, Daily
Since the beginning of this year, the sterling has been strong and equally robust with the USD. This is why the GBPUSD currency pair is still trading with the range of S1 support around 1.2596 and the R1 resistance at approximately 1.2785. Using the Bollinger Bands, we see that the price is traded from the upper to the lower band without respecting the middle band. This is expected as the market is not trending. Currently, the price is approaching the S1 support. If it breaks below it and moves lower, the next support area is the monthly S2 level, around 1.25. This is a round number and a psychological level that traders monitor closely. Conversely, if the price bounces upwards, the top band and the R1 resistance around 1.2785 will be the first resistance.
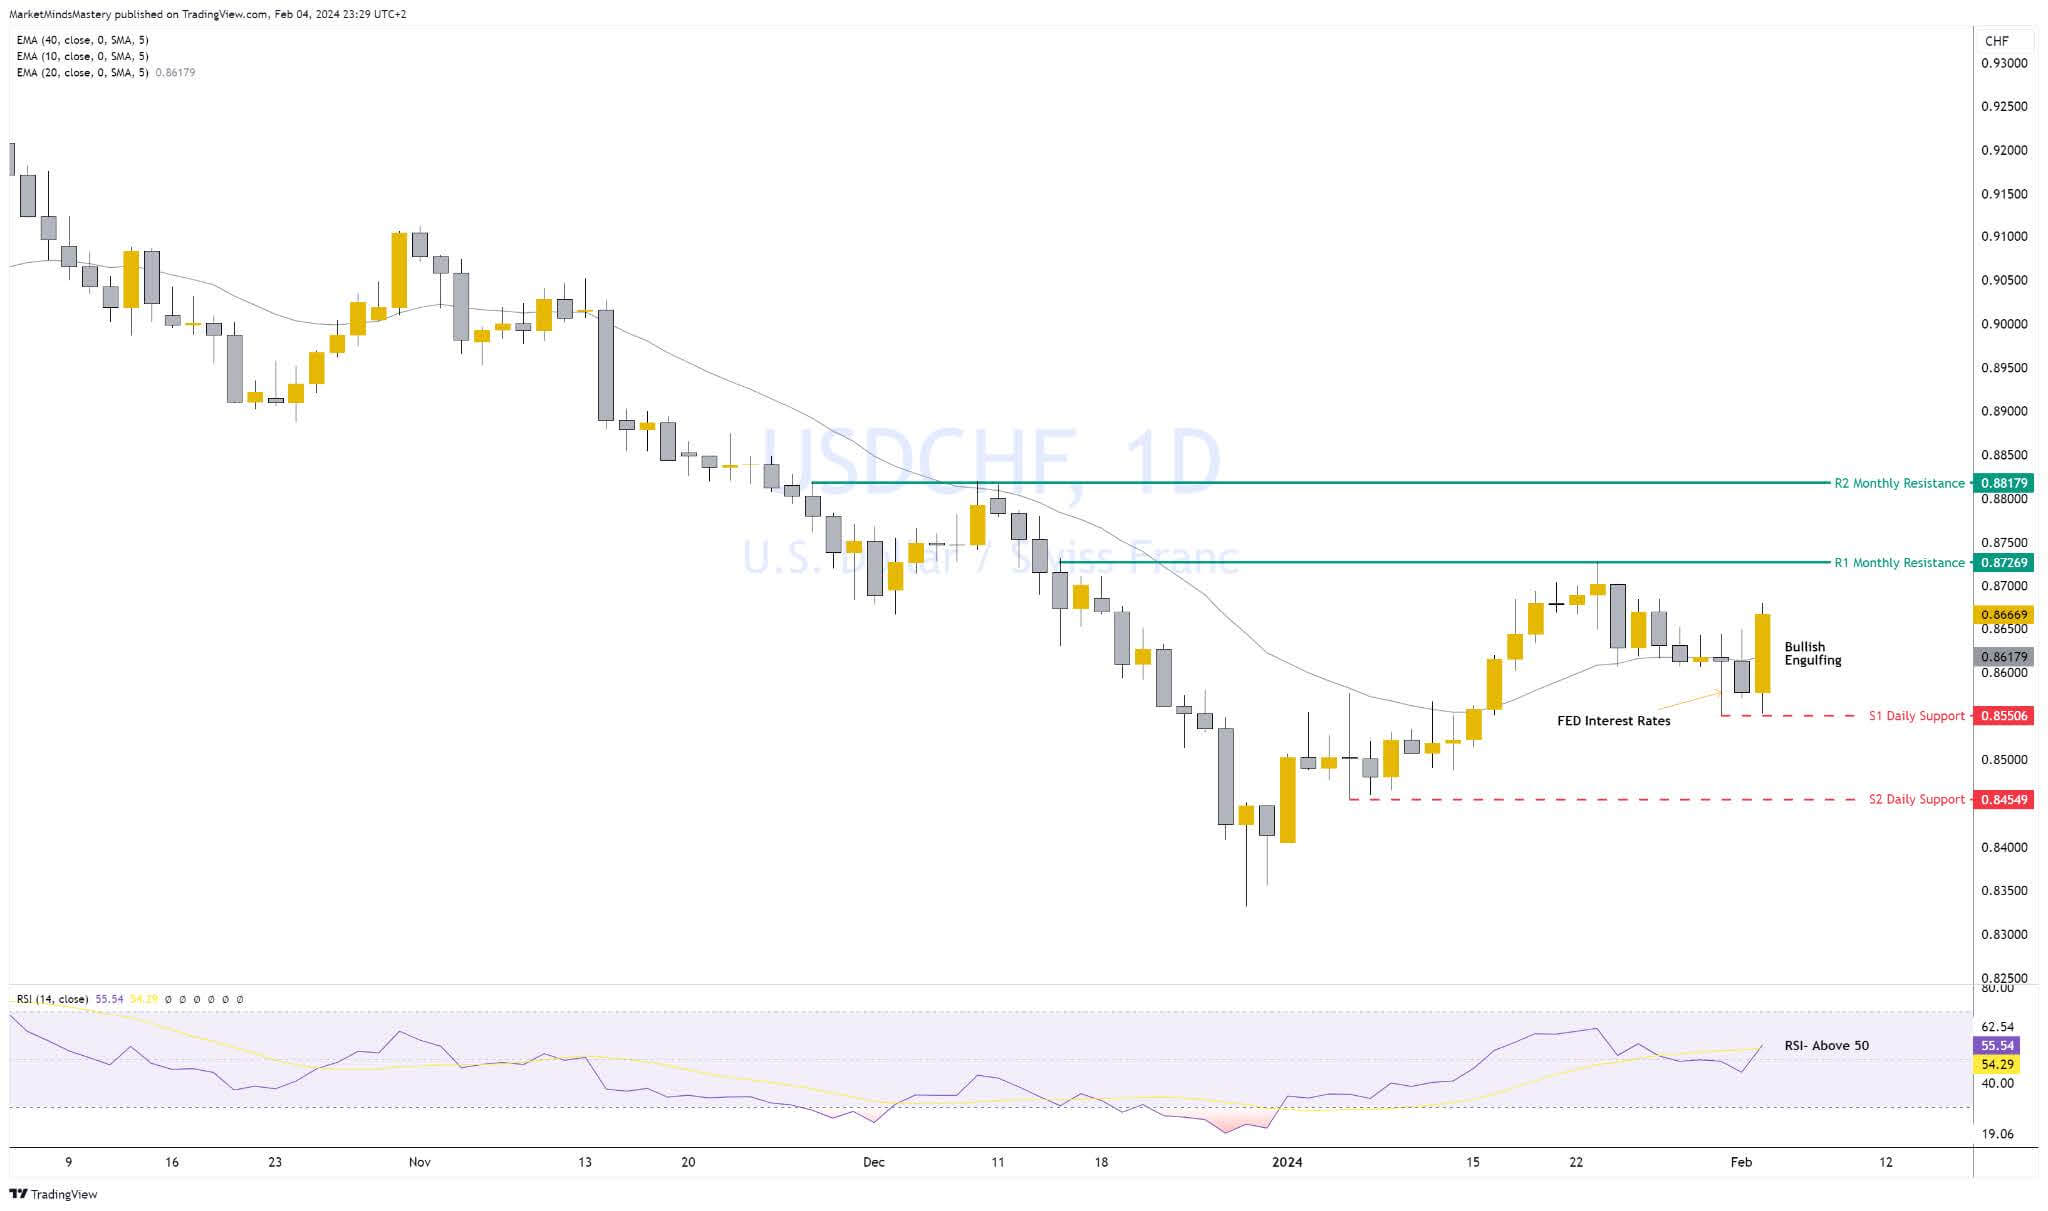
USDCHF Daily
The bullish engulfing candle will likely set up the tone for USD strength this week. The price closed above the 20-period moving average, and this is bullish. If we pay close attention to the chart, we will observe that when the FED reported unchanged interest rates in the US, the price rejected the 20-period moving average. This indicated bullish pressure in the market. However, the market was expecting the NFP report before a directional move. If the price continues moving upwards this week, the first resistance area, R1, is the high of the previous month's candle, around 0.8727. If it breaks and closes above it, the next resistance is the R2, around 0.88179. A move about the R1 resistance will create a new High in the market and signal the beginning of an uptrend on the Daily chart. On the other hand, if the price declines and moves lower, the S1 support around 0.8550 is expected to be tested. A further decline can be found in the price of the following support, the S2, around the 0.8454 level. The RSI on the Daily chart is above 50, indicating a bullish sentiment.
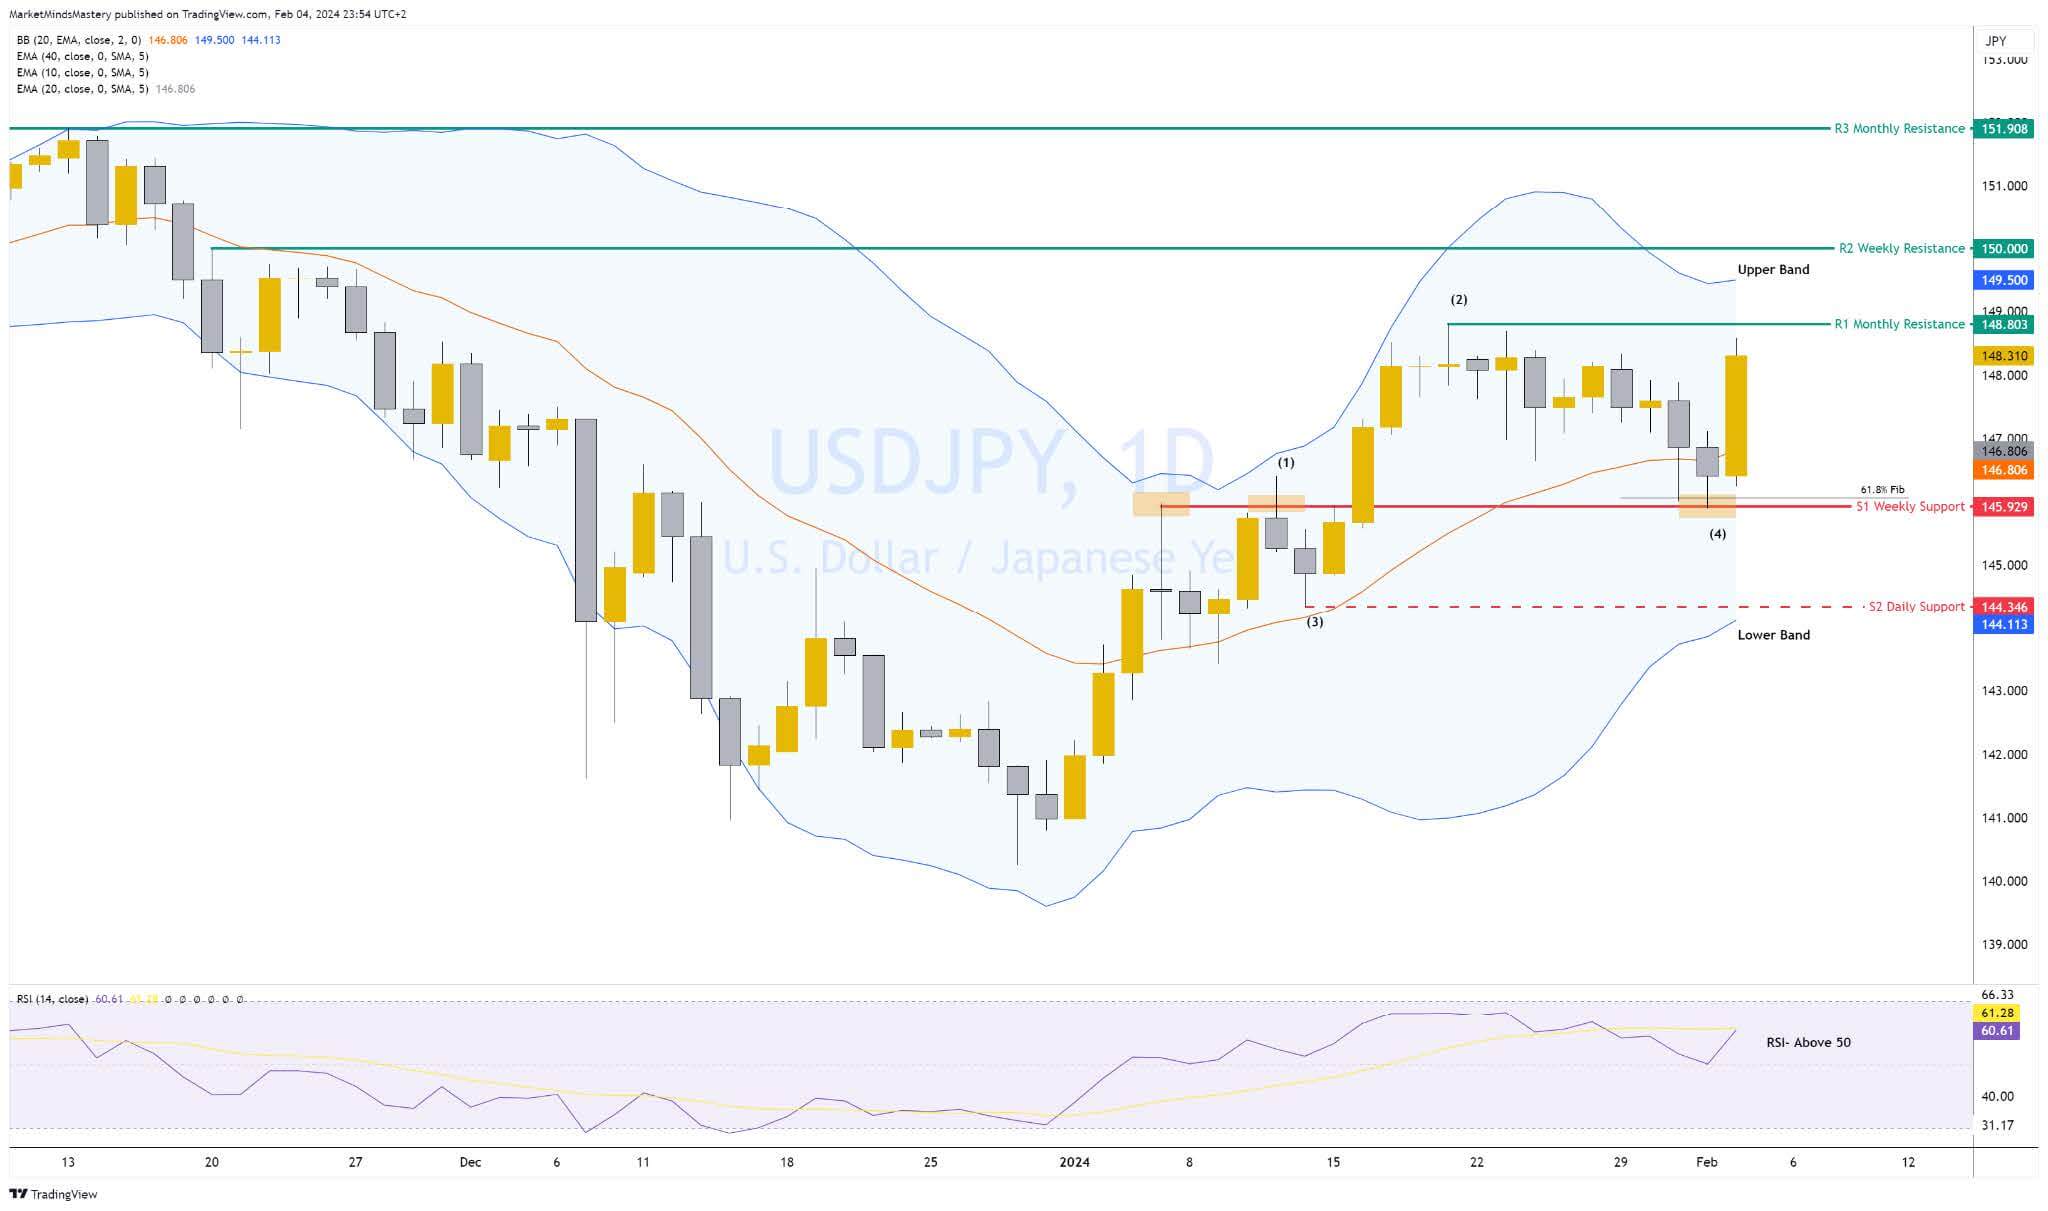
USDJPY Daily
We are used to the Bank of Japan keeping their interest rates around 0.1%. When the USD strengthens, usually, the USDJPY rallies. The price on the Daily chart formed a series of Higher highs and higher lows as per points (1) to (4). As per the technical picture, this is a buyers' market. The price closed above the band's middle on Friday, indicating a bullish bias. The price tested the 0.618 Fibonacci golden number ratio successfully drawn from the swing low at (3) to the swing high at (2). The RSI is above 50, and this is also bullish. The price tested the recent swing high as support and bounced upwards. If the price continues upward, the first resistance becomes the R1 resistance around 148.80. The upper band becomes the first dynamic resistance if the price breaks above it. A move higher can meet the R2 resistance of around 150. Any decline occurs, and if the price moves lower, the area between the Fibonacci 0.618 and the S1 support, approximately at 146, will be the first area of support. If the price declines further, the next area of support is the S2, around 144.34. Any move below the S2 will break the uptrend and put the market into a trendless phase or a downtrend.
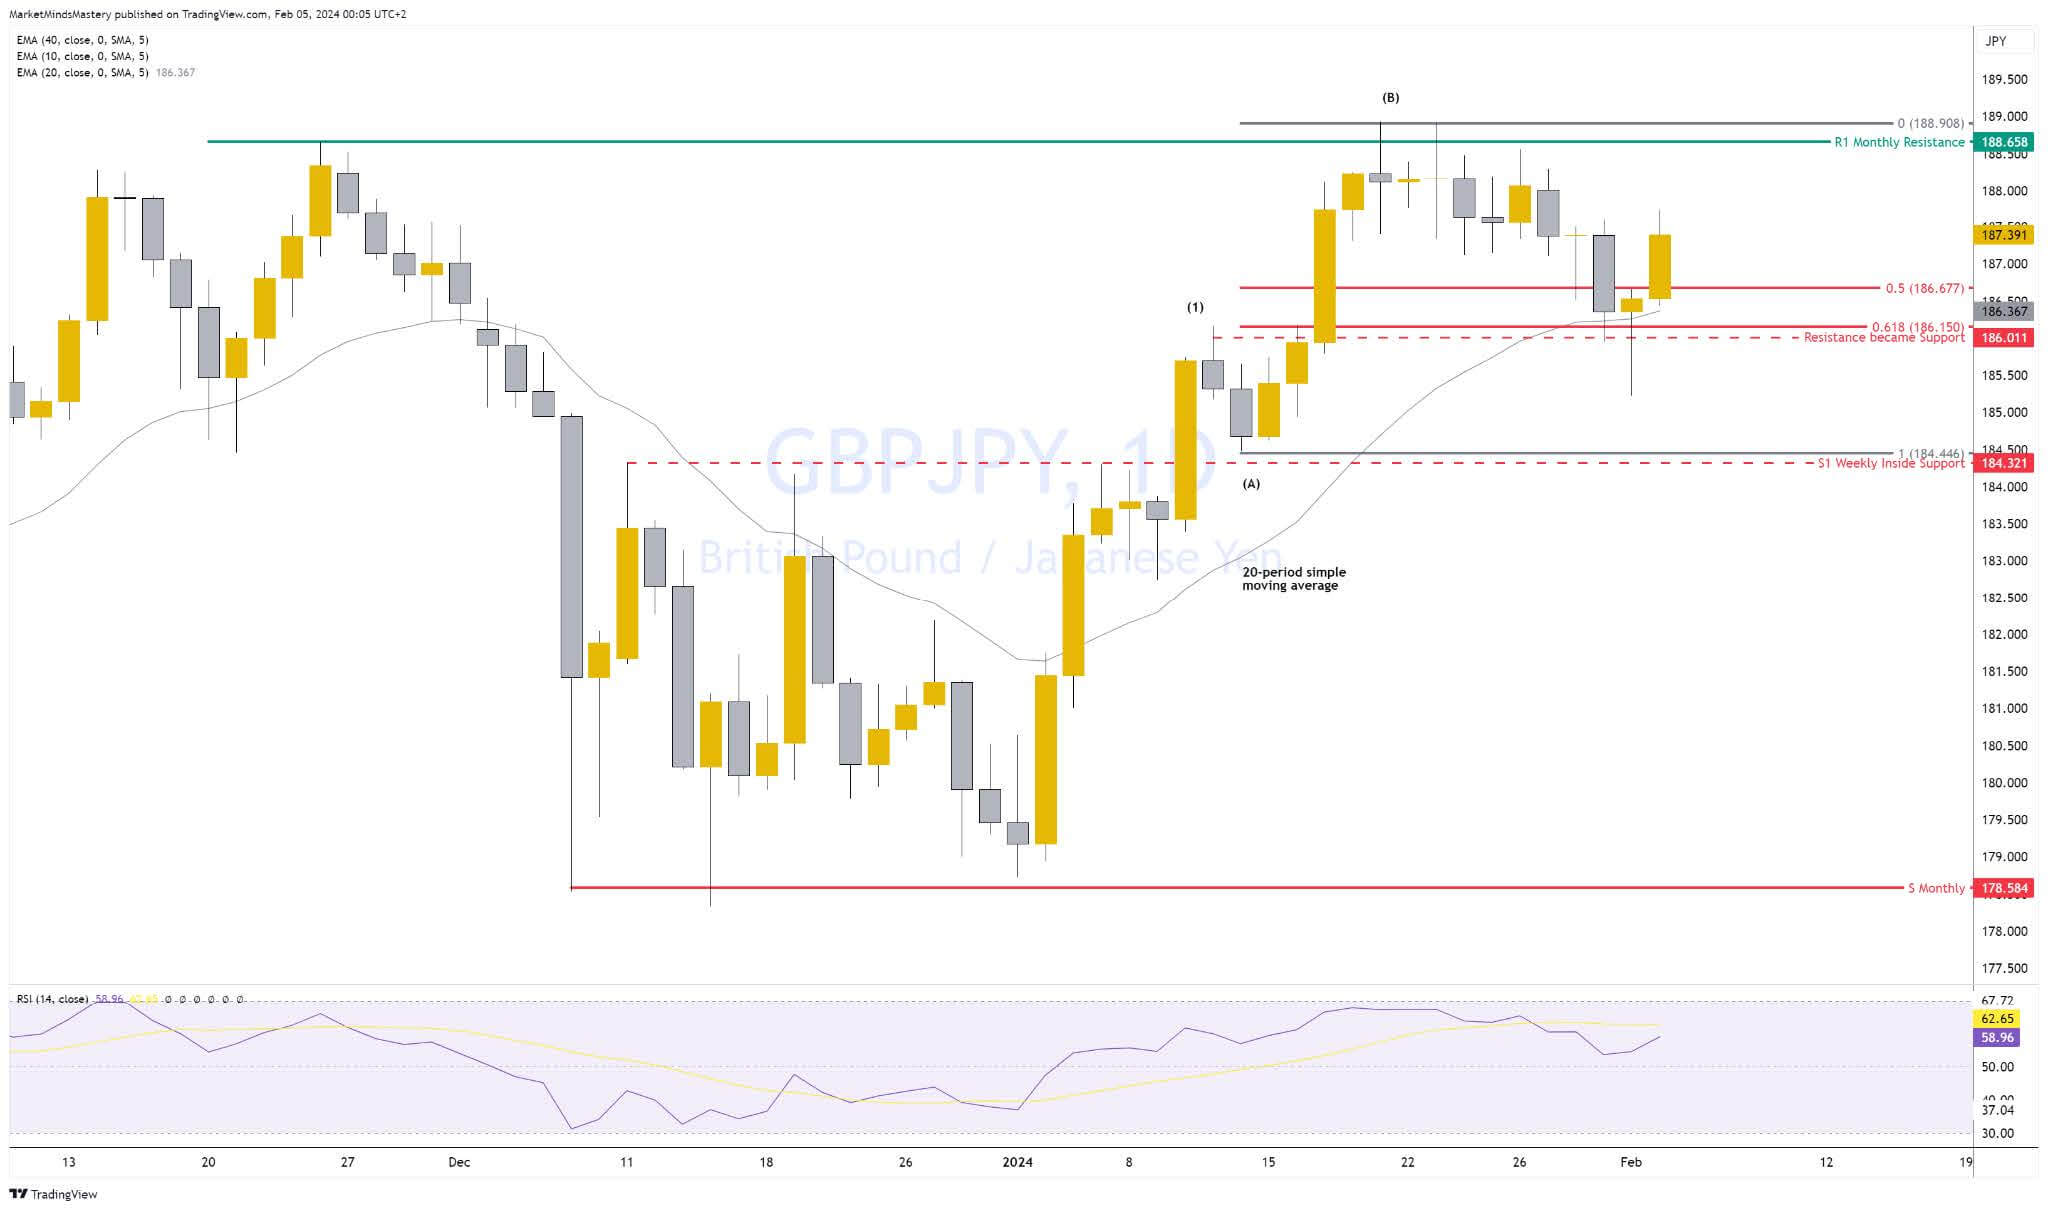
GBPJPY Daily
After the price declined from the R1 resistance a few weeks ago, it moved backwards until the support around 186. This support is significant because the swing high forms it at (1). Based on the law of polarity, that swing point was a support area, tested last week, and the price bounced upwards with a bullish hammer candle. That same level consists of the 61.8% retracement of the move from (A) to (B). At that point, the price met the dynamic support of the 20-period moving average, adding to the bullishness. From next week, If the price continues moving upwards, the first resistance area will be the R1 monthly resistance, approximately the 188.65 level. If the price declines and penetrates the low of the bullish hammer candle, there is inside weekly support, the S1, at around 184.32 level.
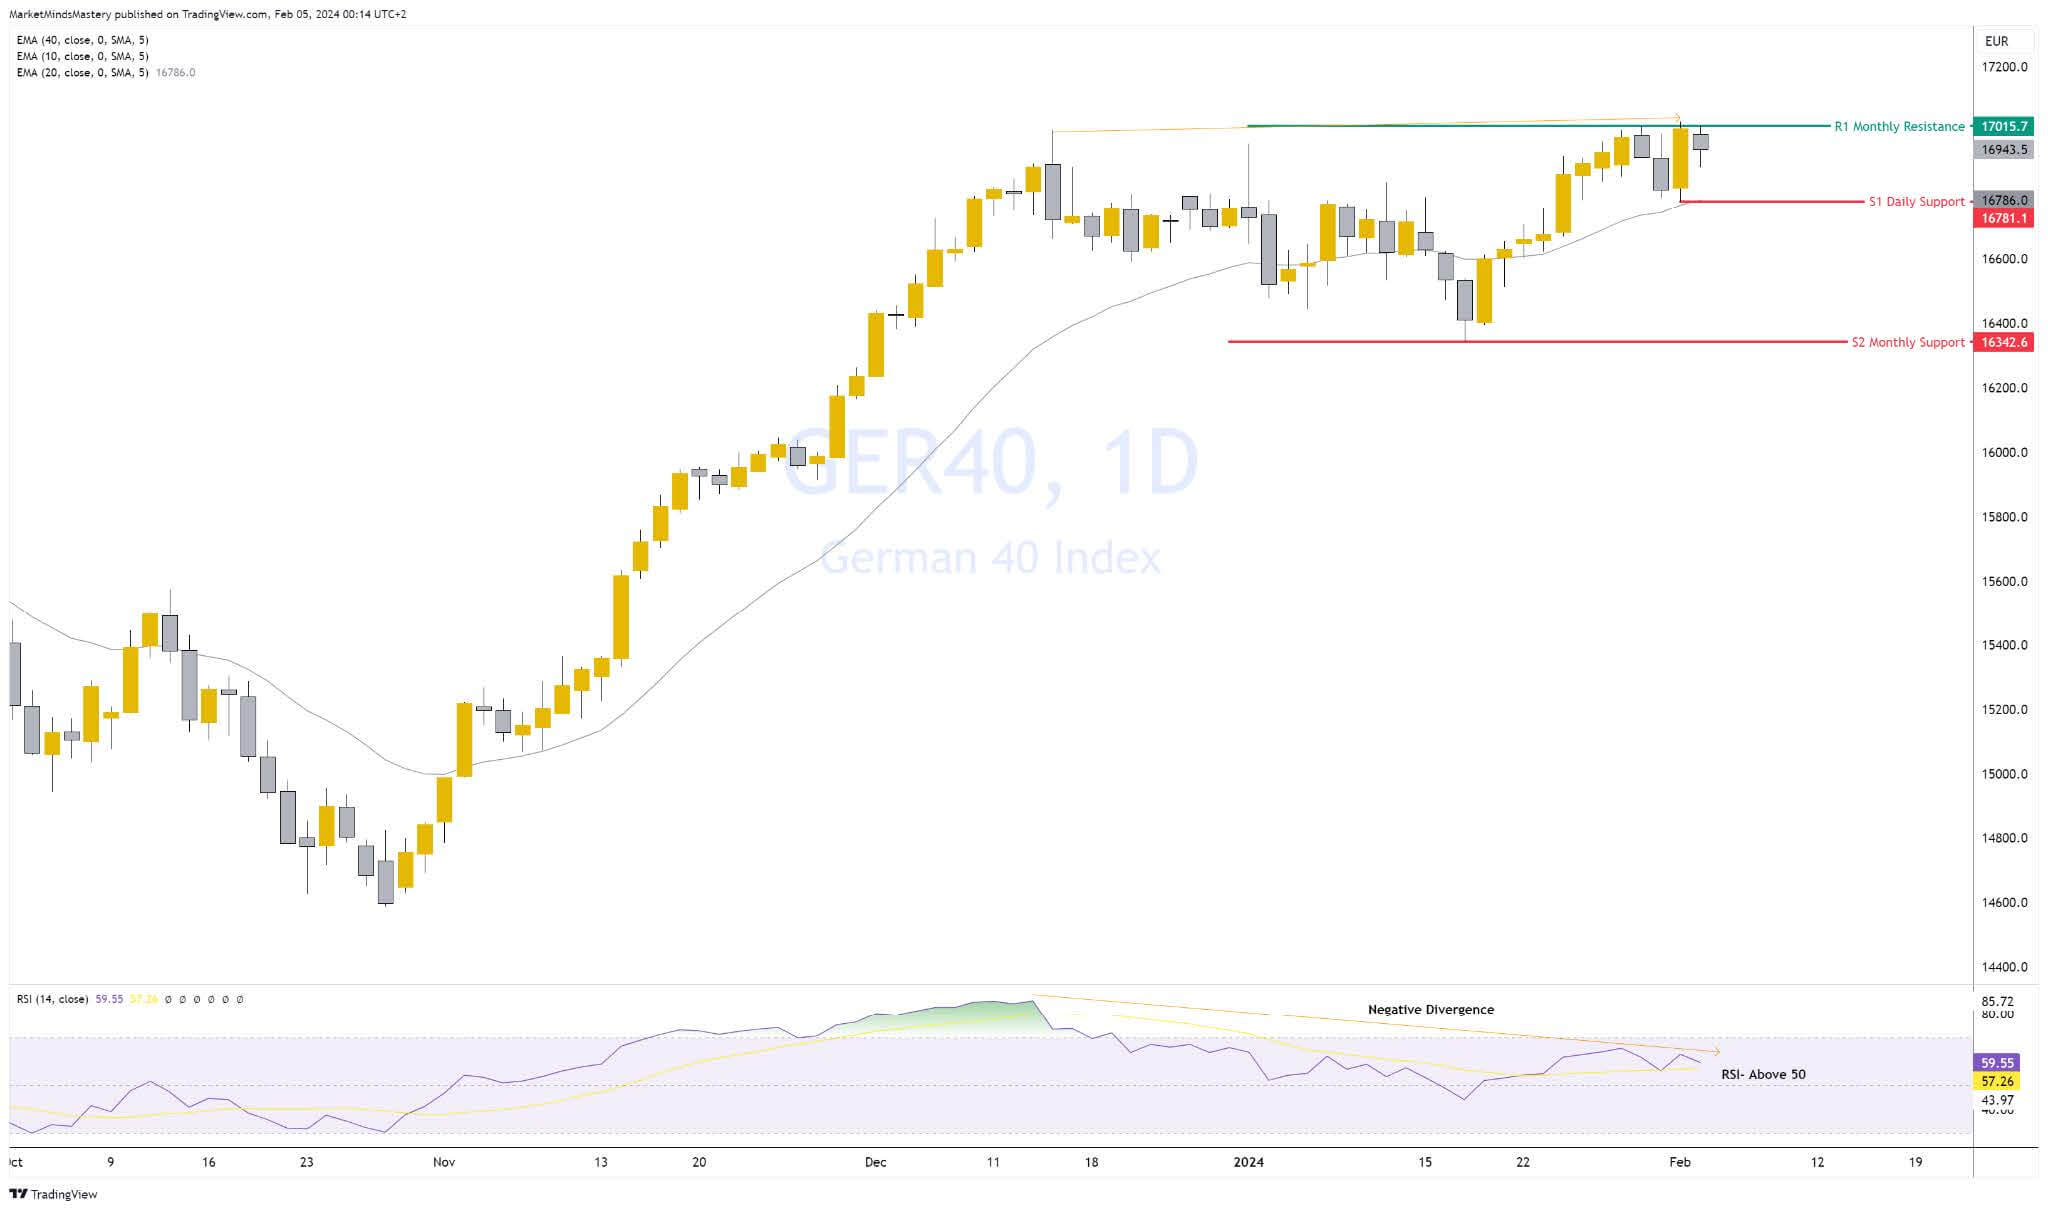
GER40
Like the significant US indices, the European Index registered its All-Time-High around 17029. The price still makes higher highs from an uptrend but lacks momentum based on the RSI oscillator showing negative or bearish divergences. This indicates that the price is running out of steam, which might create a correction. Traders usually wrongly interpret the Divergences as a change of trend, whereas divergences put the market in a corrective phase. The trend reversal, if occurred, will confirm a break of a significant swing and the creation of a new swing in the opposite direction. If the price declines from the R1 resistance and all-time high, the low of the bullish engulfing candle becomes the first support around 16781. If the price closes below the S1 and declines, the next support will be the S2, approximately at 16342. Conversely, if the price moves upwards and penetrates decisively the R1 resistance, it will create a new all-time high.
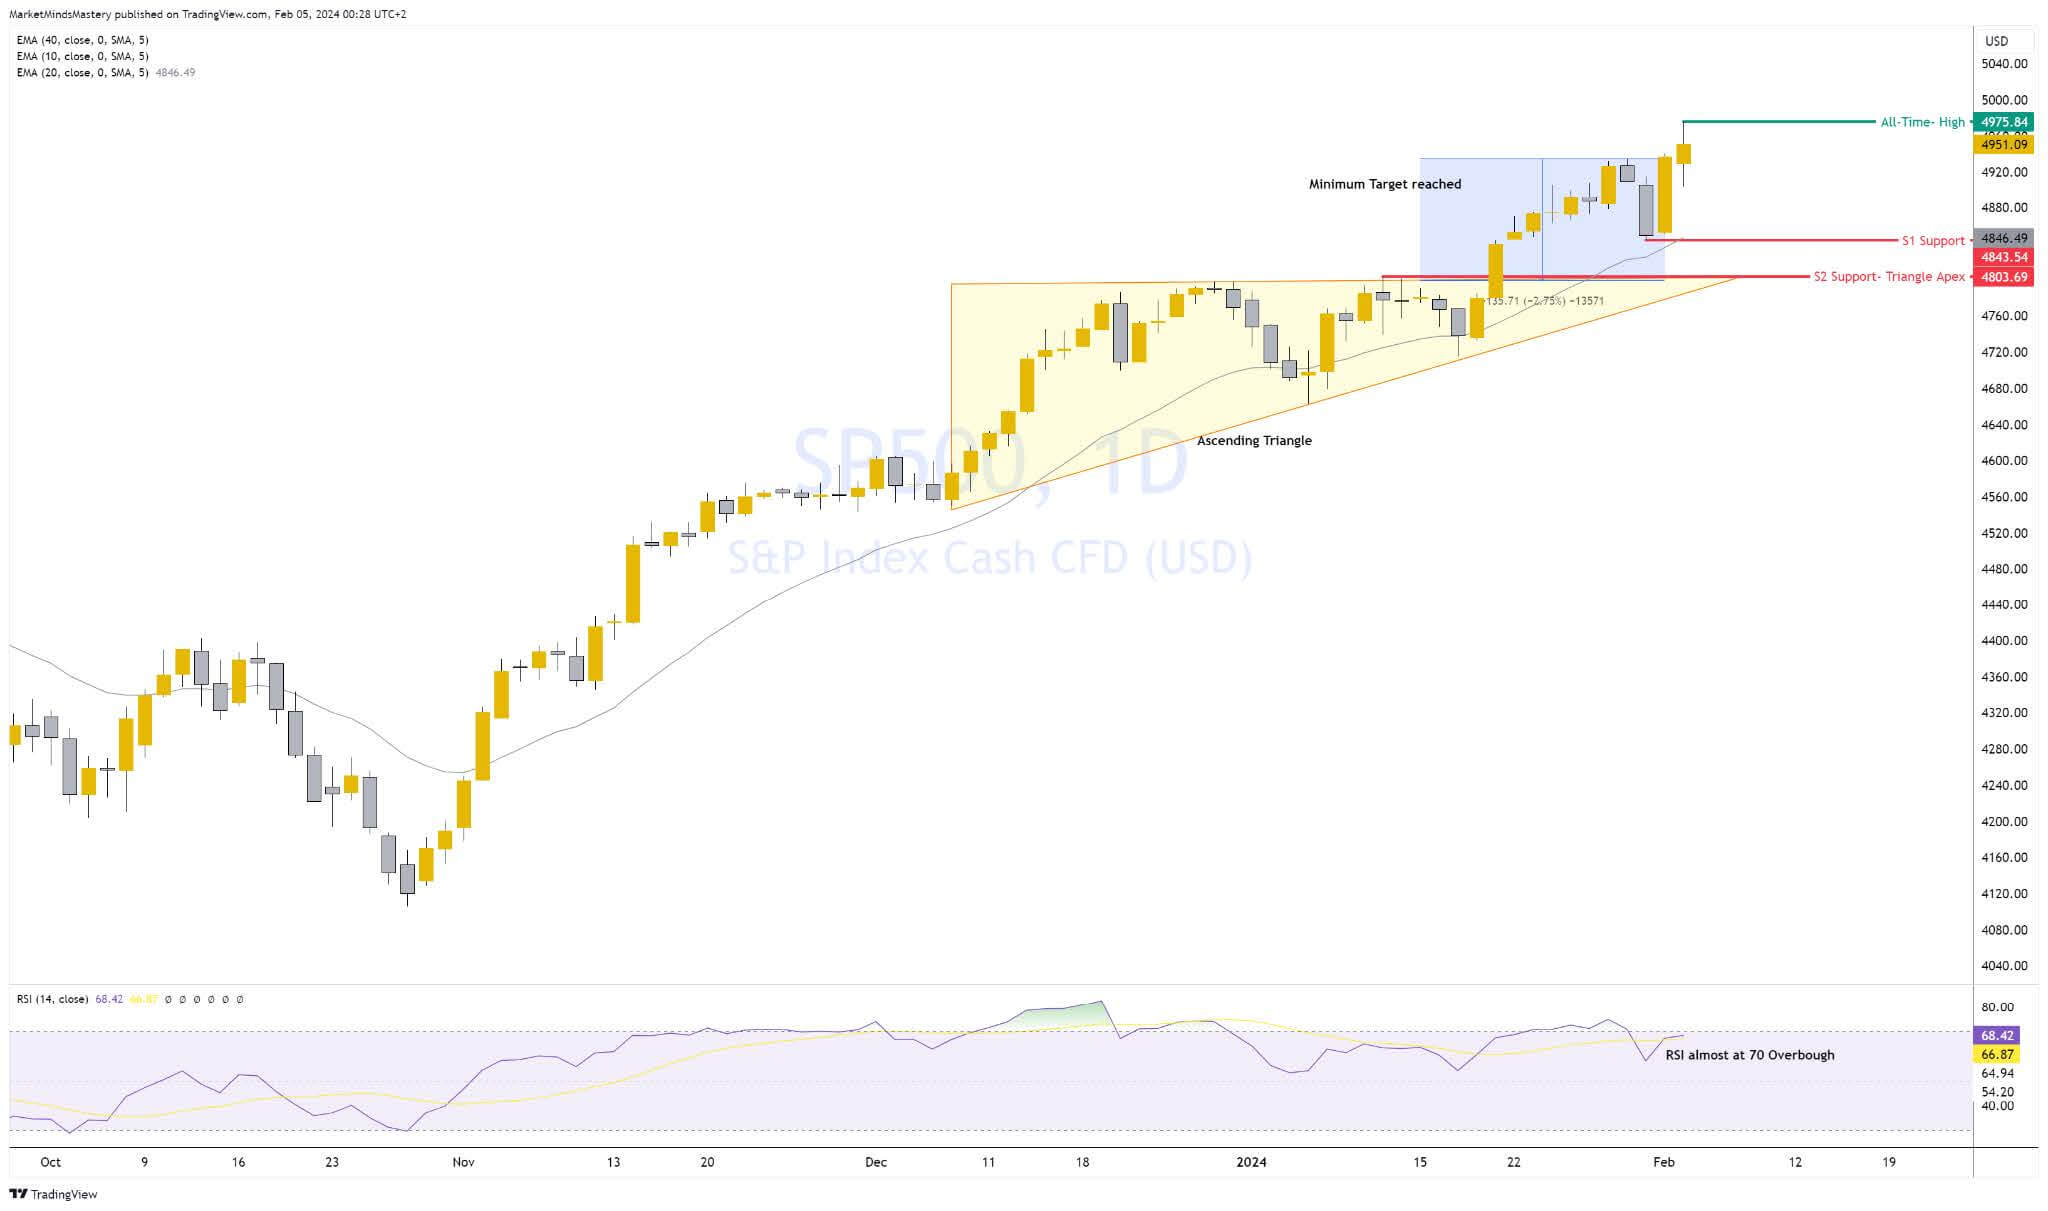
SP500
The SP500 set a new all-time high last Friday, and the index reached the 4975.8 area. The market is in a well-defined and established uptrend. The ascending triangle formed, and it reached its minimum target. The price is still trading above the 20-period moving average, which has bullish implications. The Price successfully forms higher highs and higher lows, which is also bullish. The RSI is almost overbought and still above 50, which confirms the bullish bias. If the price continues increasing, it will register a new all-time high. If the price declines and moves lower, the first support, S1, will be the recent swing low of around 4846.49. In this area, the market meets the 20-period moving average, too. If it declines further, the apex of the triangle can act as support around 4803.69.
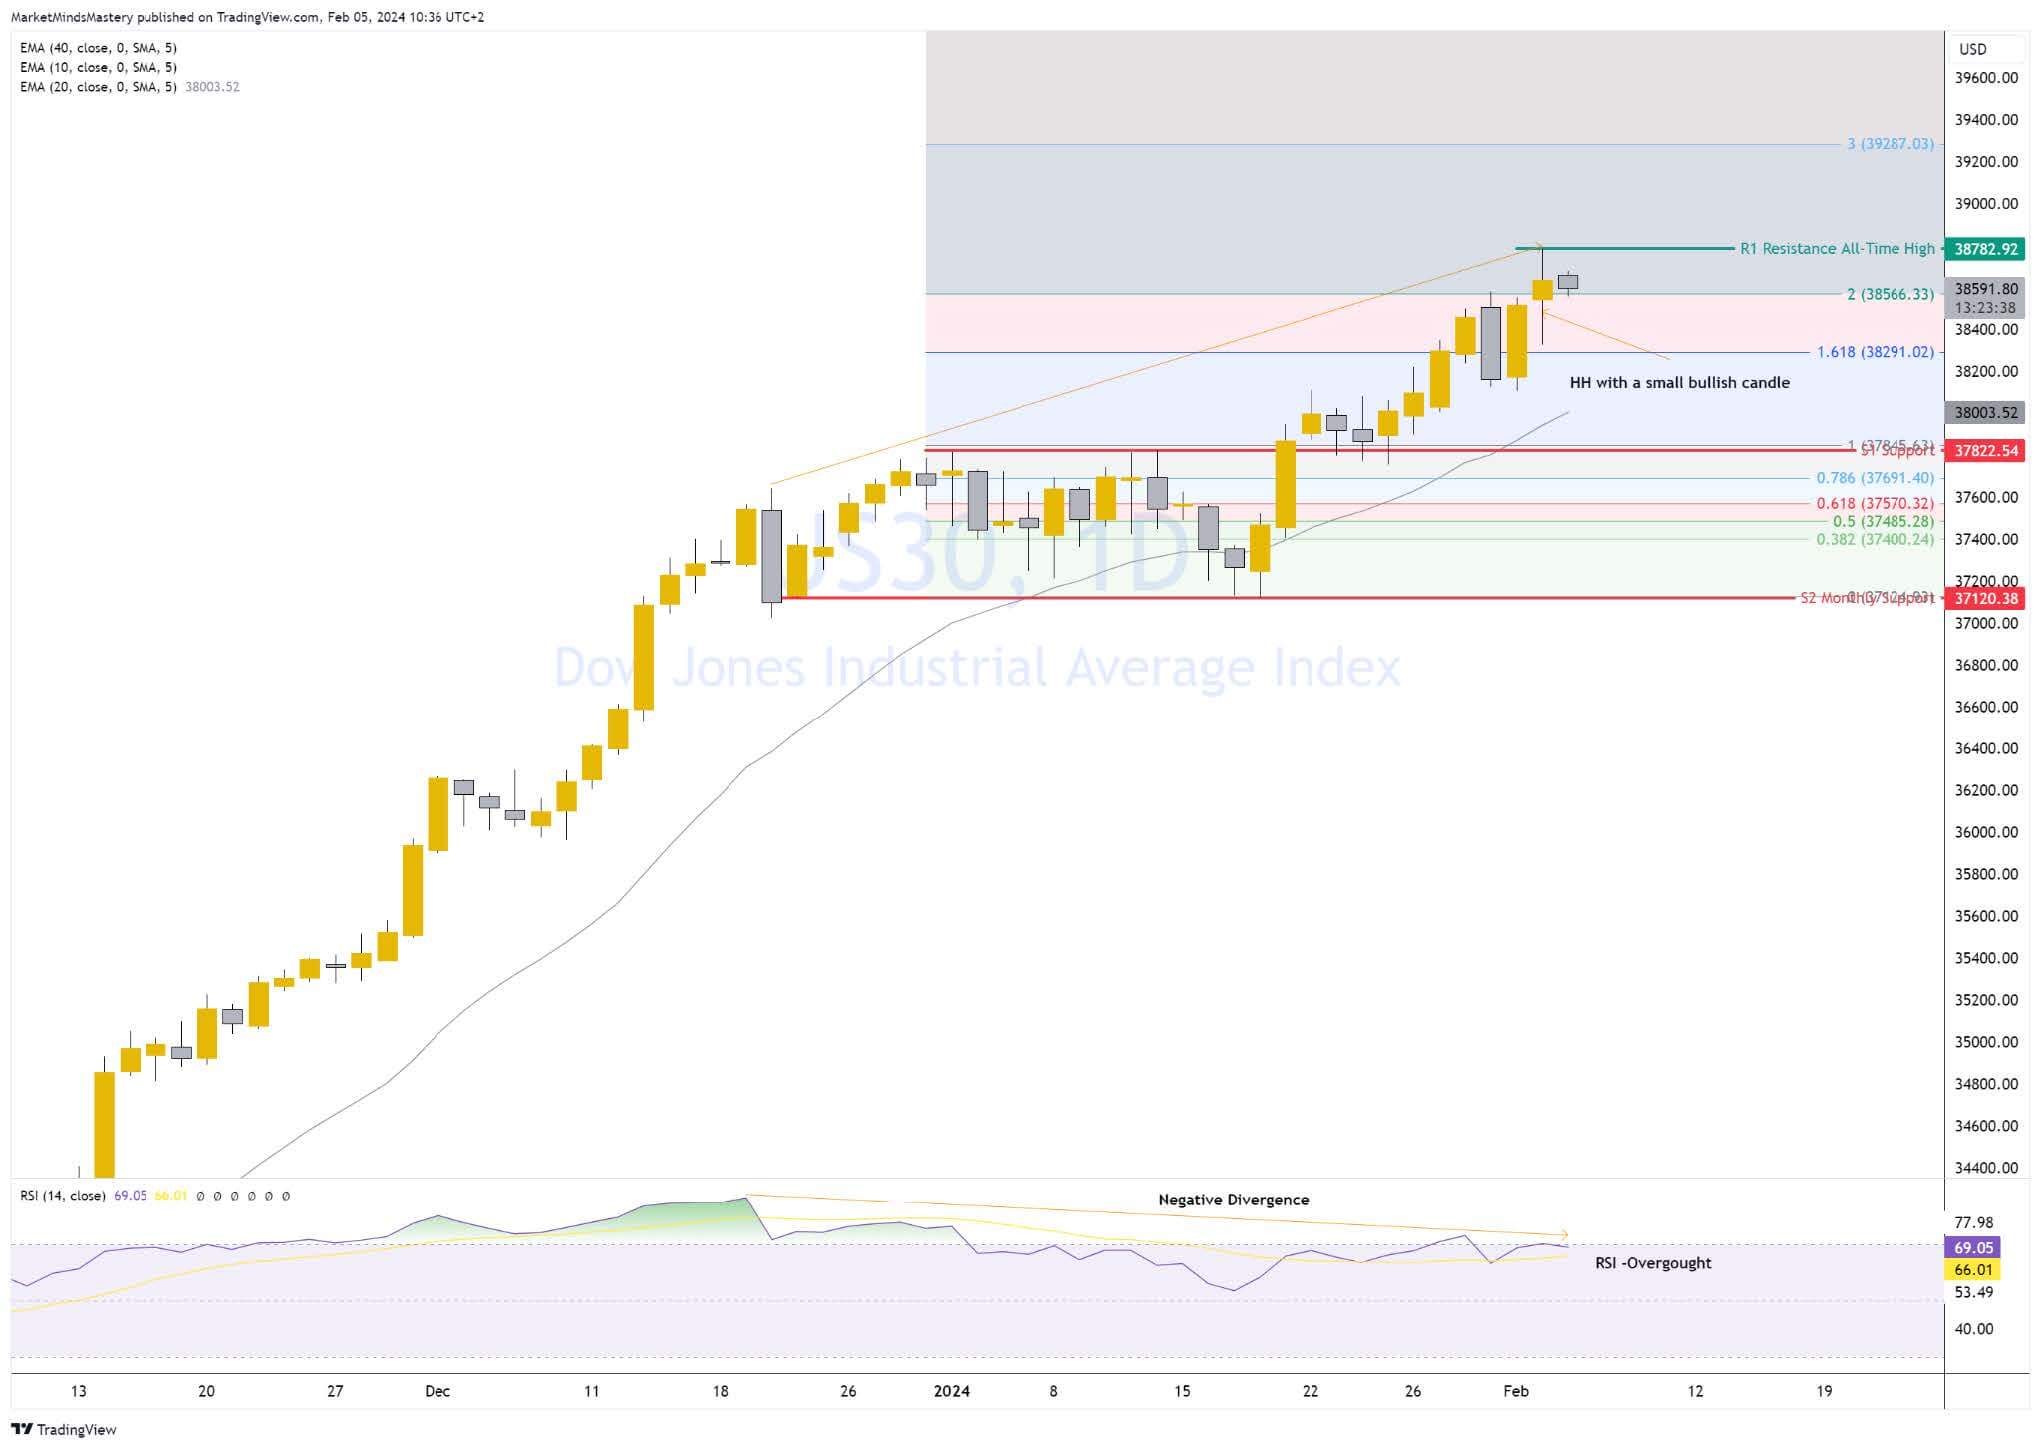
US30
The US30 is in a well-defined uptrend. The market created a higher high (all-time-high) around 38782 and a higher low formation around 37753. Last Friday, the price ended up as a spinning top after the Non-Farm Payroll announcement.
However, the price is above the 20-period moving average, indicating a bullish bias. If the price continues upwards, the next resistance level can be the 300% extension of the Fibonacci numbers around 39287. As the price is at an all-time high, there is no reference for a previous horizontal/static resistance.
The RSI oscillator shows negative divergences as the price advanced in a lack of momentum. Also, the RSI is overbought, which indicates the market is bullish but is subject to a correction. If the price declines and moves lower, the first area of support, S1, is around 37822.
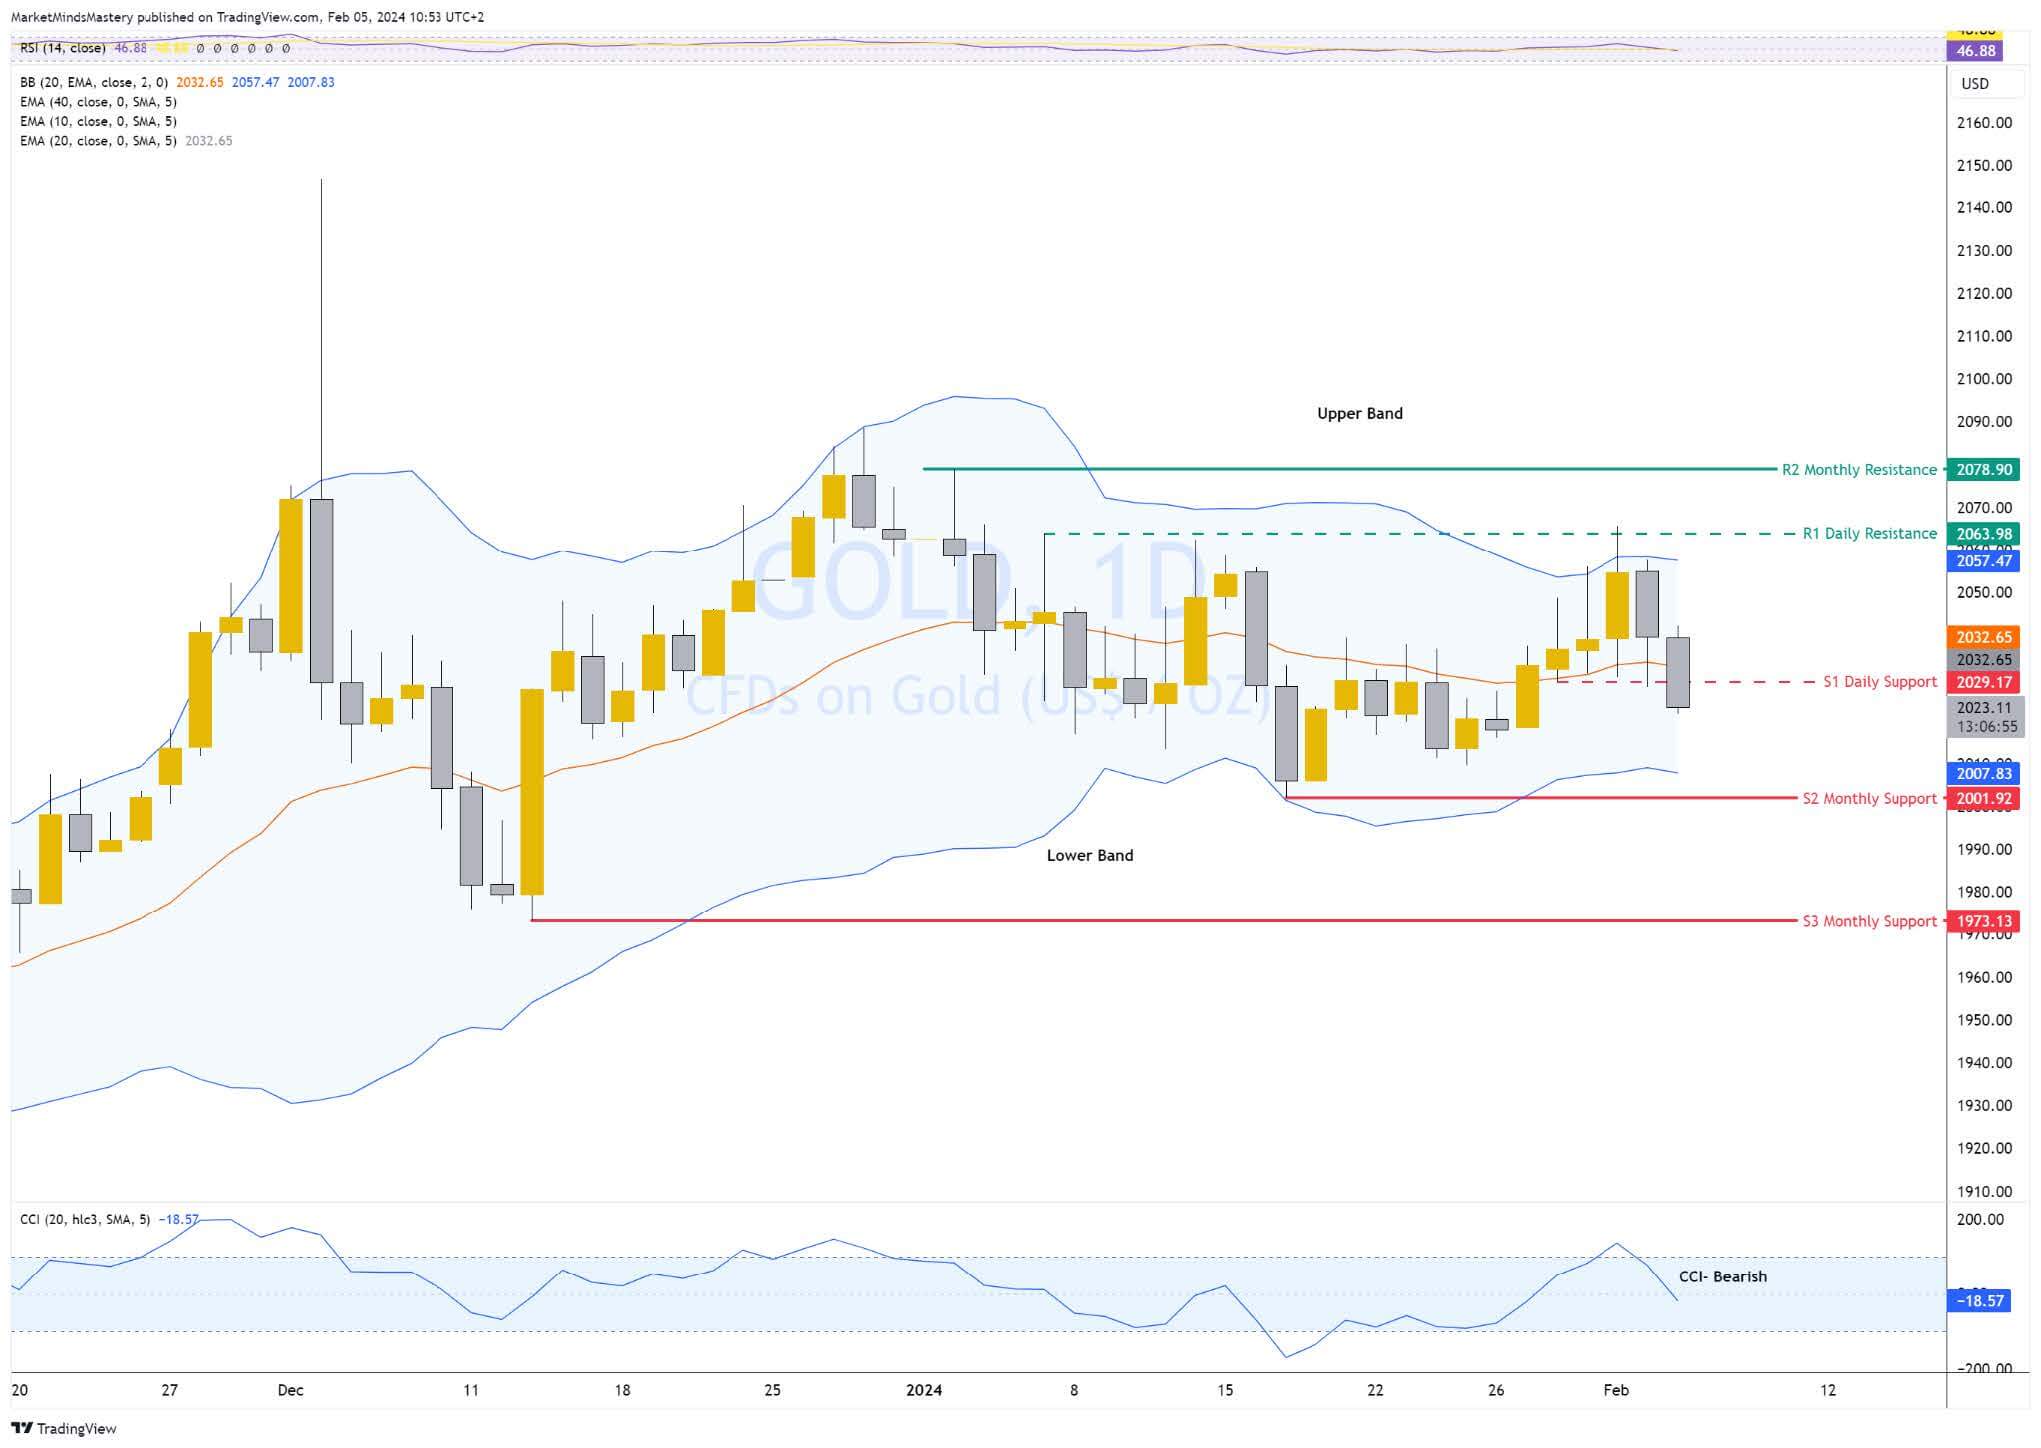
GOLD
Gold sold off from R1 resistance around 2063 last week. The market has since declined as it is currently in a consolidation/ trendless move. The Bollinger Bands are flat, indicating the market is not trending. The price is trading below the 20-period moving average, the middle line of the Bollinger Bands. If the price keeps trading below the 20-period, the first support area is expected to be the lower band, and the area will be around 2000. This is one of the most critical trading levels for Gold, and traders worldwide will pay close attention to this level. A further decline can lead the price to test the S3 support, a monthly low of approximately 1973. On the other hand, if the price moves upwards, the resistance R1 can be tested, and if the price breaks above it, the monthly high around 2078 can become the next level of resistance. The Commodity Channel Index (CCI) declined from an overbought area and currently is below 100, indicating a bearish bias.
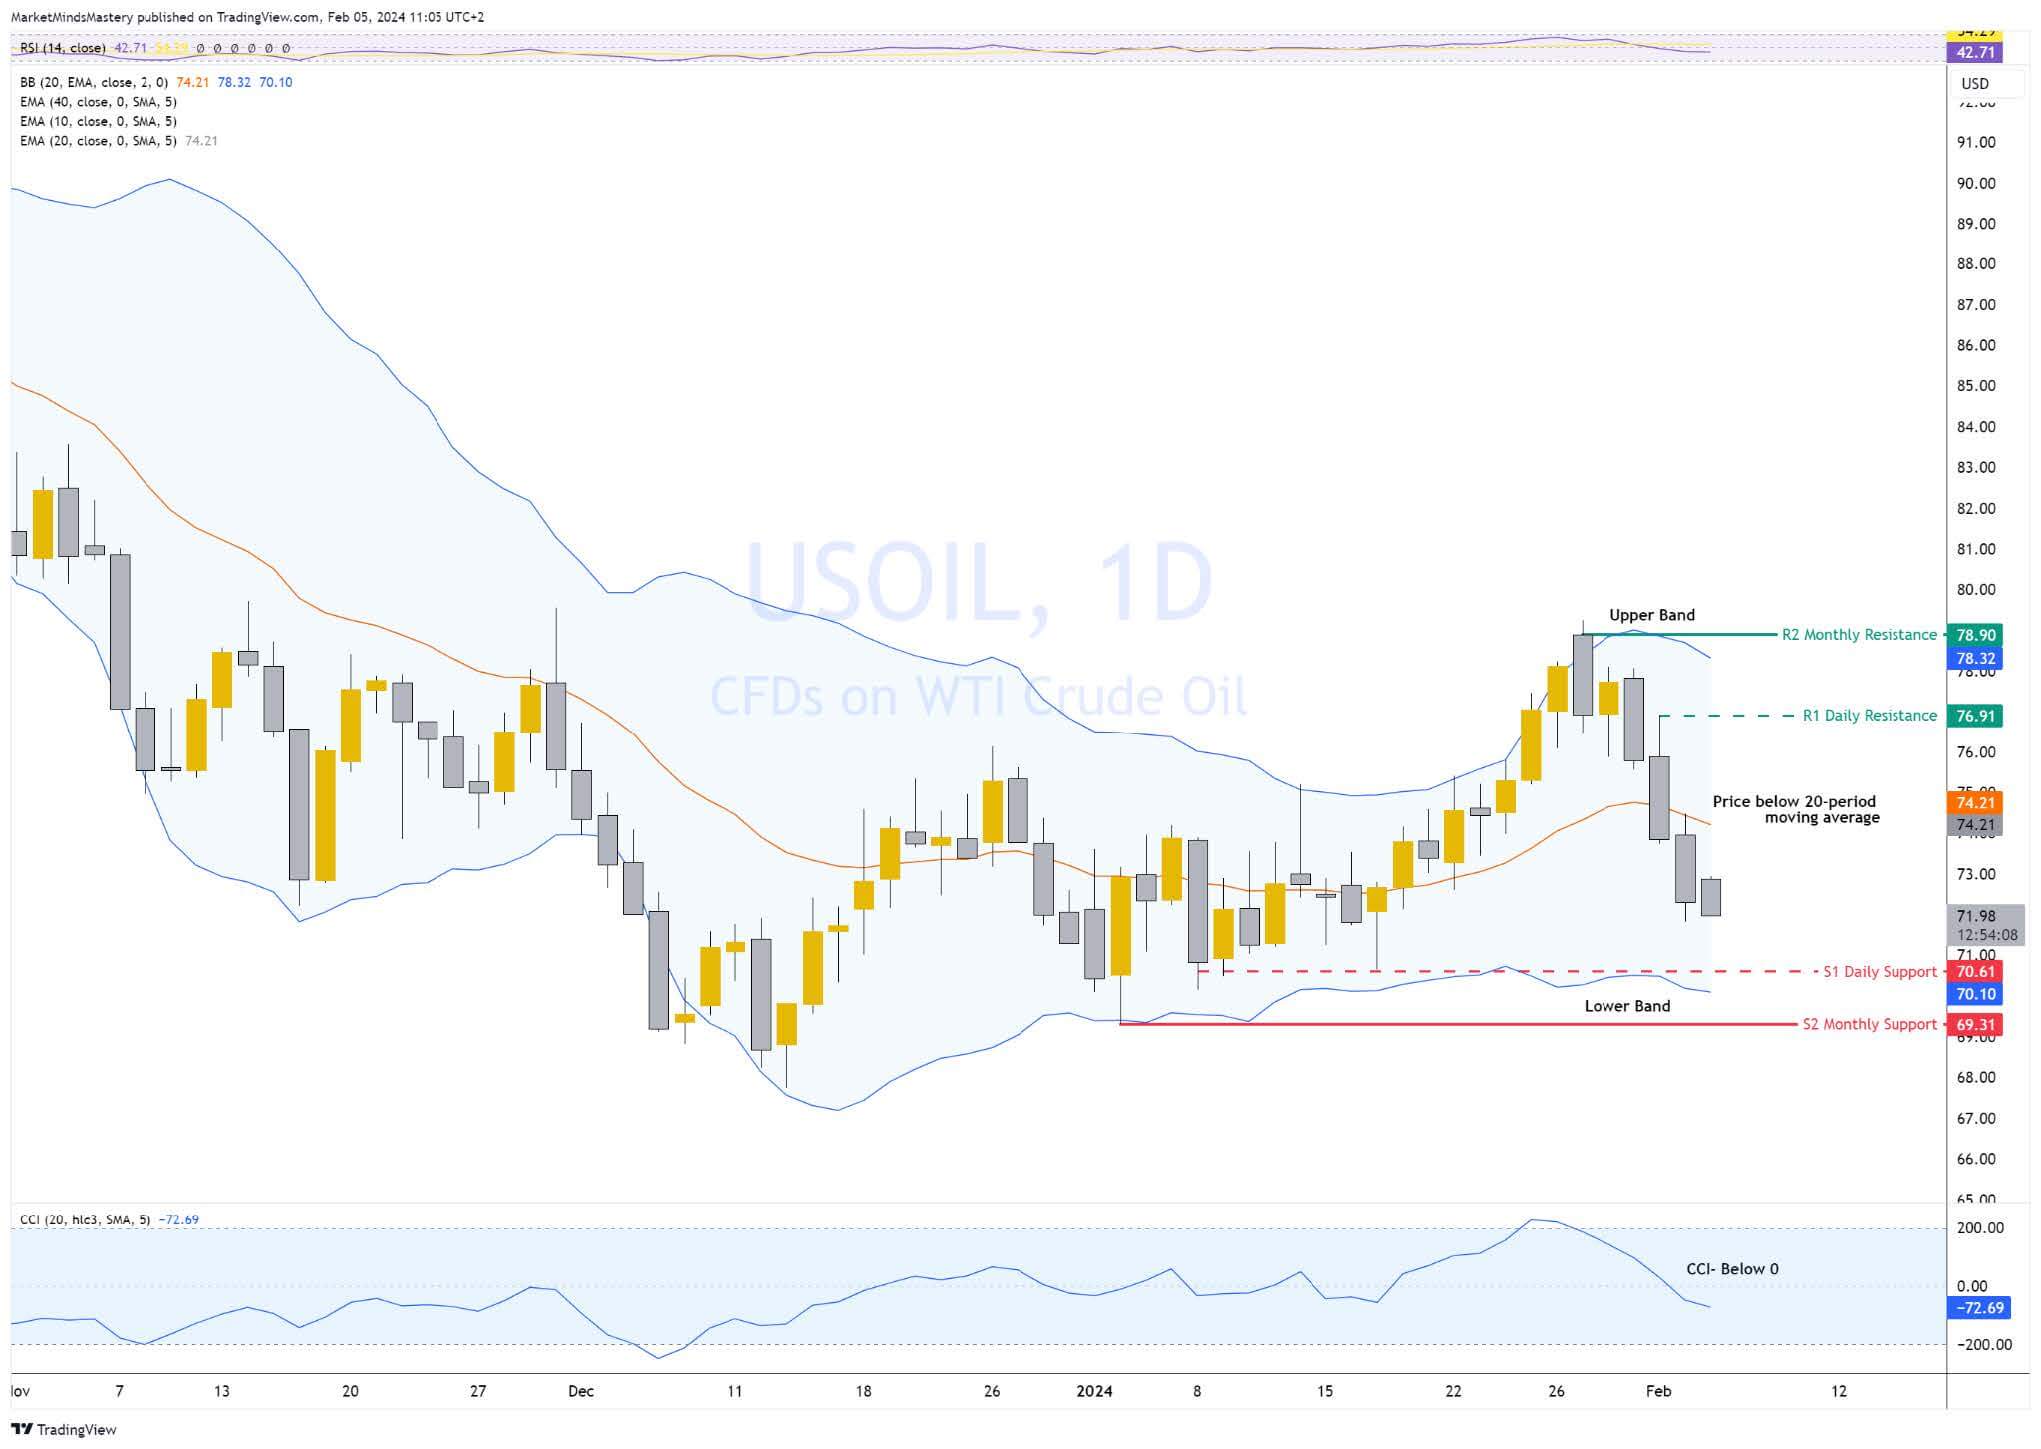
USOIL
The USOIL managed to reach 79 dollars per barrel last week. The price has since declined from the upper band of the Bollinger Band indicator. It also broke below the band's middle and is expected to test the lower band if the decline continues. The first static support, S1, is around the 70-dollar area. That is a daily support level. A further decline can lead the price to test the monthly low of around 69.3 dollars. The band's middle will act as a dynamic resistance if the price bounces from a support level and moves upwards. If the price penetrates it and rallies, the first static resistance, R1, is a daily high of around 76.9 dollars. Following the price decline, the Commodity Channel Index (CCI) is below its zero line.
Risk Disclosure:
The Trading Pit offers only demo accounts to all users within the Challenges and Signal Provider Agreements (Scaling Plan). All assets and trading activities are purely virtual. Please note that we do not offer CFD (Contract for Difference) challenges to residents of Canada and the United States. All content and information on this website is for informational purposes only and should not be interpreted as financial advice. Also, remember that results achieved in the past are no guarantee of future results. It is essential to understand the risks associated with trading. If you are unsure, always consult an independent financial advisor.