The Trading Pit Week Ahead Market Outlook (April 29 – May 05)
Last week, we witnessed a massive sell-off of the Japanese Yen as the currency depreciated in the foreign exchange markets due to the unchanged interest rates by the BoJ and the drop in the CPI number. Understanding that the CPI or Consumer Price Index is a primary inflationary indicator is good. However, a drop in the number favours the consumers but harms the currency and creates currency depreciation. The USDJPY moved approximately 2,5 times more than the usual and the GBPJPY 3,5 times. This shows the significant volatility, especially last Friday when the events were announced.
The market's only significant event on Monday will be Germany's CPI (Consumer Price Index). The event will be reported around the New York trading session, and as per the consensus, the 2.3% that was previously expected to remain the same. The Euro will experience high volatility around that event. If the outcome deviates from the forecast and it is positive, then the Euro can appreciate. Otherwise, it can depreciate.
On Tuesday, the retail sales in Australia will be reported, and the forecast estimates a drop from 0.3% to 0.2%. If the actual number confirms the forecast and the market follows through, we might see weakness in the Australian dollar. Based on the technical analysis in the AUDUSD chart below, the major trend is down. So, a negative report can extend this downward move. Next, the Unemployment Rate in Japan will be reported, and the consensus estimates a drop of 0.1%. The Unemployment Rate is 2.6%, and the forecast shows a drop to 2.5%.
Additionally, around the same time, Retail Sales in Japan will be reported, and the consensus estimates a drop from 4.7% to 2.5%. A move like this was anticipated per the Monetary Policy statement last week.
The next significant event will be the PMI manufacturing in China. Everything, per the consensus, looks favourable for the Chinese Yuan. However, we don't trade Chinese currency, which is less significant for the traders.
Right before London opens, the Retail Sales in Germany will be reported. The forecast shows a significant increase in Retail Sales from minus 1.7% to 1.1%. Of course, this will be favourable for the Euro if the outcome confirms the forecast and the currency follows through.
A few hours later, they will report the GDP (Gross Domestic Product) for the first quarter in Germany. It is -0.3%, and the forecast estimates increase to 0.1%. In the Eurozone, the CPI will be reported one hour later, and the 2.9% is expected to drop to 2.6%. This will be the most significant event for the Euro because it attracts significant volatility and highly impacts the currency’s performance. If the actual forecast is confirmed and we see a drop in the CPI numbers, the Euro might decline. The last significant event of the day will be the GDP in the Eurozone, as per the consensus. For the first quarter, the 0% is expected to rise to 0.1%. As you may understand, there are a few events regarding the Euro that they expected to negatively impact the euro's performance and some other events positively. However, the CPI is shown to be the most significant so far.
On Wednesday, May 1st, in Switzerland, Germany, Spain, France and Italy, the banks will be closed due to Labor Day. The Unemployment Rate in New Zealand will be reported early in the morning and during the Sydney trading session. Currently, It's at 4%, and the consensus estimates an increase to 4.3%. An actual number confirming the forecast can be negative for the New Zealand dollar.
As we know, the ADP Employment change is reported in the US once a month, and it is an early indication of the NFP follows the following Friday. The forecast estimates a drop from 184K to 179K. A drop like this can negatively impact the Greenback. However, the direction of the USD will be determined after the NFP.
The day will focus on the Fed's announcement of interest rates towards the end of the New York trading session. The 5.5% is expected to remain the same. Usually, the currency can be depreciated and dumped in the FX market when a country reports unchanged Interest Rates.
The FOMC minutes will end the day’s main news events.
On Thursday, the CPI in Switzerland is expected to increase from 0% to 0.1%. It is a monthly forecast based on the previous month. The currencies usually react to the yearly CPI number, which is currently 1%, and no forecast is available when we contact this report.
The day will end with the last two important events in the US. First will be the unemployment claim. The consensus estimates an increase from 207K to 212K. When more people claim unemployment in the US, it usually has a negative impact on the Dollar. The last significant event for the day will be the US factory orders, which are expected to increase by 0.2%. This means that the production used within the country's spending and exports can improve, and the USD can appreciated.
Despite all the significant events this week, the directional move on the US Dollar will occur after the NFP is announced on Friday. The majors usually drift sideways during the week prior to the NFP report. Even if a noticeable change occurs Wednesday during the FOMC, the market will still anticipate the NFP outcome. The previous report was 303K, and this time is expected to drop to 243K. A noticeable decrease in the number means that fewer new payrolls (excluding farm jobs) will be added to the US economy.
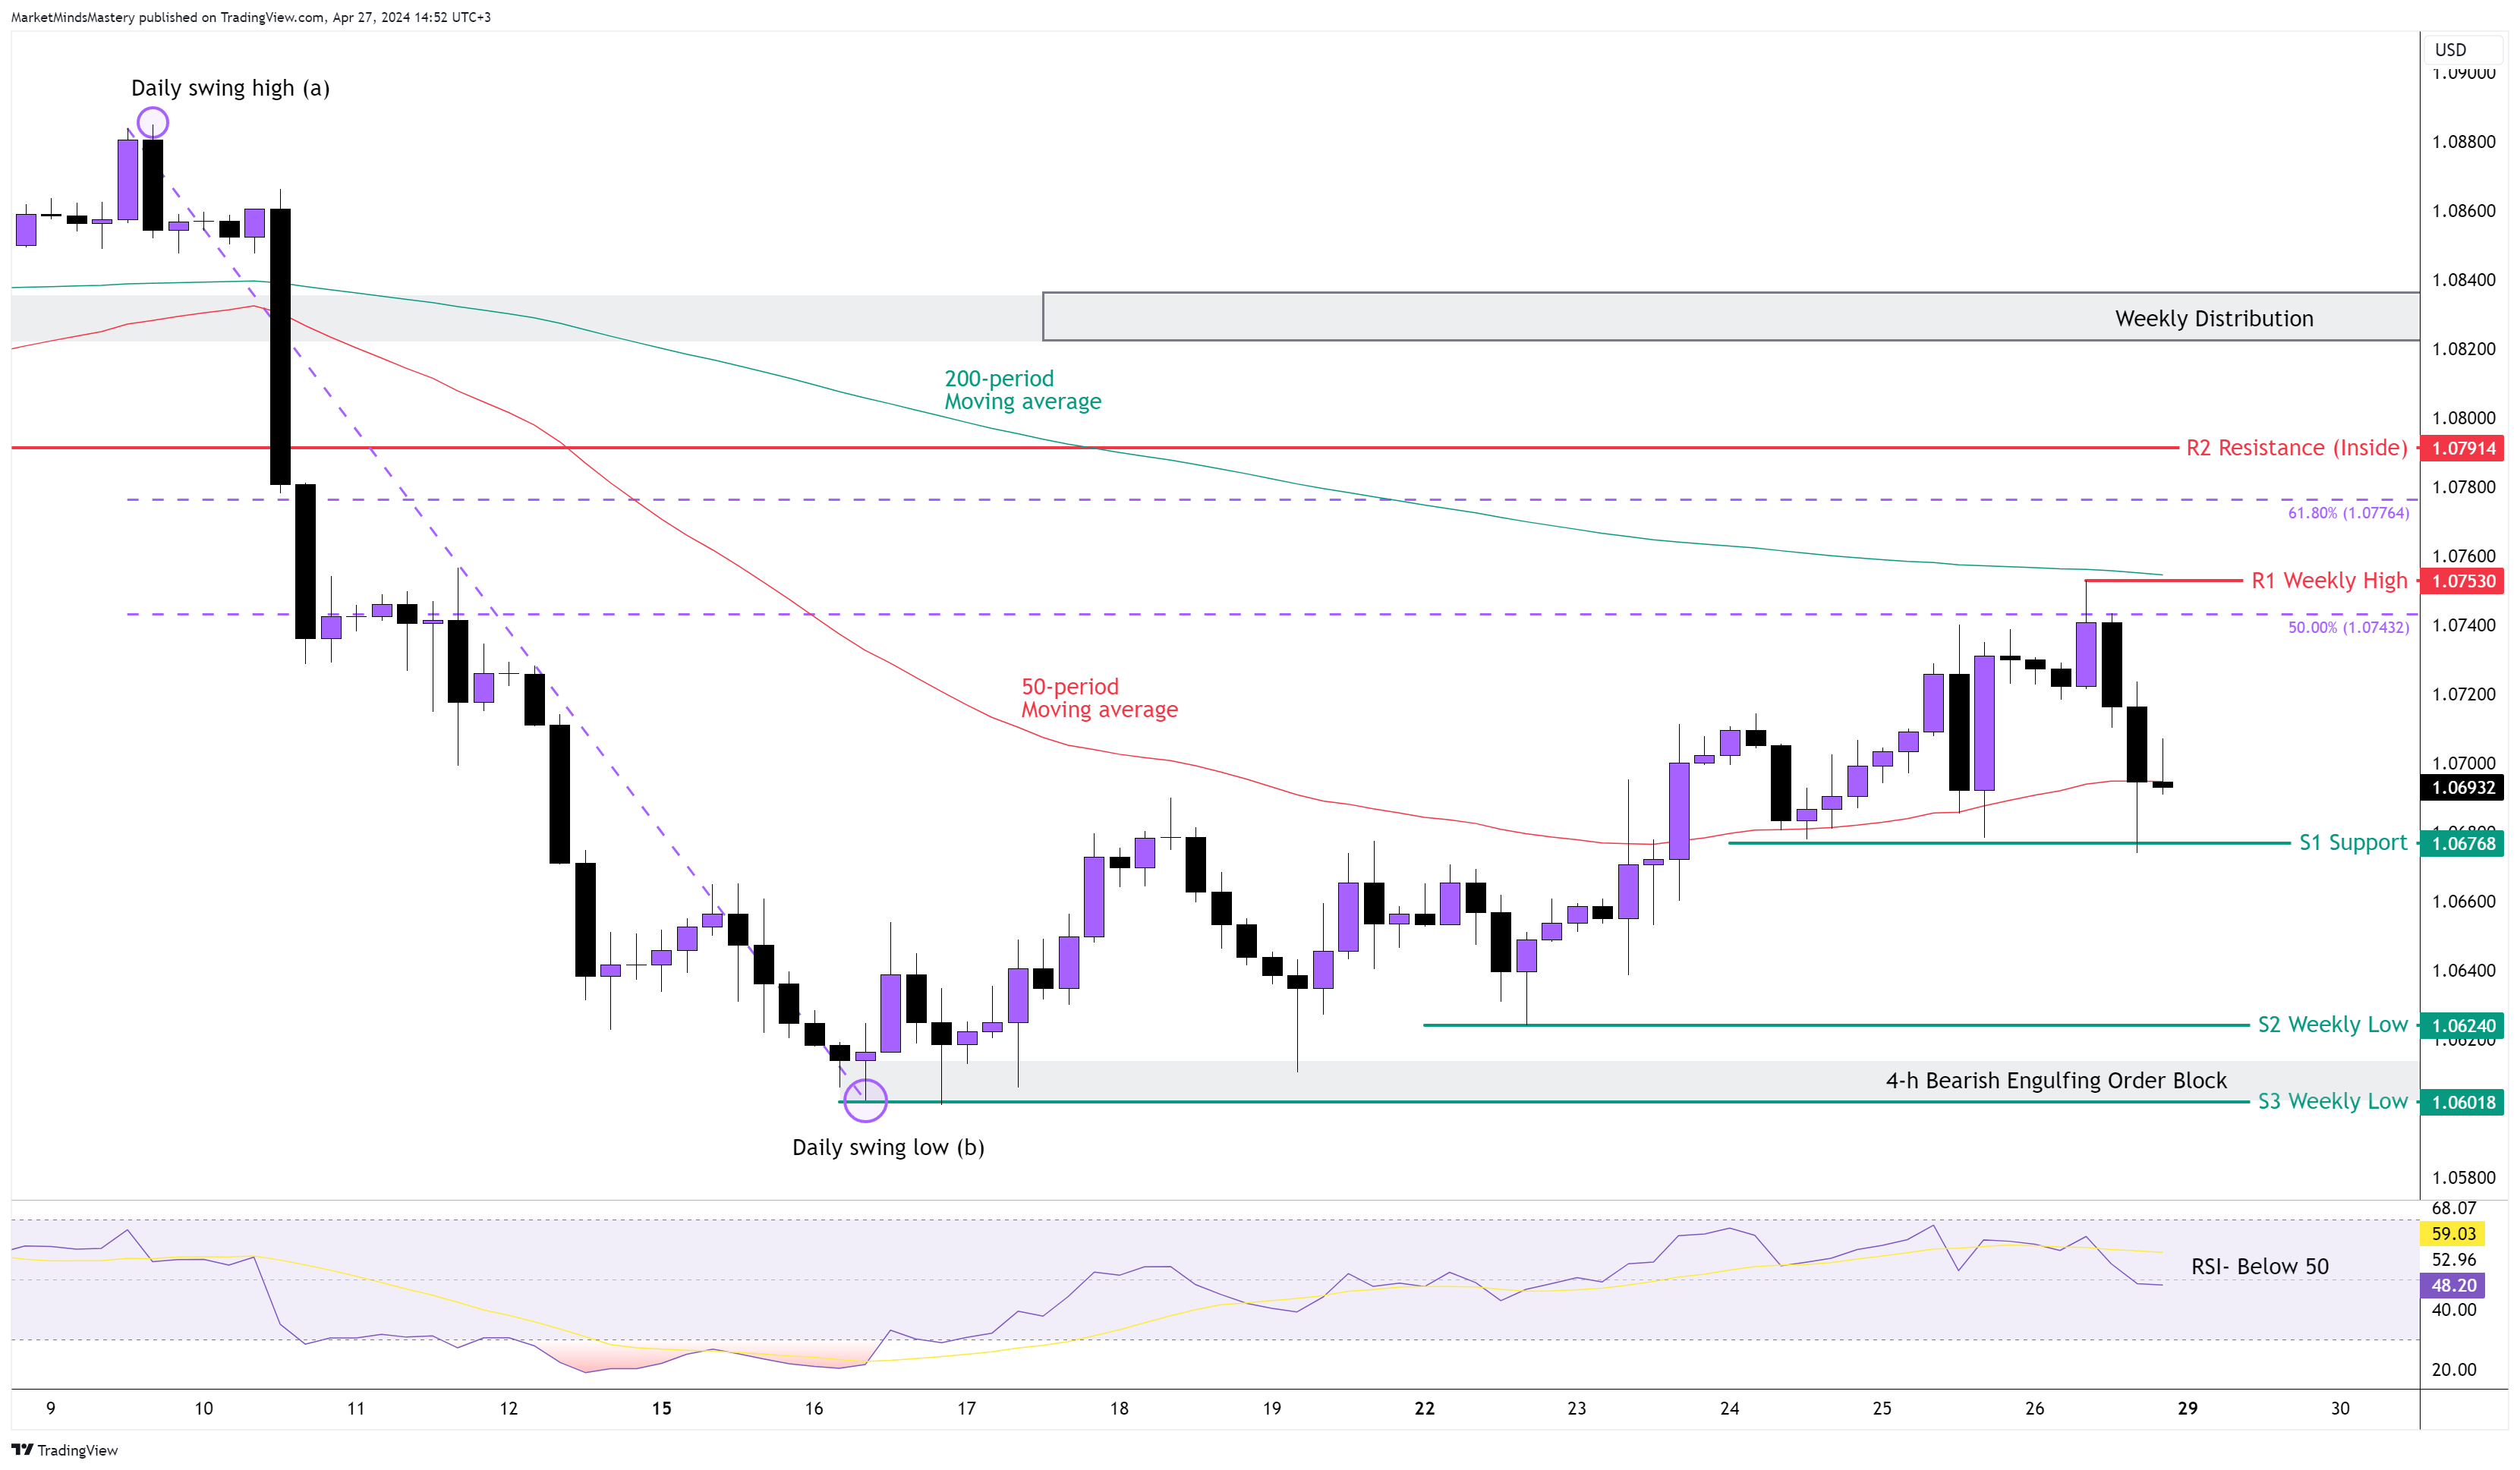
EUR USD 4H

Following the Daily downtrend, the price reacted after touching the 50% Fibonacci level and declined during the New York Trading Session last Friday. On the 4-hour chart, the Bearish candles (black) are long, which means increased selling orders have been placed around that price level. The primary and intermediate trends are both down. The RSI is below 50, and the 50-period moving average is below the 200-period. All these have bearish implications.
Therefore, if the price moves downwards on the 4-hour chart, the first support area, S1, is around 1.06768. If the price breaks below the S1, it will automatically register a new lower low that will turn the currency from an uptrend into a downtrend, and the major downtrend will likely resume. If the price declines, the next support area, S2, is approximately 1.0624, the previous week's low. A further move to the downside will find the following support, S3, around the 1.06018 level. On the other hand, if buy orders boost the price, the first resistance, R1, will be approximately 1.0753, which is the previous week’s high. A higher move than the R1 finds the following resistance R2, around 1.07914 level, at a close distance with the 61.8% retracement of the Daily’s chart.
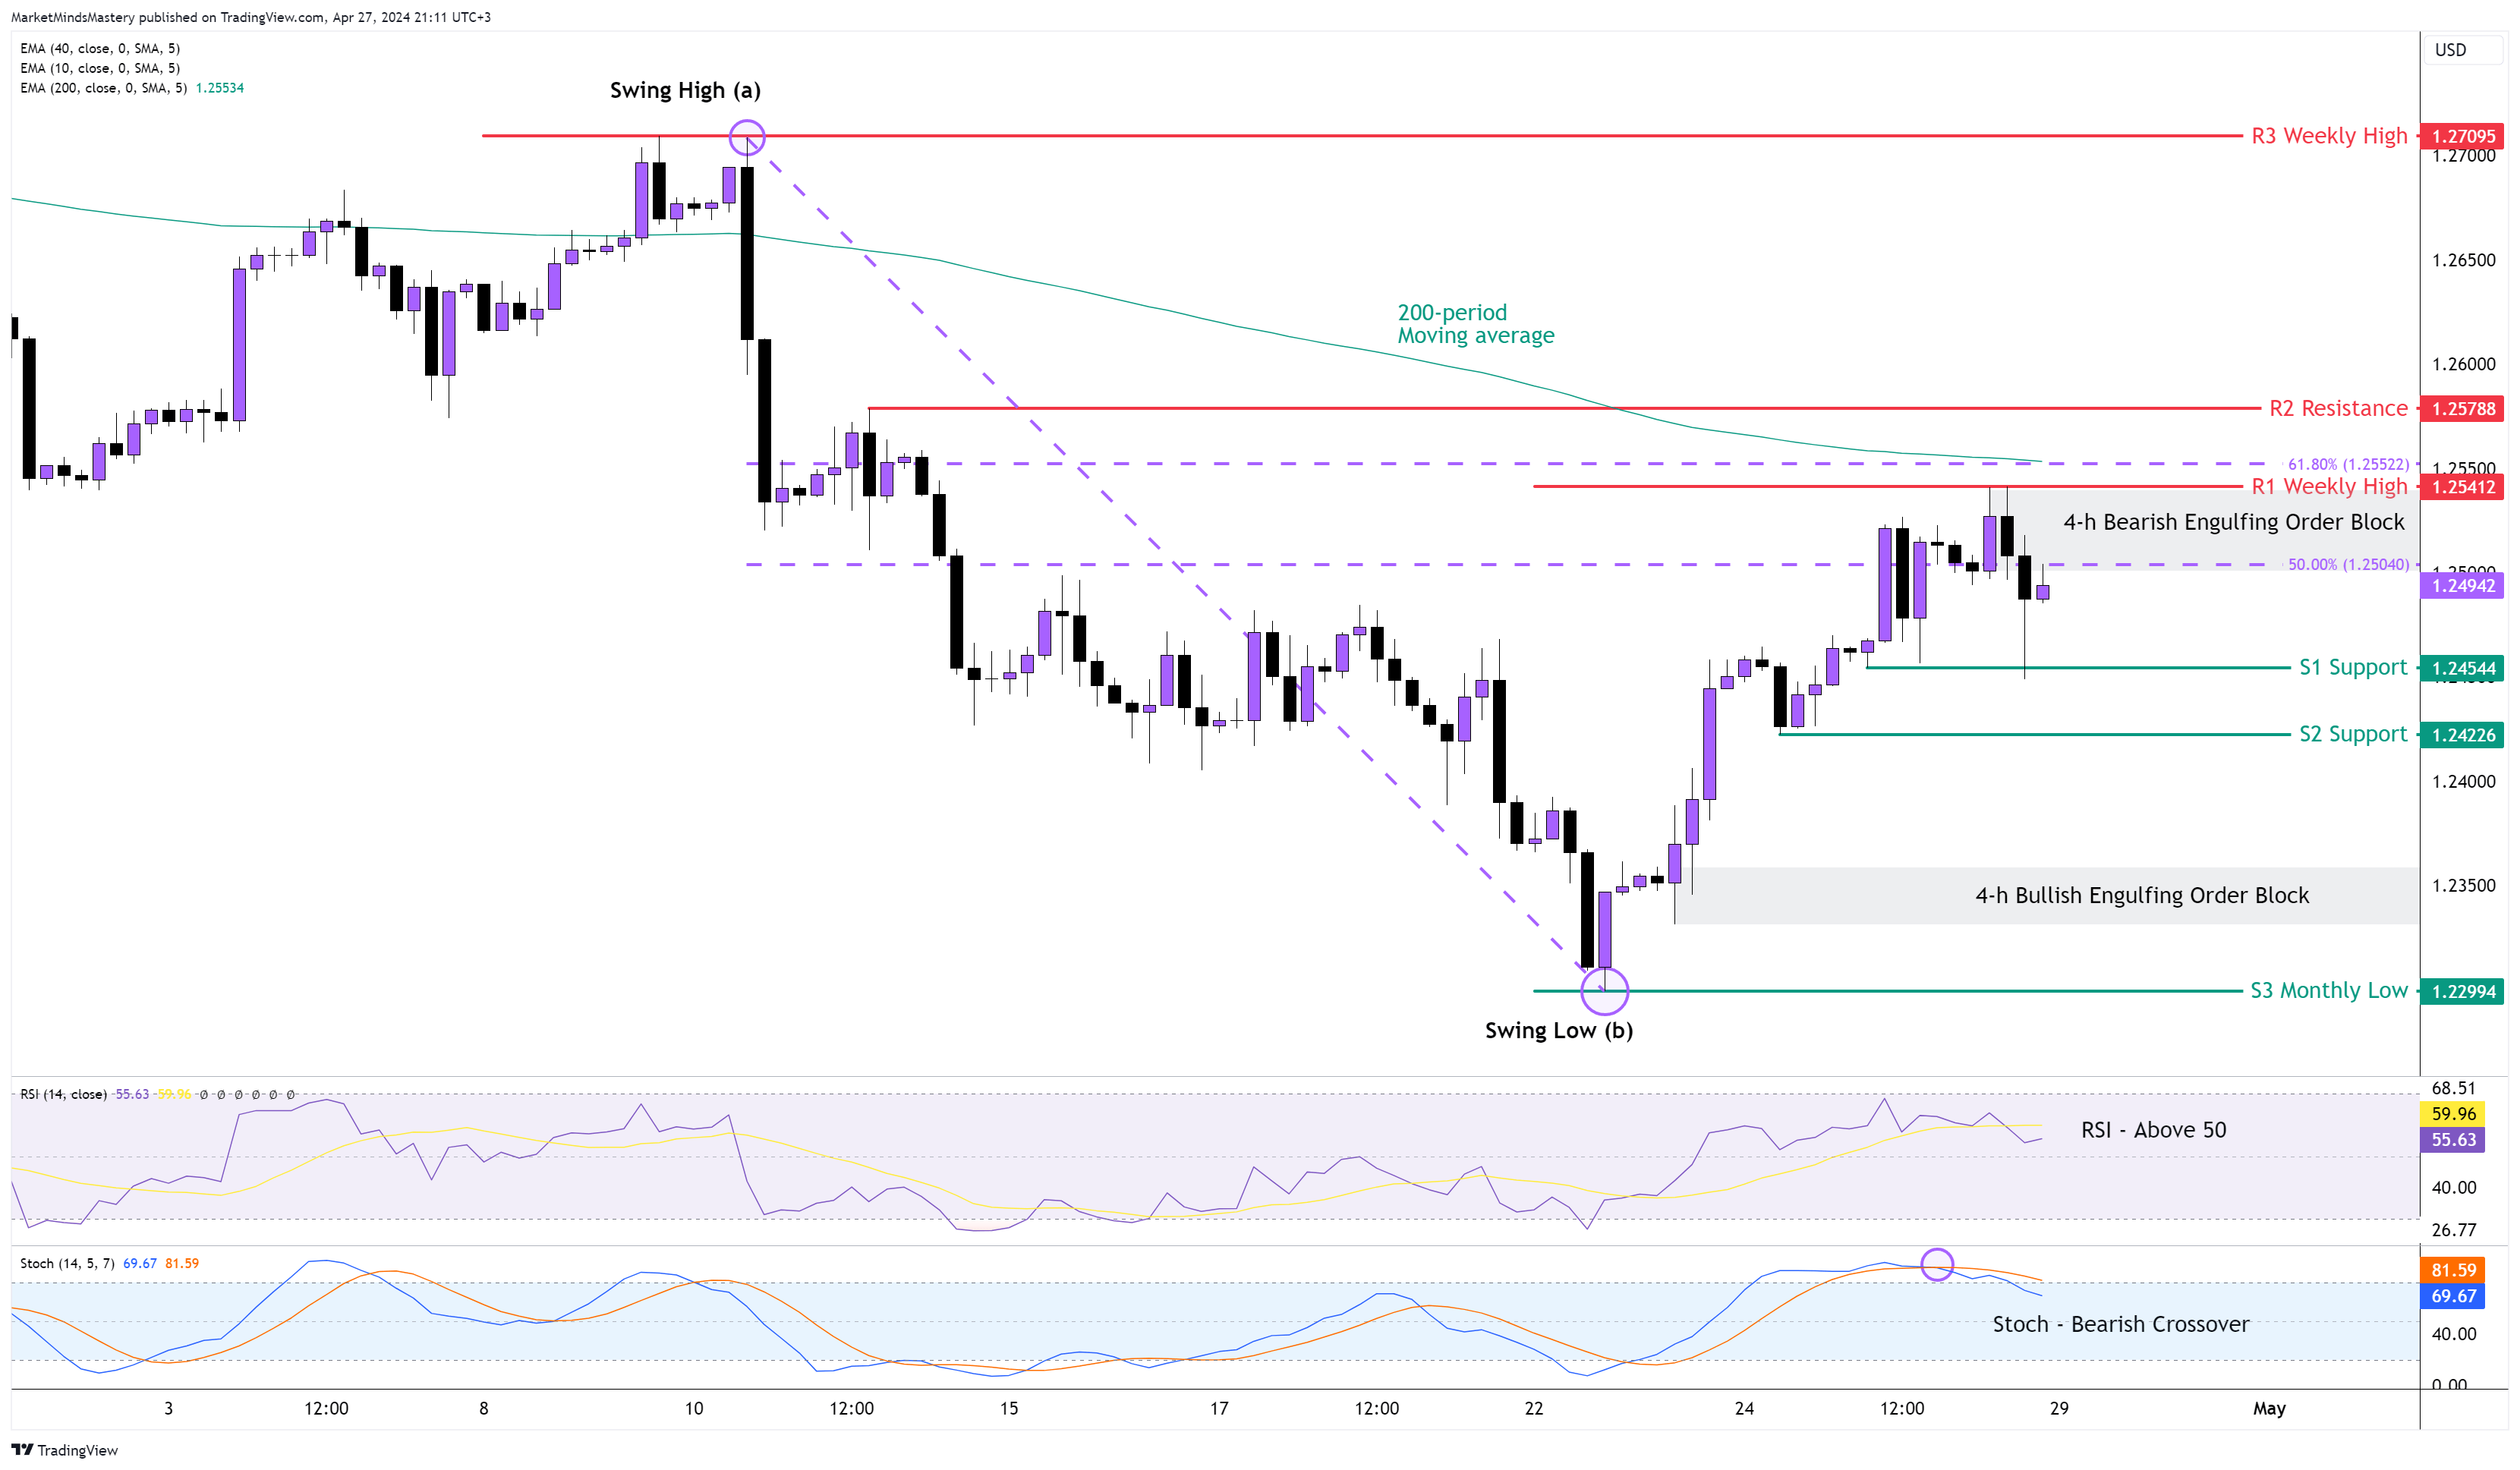
GBP USD 4H
The weekly price action ended up being a Bullish Engulfing Reversal candle. The 4-hour chart showed an uptrend, with higher highs and higher lows. The last move, attempting to create a new high, was accompanied by a false break out just below the 61.8% Fibonacci retracement, and the price declined, creating a 4-hour Bearish Engulfing Order Block. Although the price created support at S1, that wasn’t enough to turn the uptrend into a downtrend. Regarding the RSI, it is above 50, and this has bullish implications. The Stochastic oscillator crossed over at the overbought area, and the price is below the 200-period moving average, which has bearish implications.
If the price declines and moves lower, the S1 support around 1.24544 becomes the first support area. If the price declines further and reaches the S2 support around 1.24226, the market will go into a downtrend following the Daily major trend. A close below the S2 will signal the downward momentum in the market.
On the other hand, if the price keeps increasing, the previous week’s high will become the R1 resistance around 1.25412. If the price breaks above the R1, the next resistance, R2, will be the confluence area between the 200-period moving average, the 61.8% Fibonacci retracement and the static resistance around 1.25788.
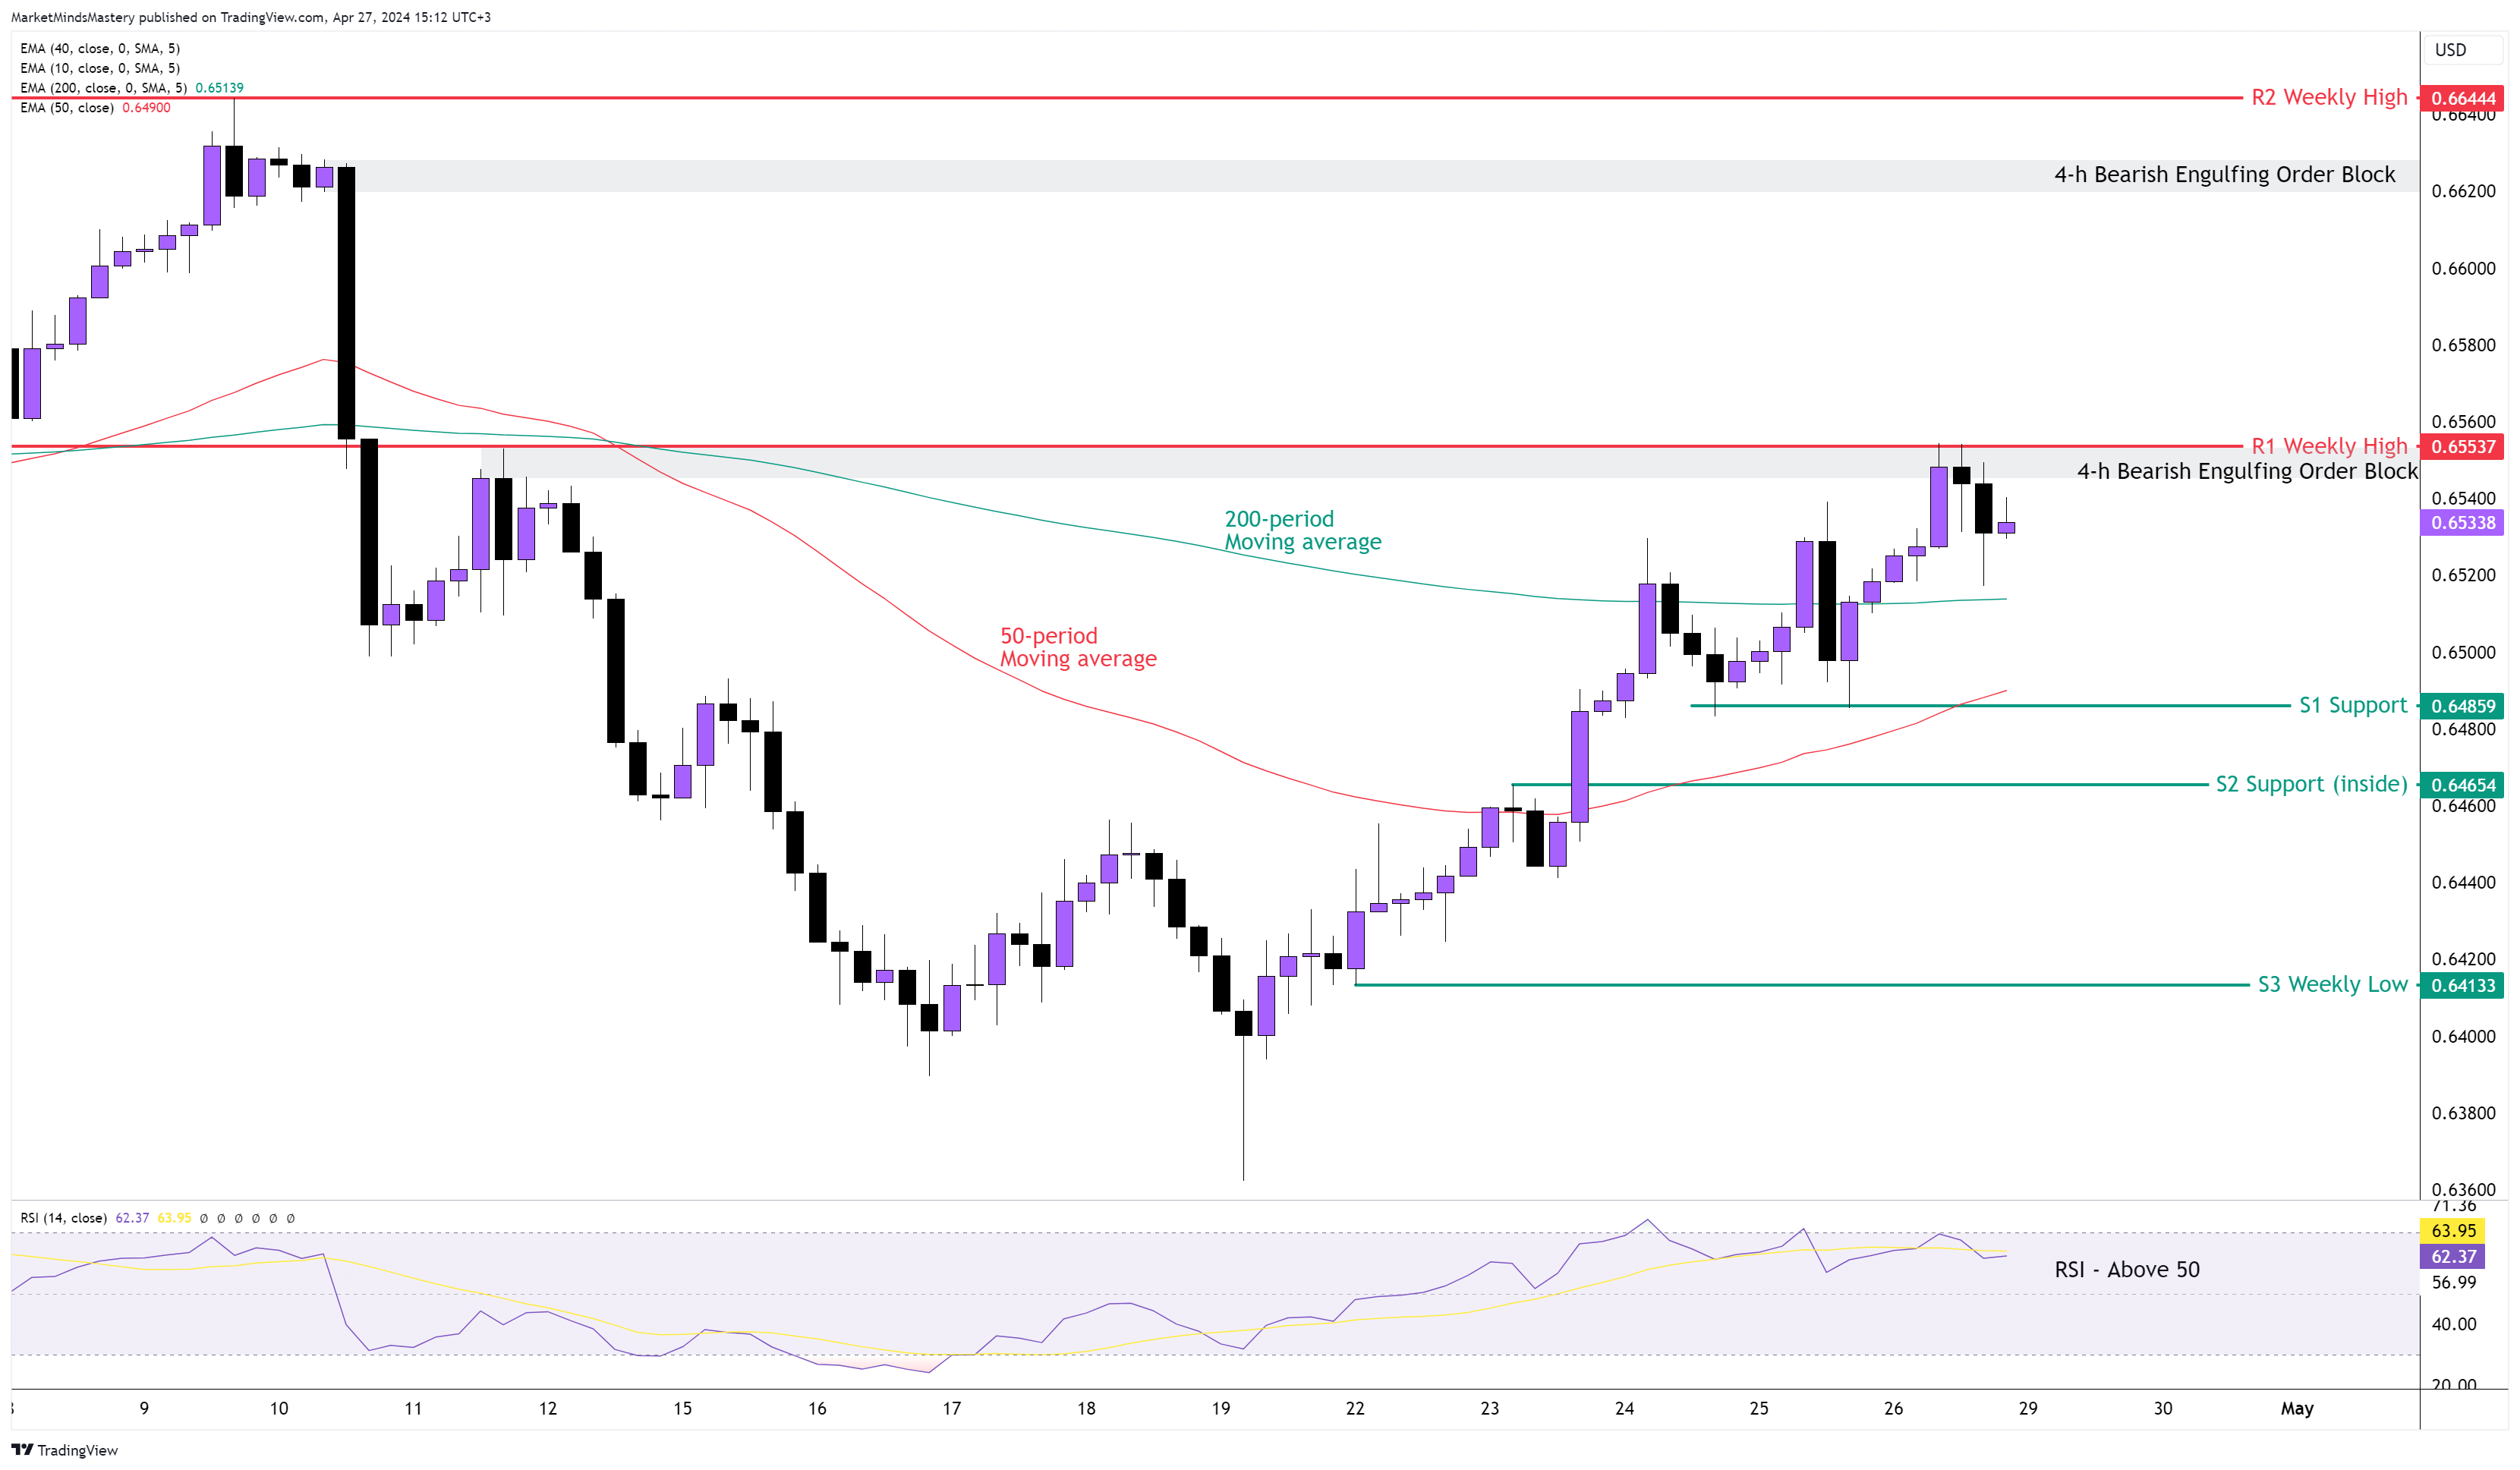
AUD USD Daily
Why the Aussie was one of the strongest currencies last week is not a mystery. The positive CPI number boosted the expectation by 0.2%, which was more than enough. We can not ignore the dominance of the Greenback as the price reached a certain level, and the AUDUSD declined last Friday. Looking at the recent bullish swing, the bullish candles weaken on every impulsive upward move. They are becoming less and getting smaller. This explanation itself has bearish implications in this market. The 50-period moving average is below the 200-period, a sign of bearishness in the market. The RSI shows an opposite signal as it holds above 50.
This week, if the price moves downwards in a higher time frame downtrend continuation, the first support area, S1, is found to be around 0.64859. This aligns at the same level with the 50-period moving average. If the price penetrates the S1 and moves lower, it will create a lower low on the 4-hour chart and likely resume the daily downtrend. The following support area, S2, is an inside support area of around 0.64654.
On the contrary, if the price continues making higher highs and higher lows, the first resistance, R1, will be the previous week’s high, with the 4-hour Bearish Engulfing Order Block around 0.65537. If the price penetrates the R1 and moves higher, the next resistance area is approximately 80 above 0.66444.
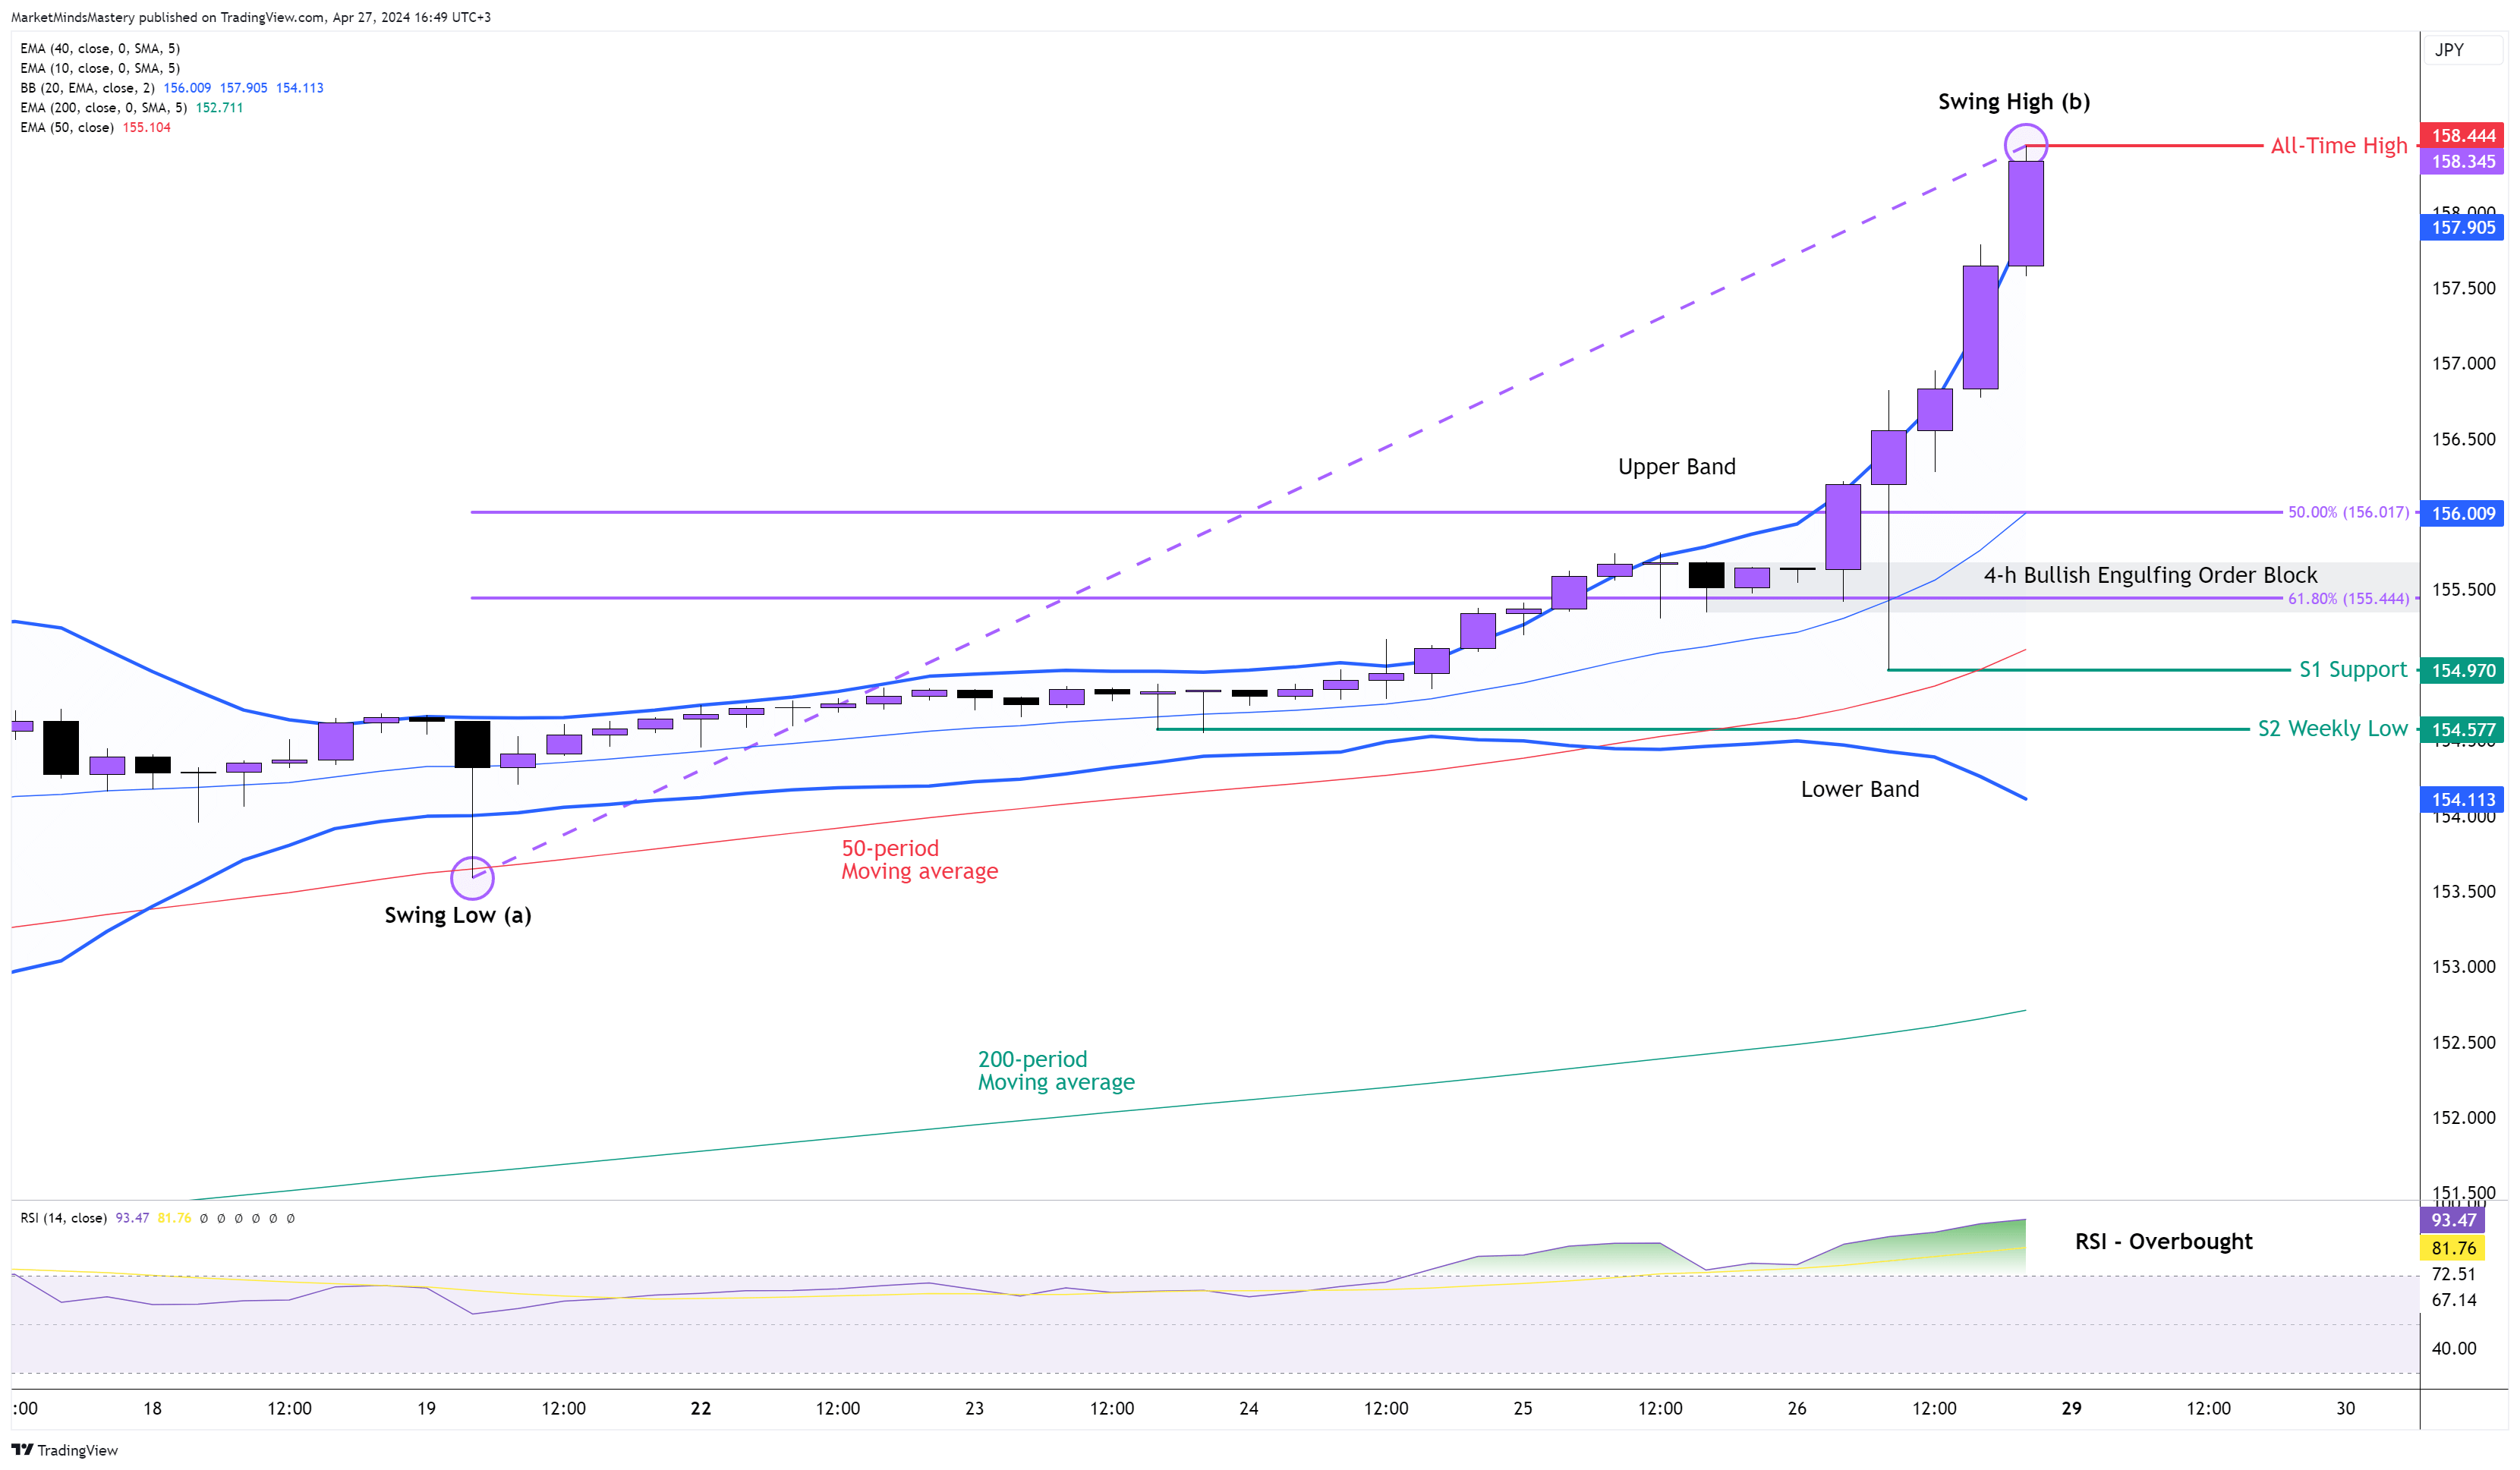
USD JPY 4H
Last week, we witnessed the implementation of currency correlation. The USD was one of the strongest currencies, and we were expecting more robust moves by the Greenback. We mentioned it a lot in the previous week’s analysis. We also stated clearly that if the JPY fundamentally weakens and the USD keeps dominating, a breakout to the upside will be possible. Last week, the price did as we expected, and the market exploded to the upside. The price now registered a new ATH (All-time high) around 158.44. The price is “walking the upper band, " which is considered bullish. The 50-period is above the 200-period moving average, and their distance widens.
The RSI is in an overbought condition, which has bullish implications. Starting Monday, a new ATH will register if the price keeps rallying. All Fibonacci extension levels have been tested. Therefore, we are waiting for a market retracement. Only if the price declines from its current area will the Fibonacci retracement levels of 50% and 61.8% be relevant. If the price enters a corrective phase, the S1 support level is around 155. The following support, S2, is the area around 154.57.
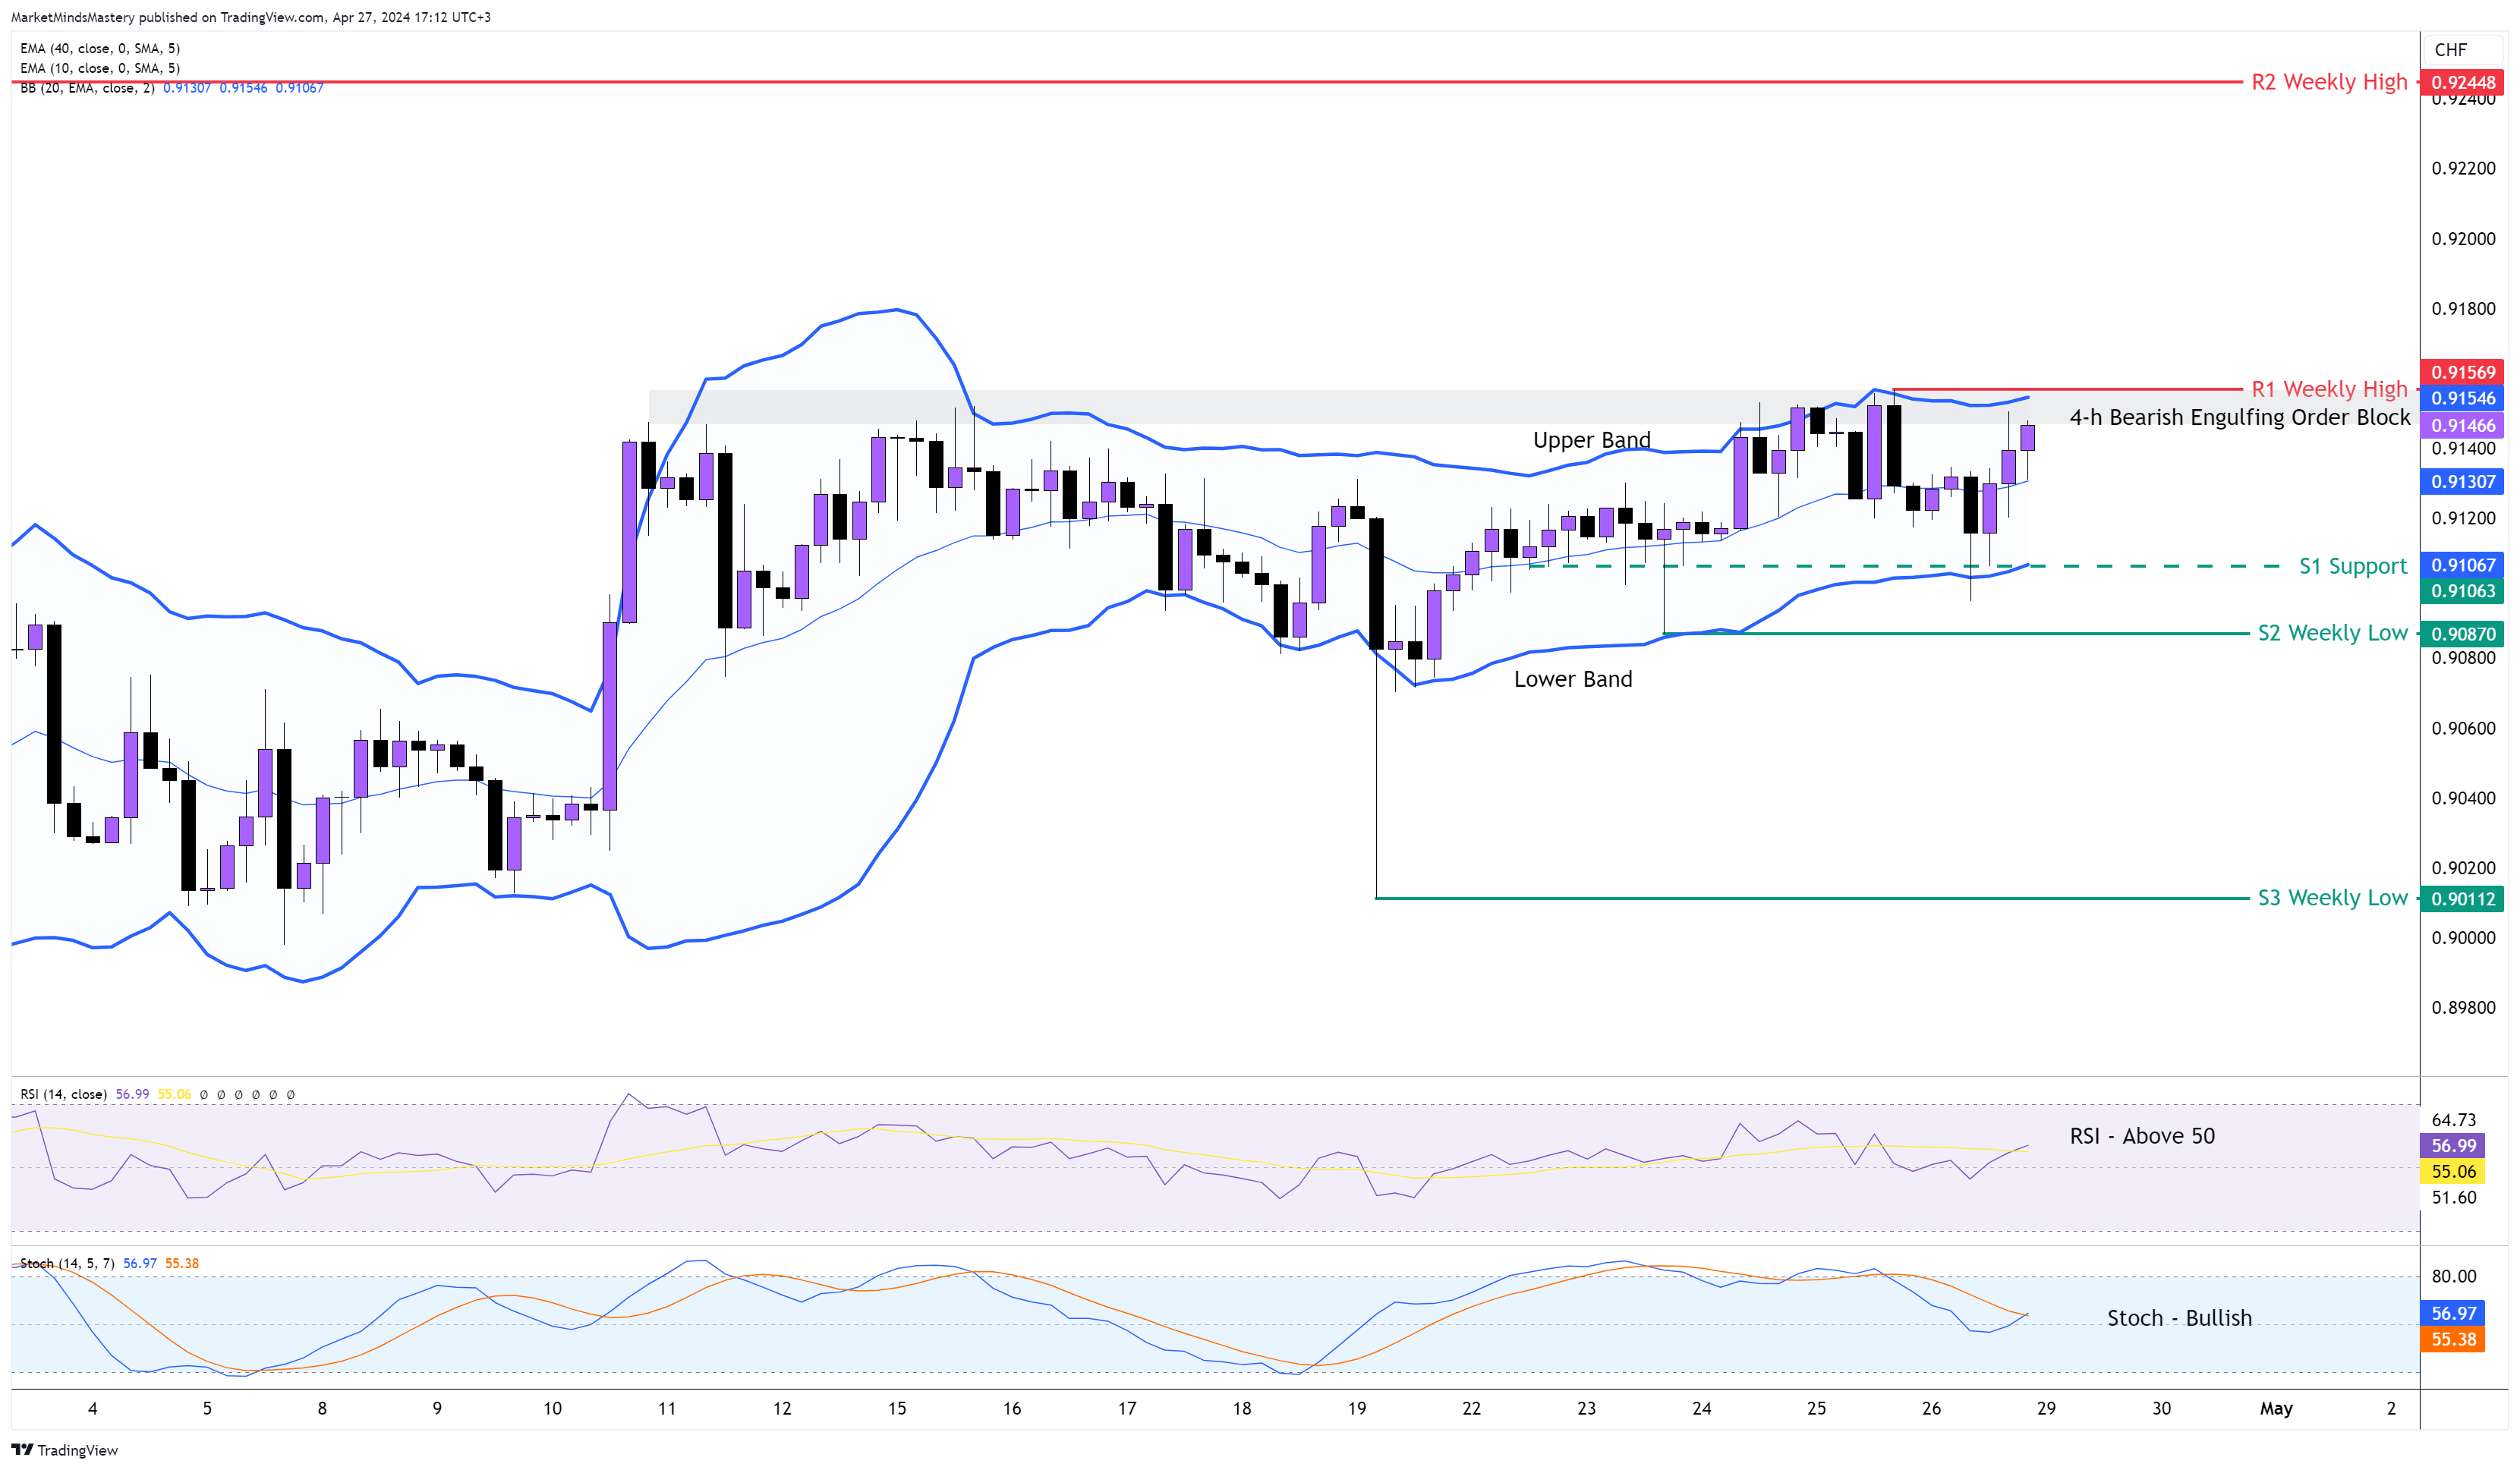
USD CHF 4H
A few weeks ago, the price on the weekly chart was a hanging man, a high-probability reversal price action, when found in an uptrend based on the candlestick patterns. Therefore, the market was expected to decline last week, but this didn’t happen. The price on the weekly chart ended as a bullish inside candle, confirming the strength of the US Dollar.
On the 4-hour chart, the price was traded in a range. Therefore, using the Bollinger Bands helps to trade under these market conditions. The price has stayed below the Upper Band since the beginning of April. In some attempts to break to the downside, the Lower Band acted as a magnet pulling back the price inside the bands. The RSI and the Stochastic are above 50, indicating a bullish sentiment.
Currently, the price trades around the Upper Band, where a Bearish Engulfing Order Block is formed. If the price breaks above the previous week's high, marking the R1 resistance around 0.91569 and moving higher, the next resistance, R2, is around 80 pips away, close to 0.92448. On the other hand, if the price declines and moves lower, the first support, S1, is the area around 0.91067. If the price close under the S1 and moves downwards, the following support, S2, will be the previous week’s low around 0.90870.
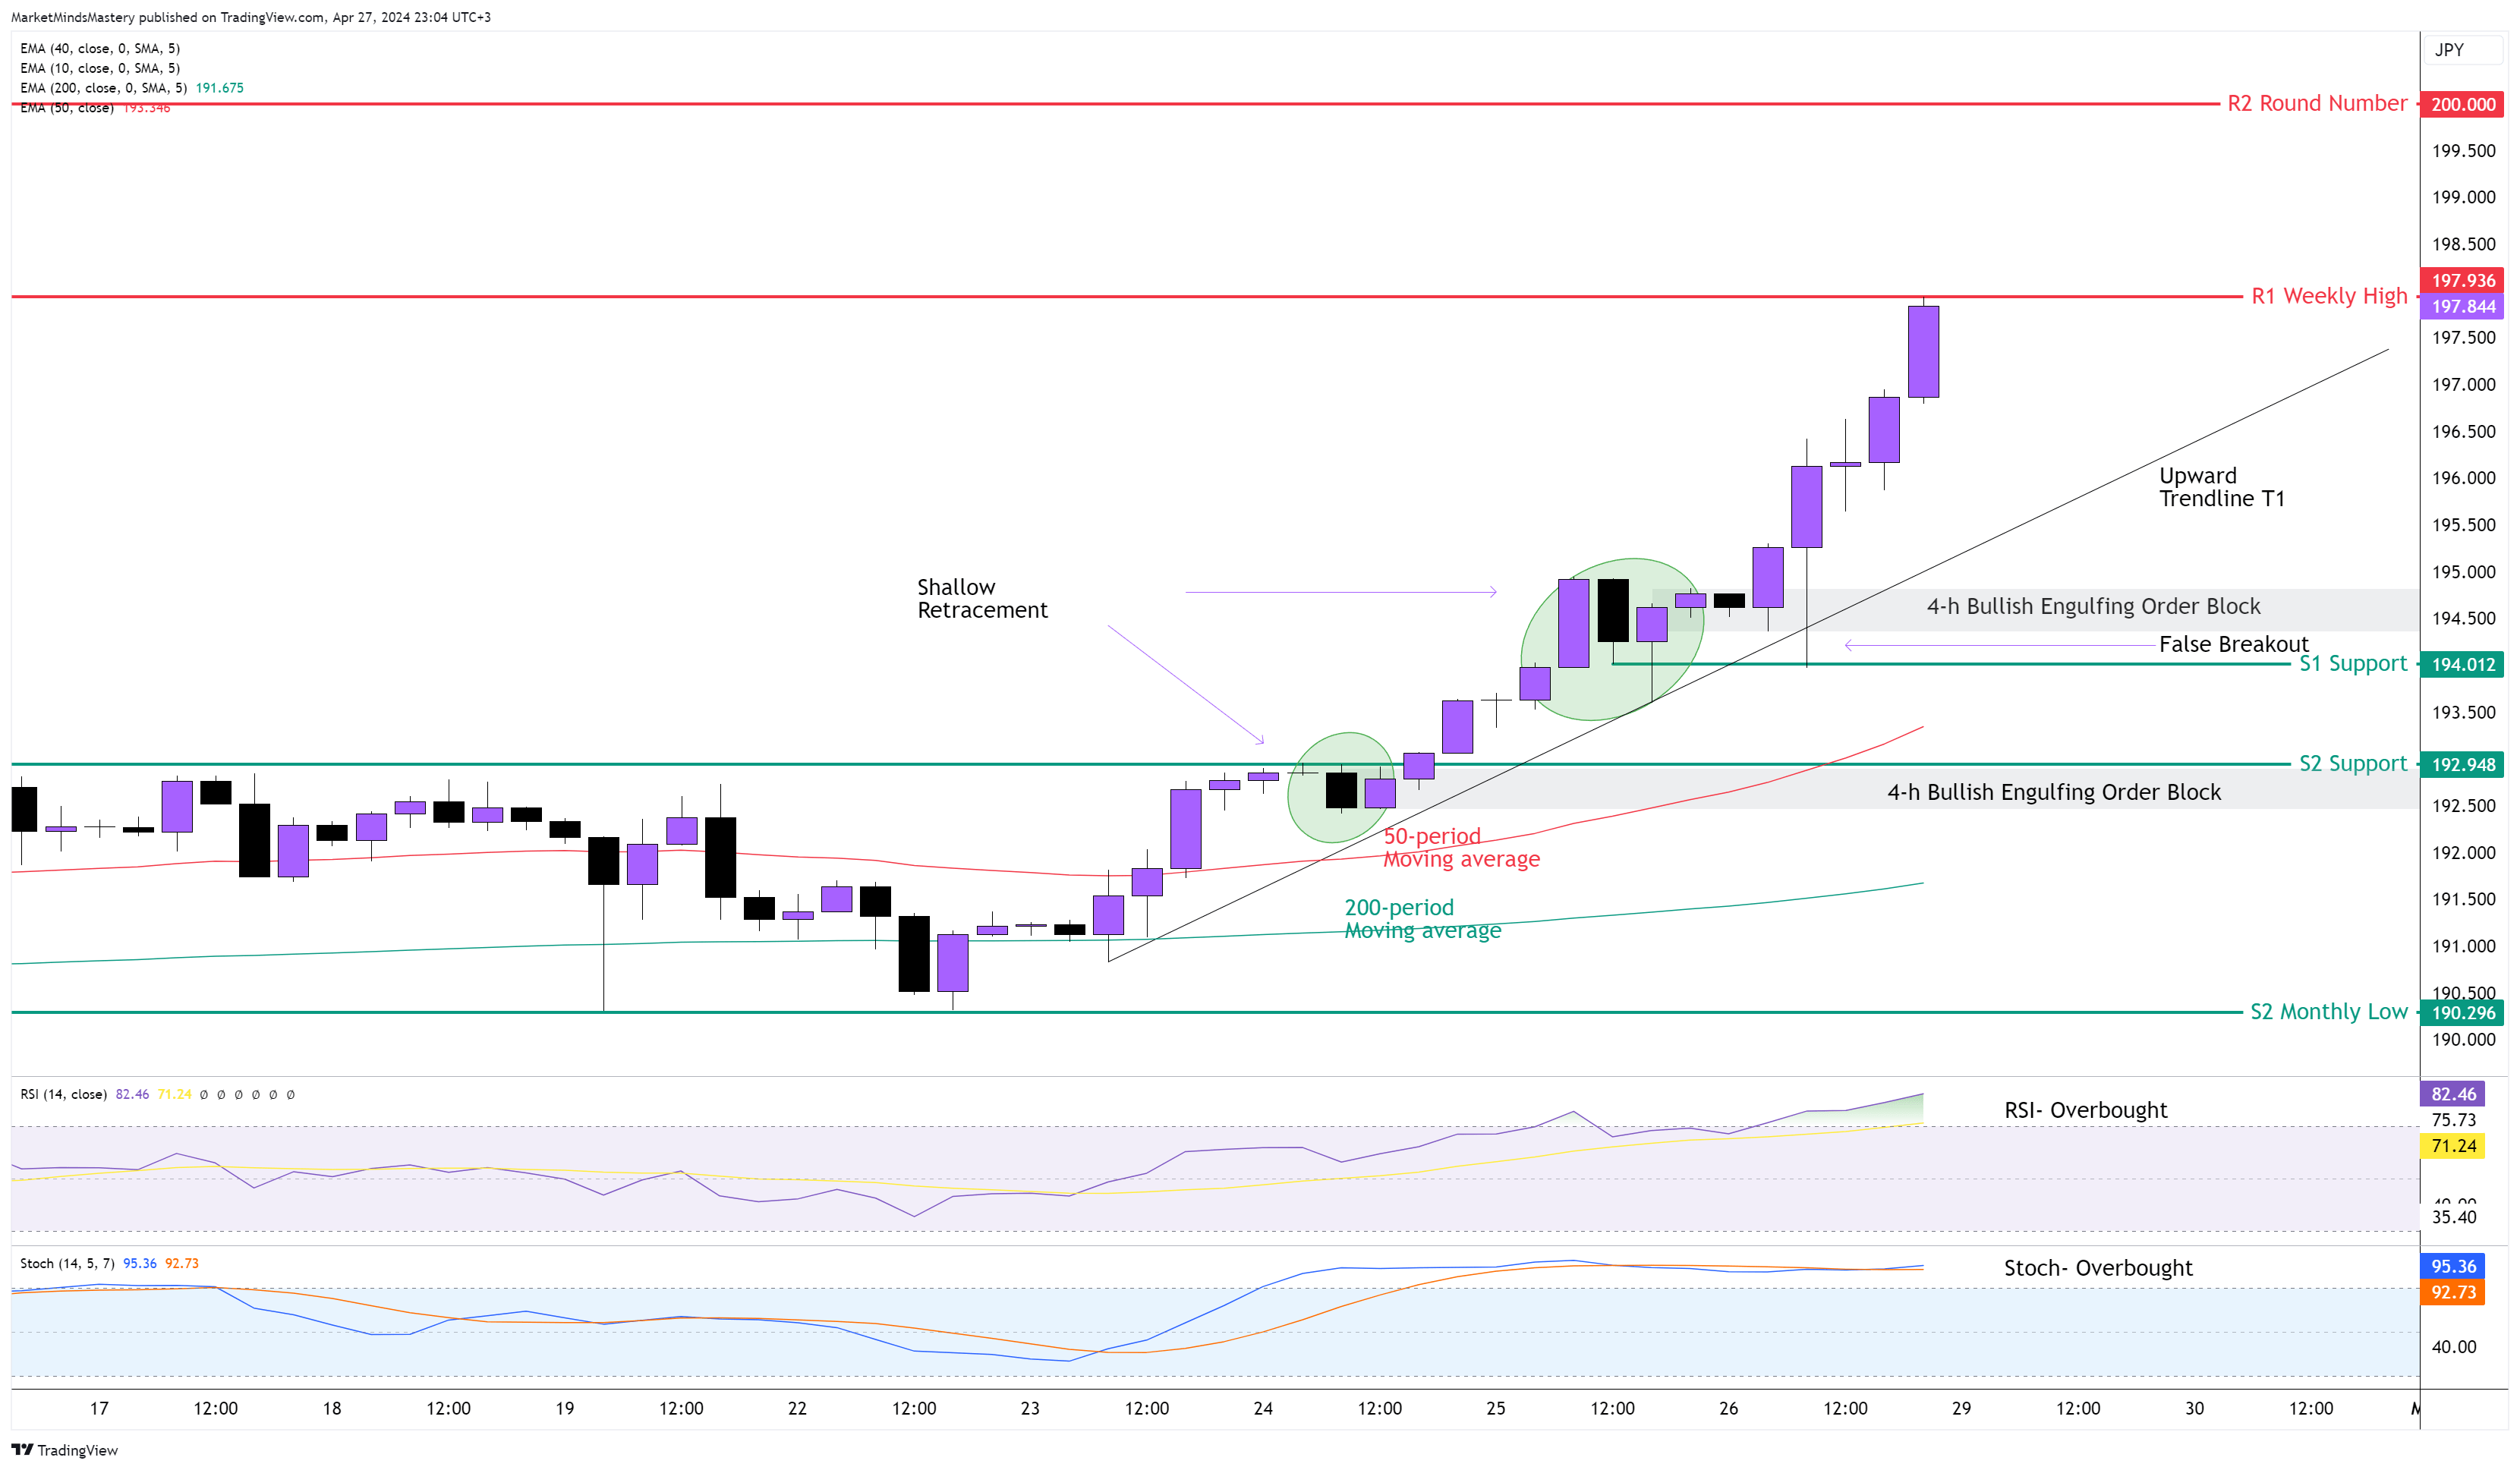
GBP JPY 4H
As in all Yen pairs, in the GBPJPY, the price skyrocketed on Friday after the CPI dropped and the Interest rates remained the same in Japan. The price moved upwards to around 700pips based on the weekly chart. That is 3,5 times more than the average weekly price range. We marked the previous Friday’s high as the relevant weekly high and the previous Monday’s low as the weekly low. The price makes higher highs and higher lows. Therefore, we can use the T1 upward trendline. Additionally, the RSI and the Stochastic are overbought, indicating a bullish market.
The 50 is above the 200-period moving average, which is also bullish. As the price hasn’t formed a reversal price action, we can't define the swing high as the turning point. Hence, if the price keeps increasing, the previous week’s high will become the R1 resistance, around 197.936. If the price breaks above it, the next resistance, R2, will be approximately the area of 200. Once the price starts correcting, the first support, S1, is found around 194 with a Bullish Engulfing Order Block. If the price moves downwards and closes below the S1, it will find the next support area, S2, around 193.
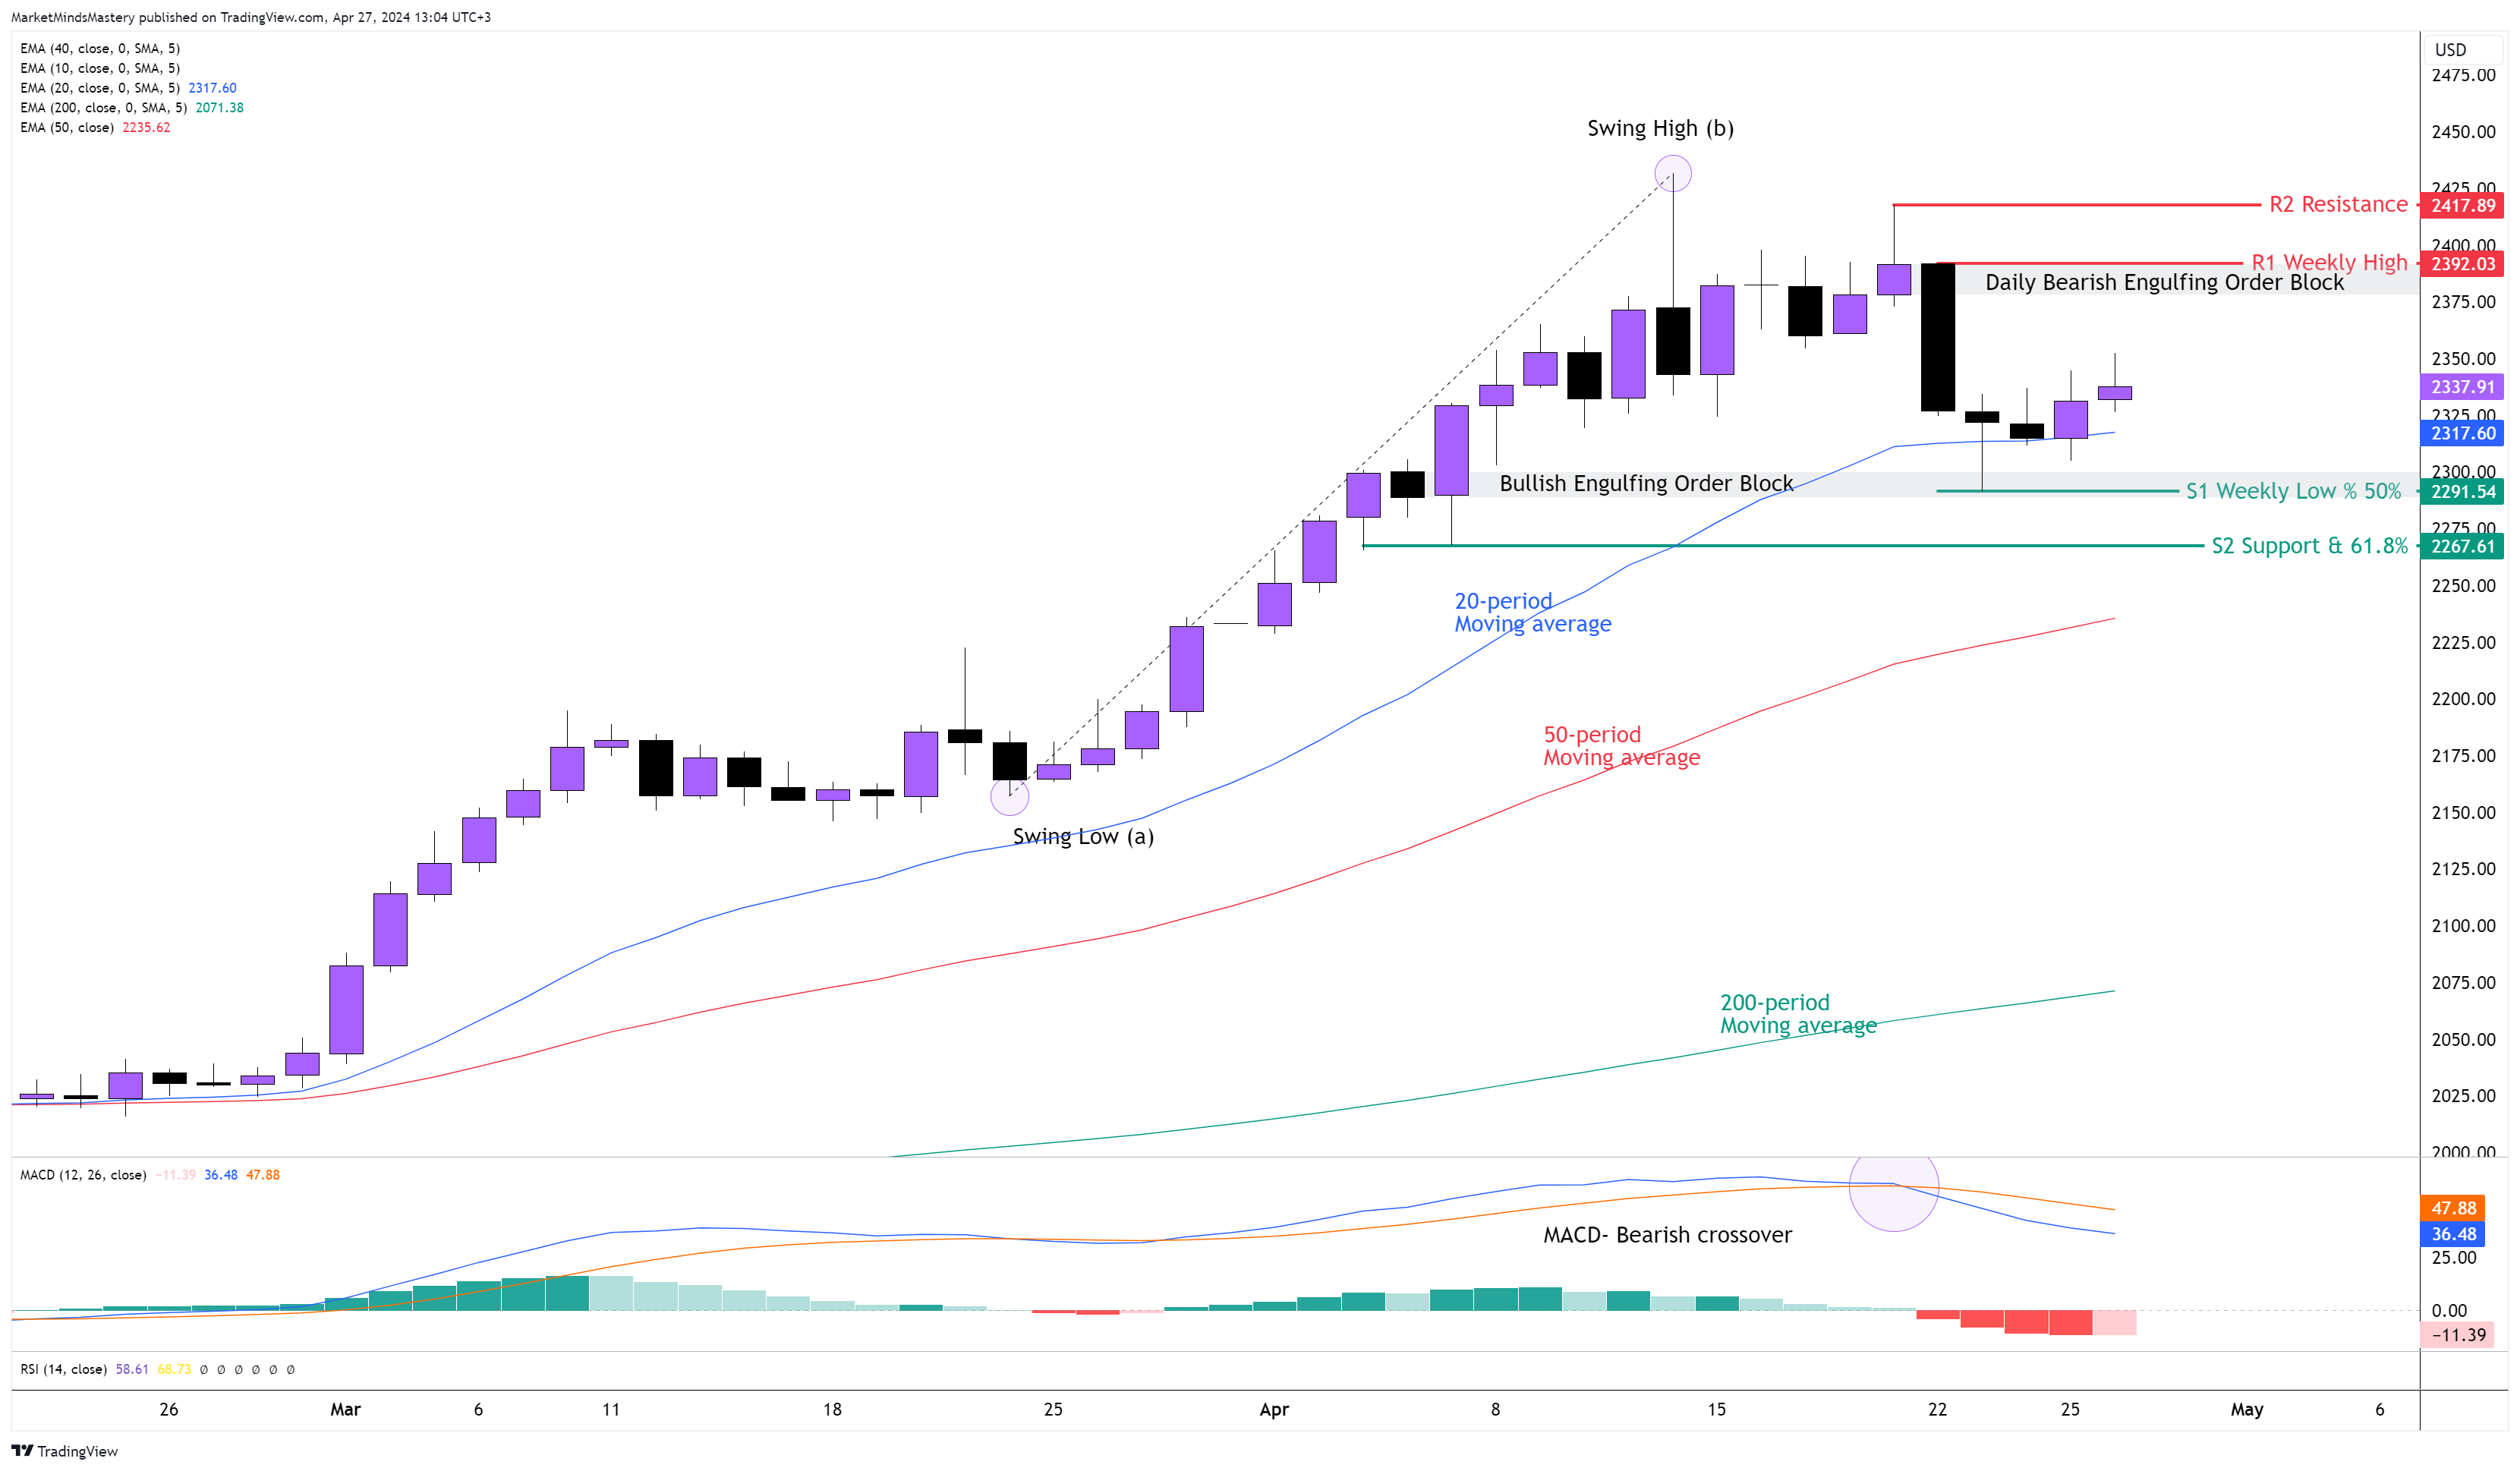
GOLD DAILY
Last week, the market moved as expected based on the intermediate and minor term trends. The weekly chart correction was represented on the intraday charts with lower highs and lower lows formations. On the Daily chart, the 20-period is above the 50-period, and both are above the 200-period. The distance between the three moving averages widens, and this is an indication of a strong bullish market. The bounce off the 20-period last Tuesday wasn’t accompanied by an instant upward move, indicating that the correction might not end. Drawing the Fibonacci levels from the swing low at point (a) to the swing high at point (b), we marked the significant levels of 50% and 61.8%.
If the price moves downwards, the first area of support S1 will be the previous week's low, around $2300. This level also includes a cluster of 50% retracement and a Bullish Engulfing Order Block. If the price moves below the S1, the next area of support, S2, is a Daily low that also consists of the Golden Ratio of 61.8%. Oppositely, if the price increases and the daily uptrend resumes, the first resistance area, R1, is the previous week’s high, just below $2400. At that level, a Bearish Engulfing Order Block was created. In case the price penetrates the R1 and moves higher, the next resistance area, R2, will be the high of the shooting star candle, around $2417.
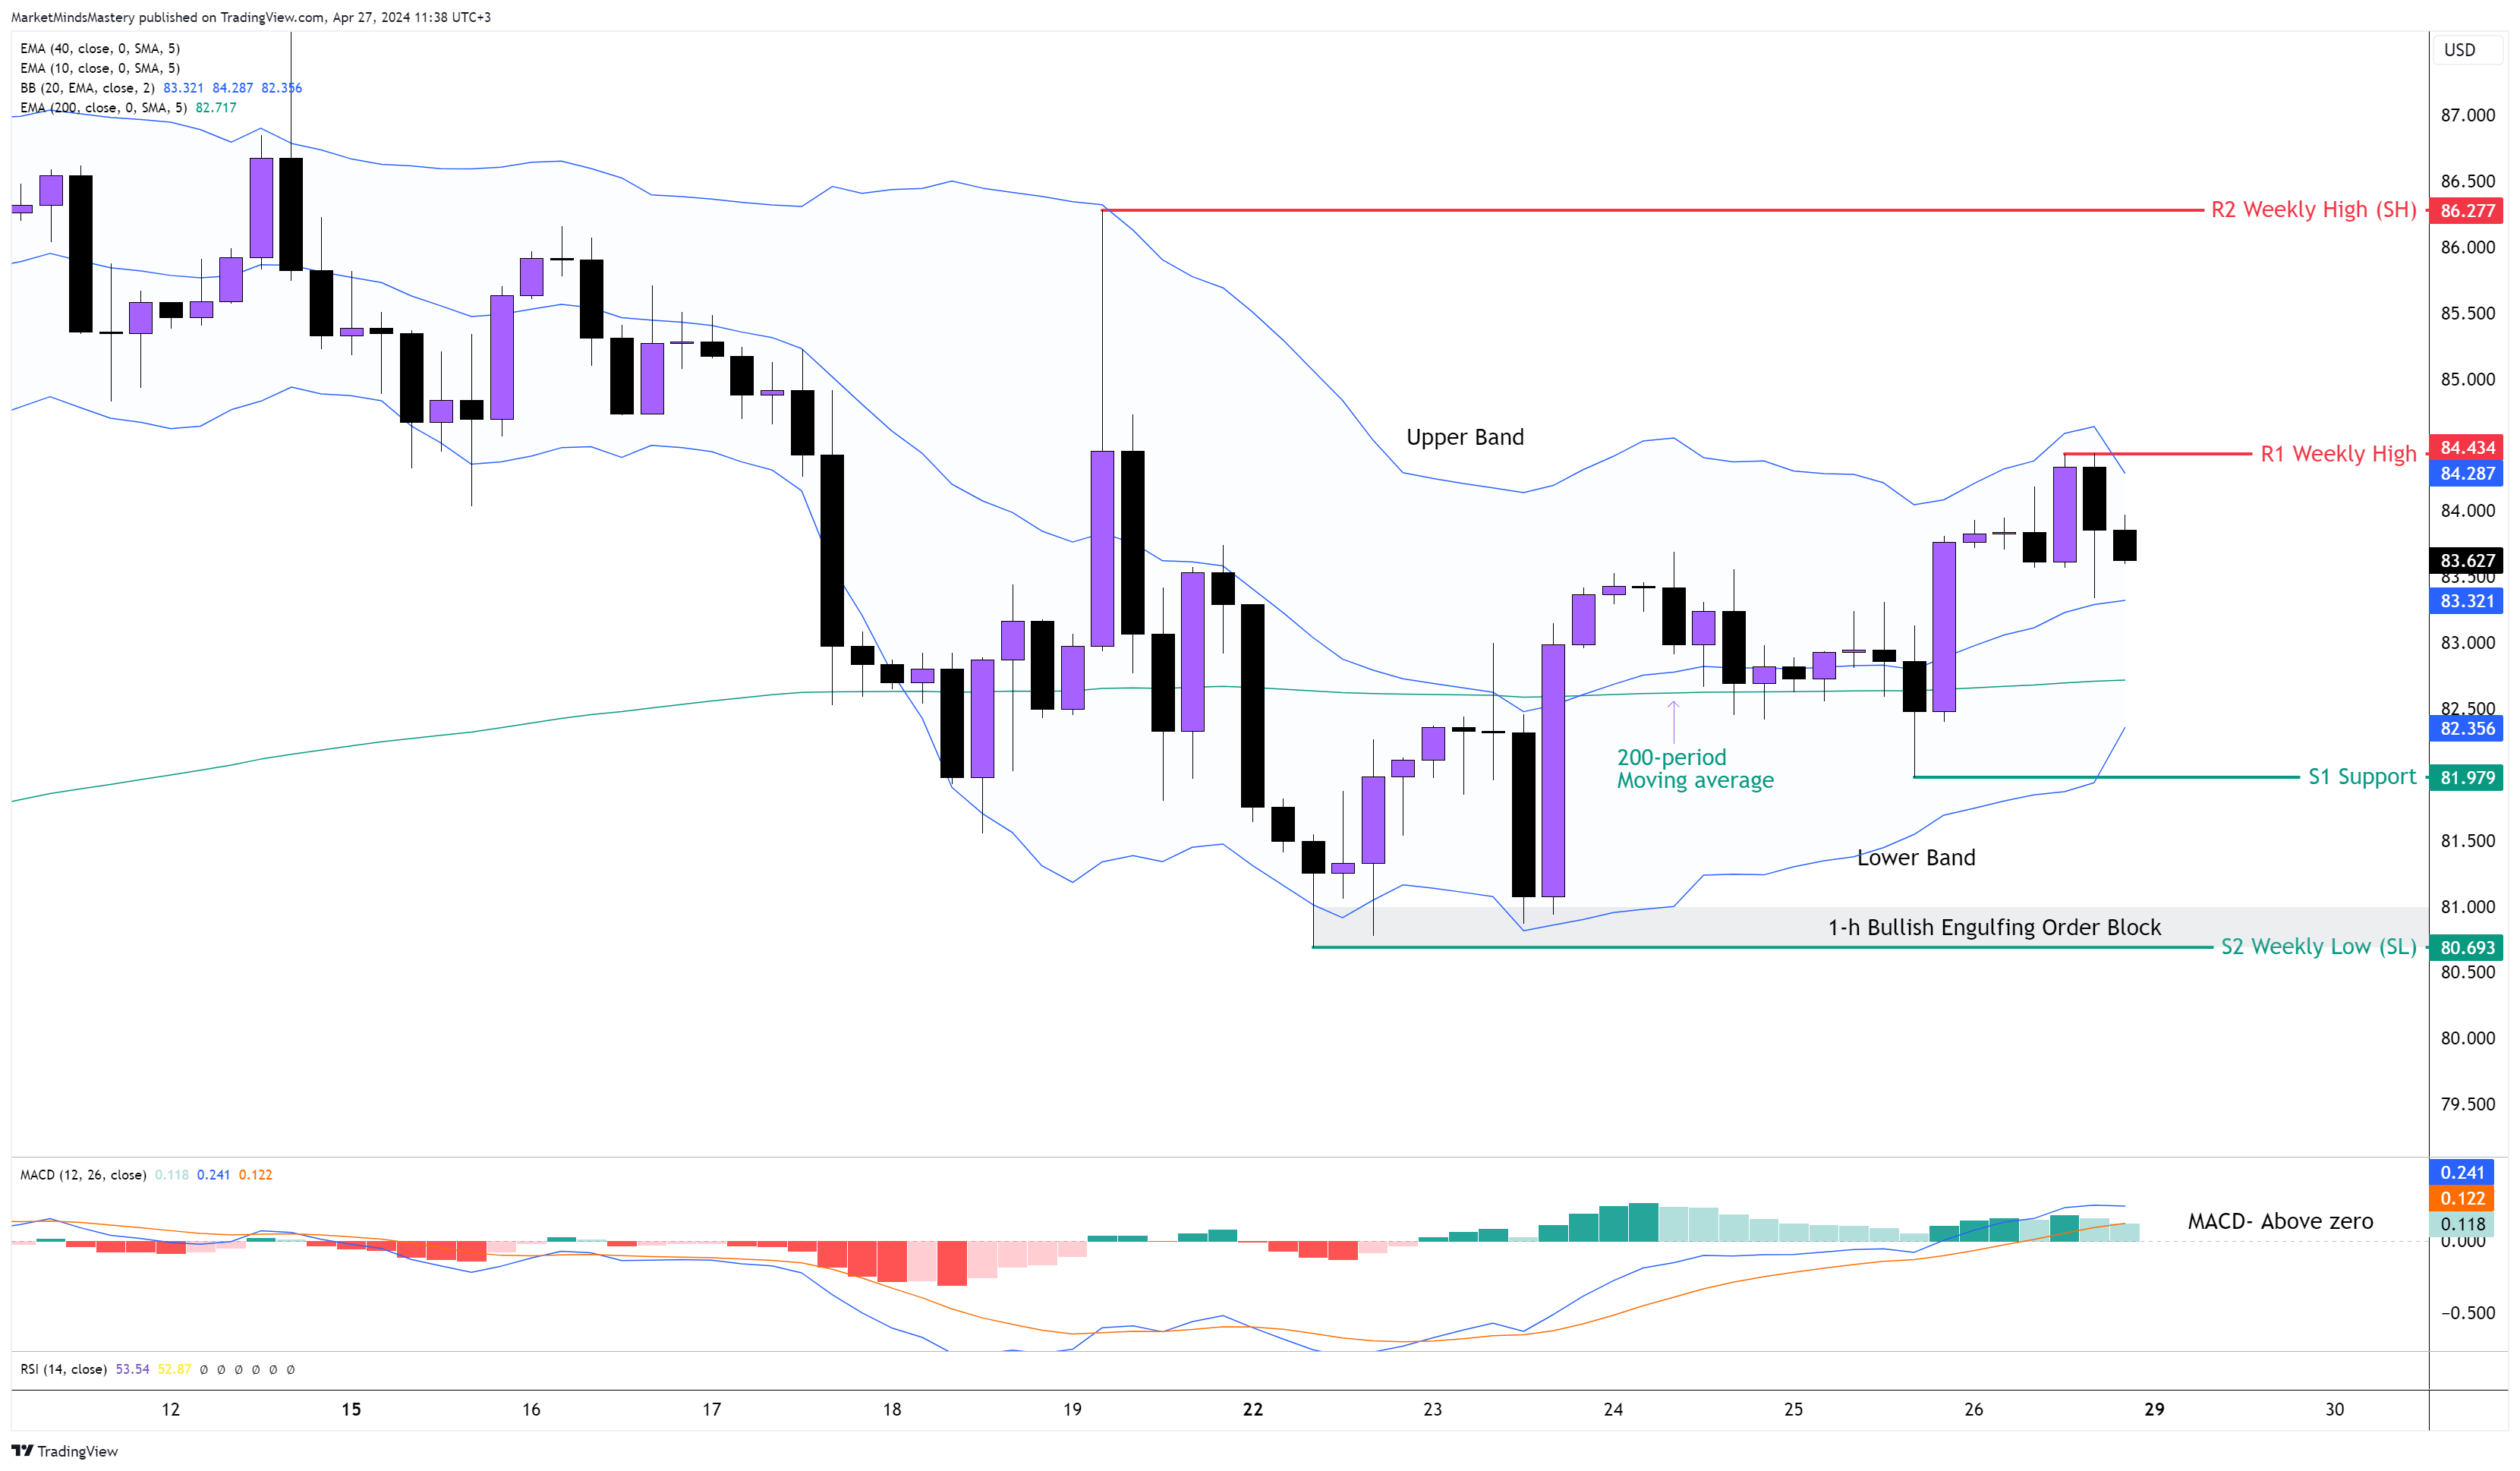
US OIL 4H
The retracement of the weekly chart ran out of steam, and the week ended with a Bullish Pin Bar rejecting both the 10 and 40 weekly moving averages, equivalent to the 50 and 200 daily moving averages.
The price formed a double-bottom, creating a Bullish Engulfing Order Block on the intraday charts. However, on the 4-hour chart, the bullish candles are longer and more in quantity than the bearish candles, indicating the accumulation of buying orders in the market. The price is above the middle of the Bollinger Band, that is, the 20-period moving average is bullish.
The MACD is above the zero line, and the histogram’s bars are increasing. Both indicate bullishness.
Furthermore, last Thursday, the price closed above the 200-period moving average and moved away from it, indicating buying pressure.
If the price continues to increase, the first resistance area, R1, will be the previous week's high, around $84.43. If it breaks and closes above the R1 and moves upwards, the next resistance area, R2, is an old weekly high, around $86.27. On the other hand, if the price moves downwards, the first area of support, S1, is approximately $81.97. If the price breaks and closes below the S1 and declines further, the next area of support, S2, is a weekly low of around $80.69.
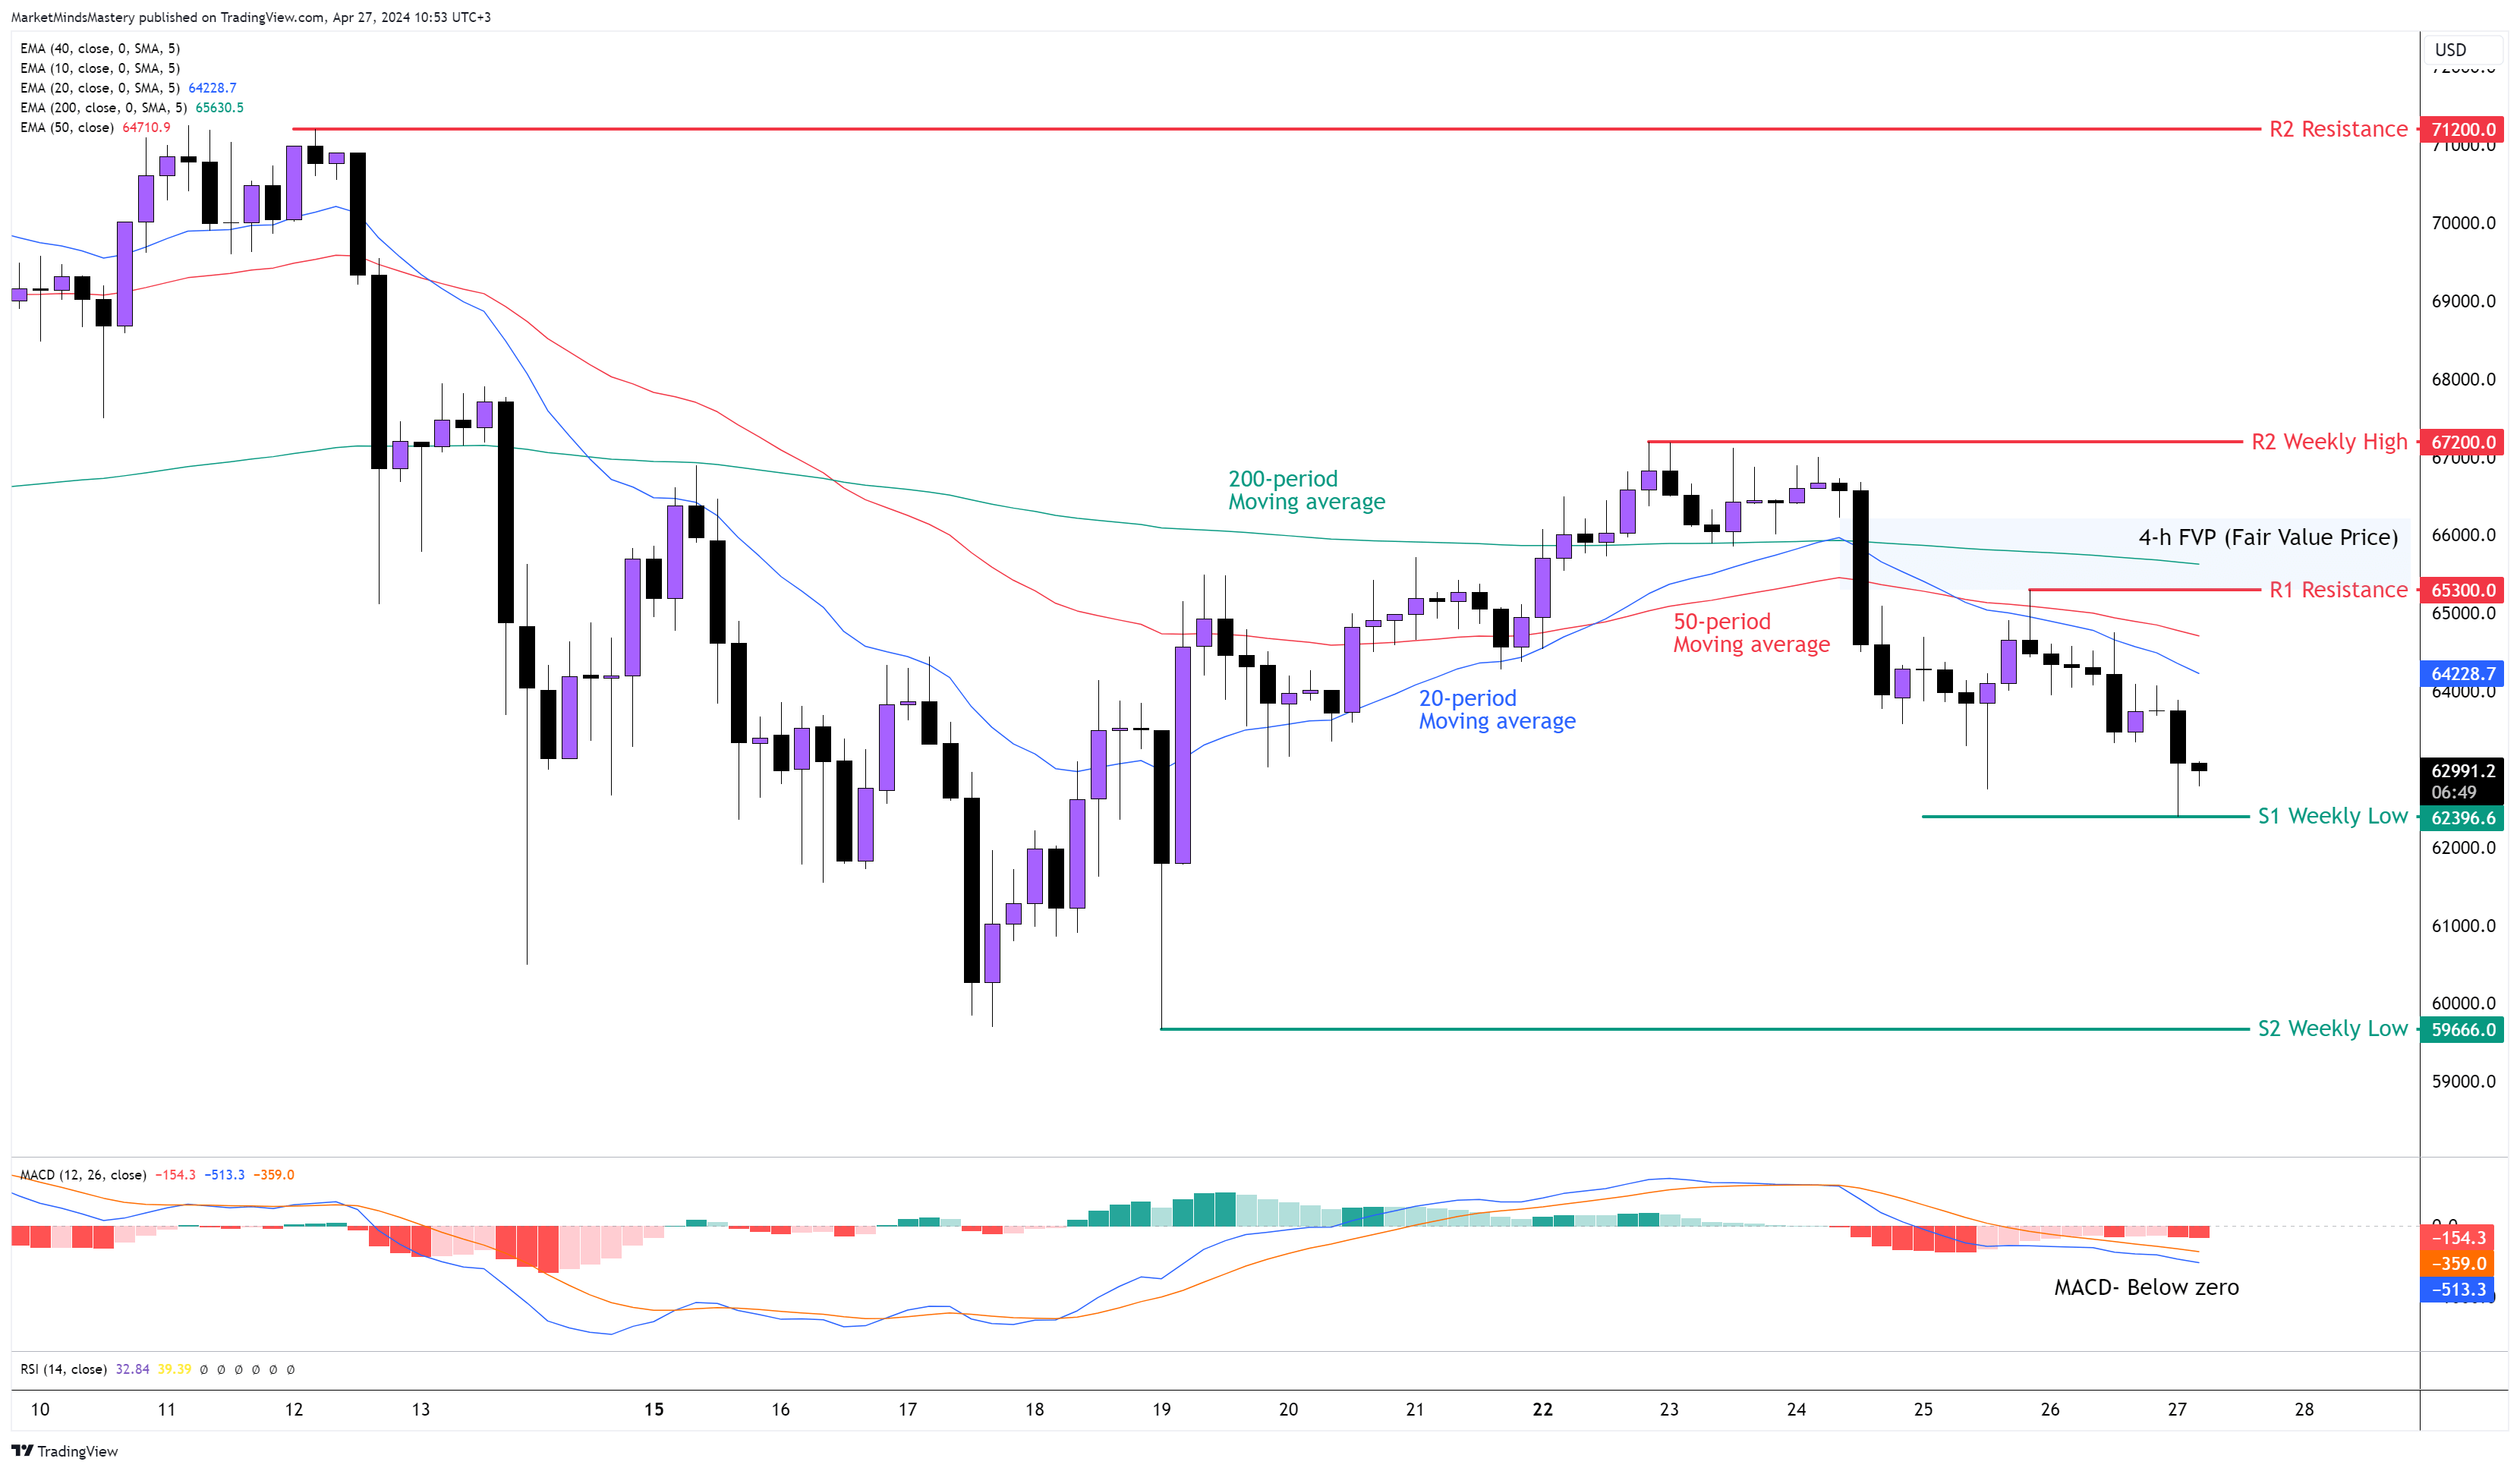
BTC USD 4H
Bitcoin’s performance, to some extent, disappointed the aggressive buyers as they were expecting a skyrocketing price after the halving occurred last week. Per the weekly chart, the price is an inside candle, indicating a market’s uncertainty of where it will likely go next.
Looking at the moving averages, the 20-period recently crossed under the 50-period, and now both are under the long-term 200-period, which means that the market has a bearish sentiment on the 4-hour chart. The MACD is below the zero line, indicating bearishness.
If the price moves downwards, the first support area, S1, will be the previous week's low, around $62396. If the price penetrates the S1, closes under it and keeps moving downwards, the next support area, S2, is another weekly low around $59666. Oppositely, if the price finds support, bounces off and moves upwards, the first resistance area, R1, is $65300. If the price penetrates the R1, closes above it, and keeps increasing, it enters into a FVP zone. The next resistance area will be the previous week’s high, R2, around $67200.
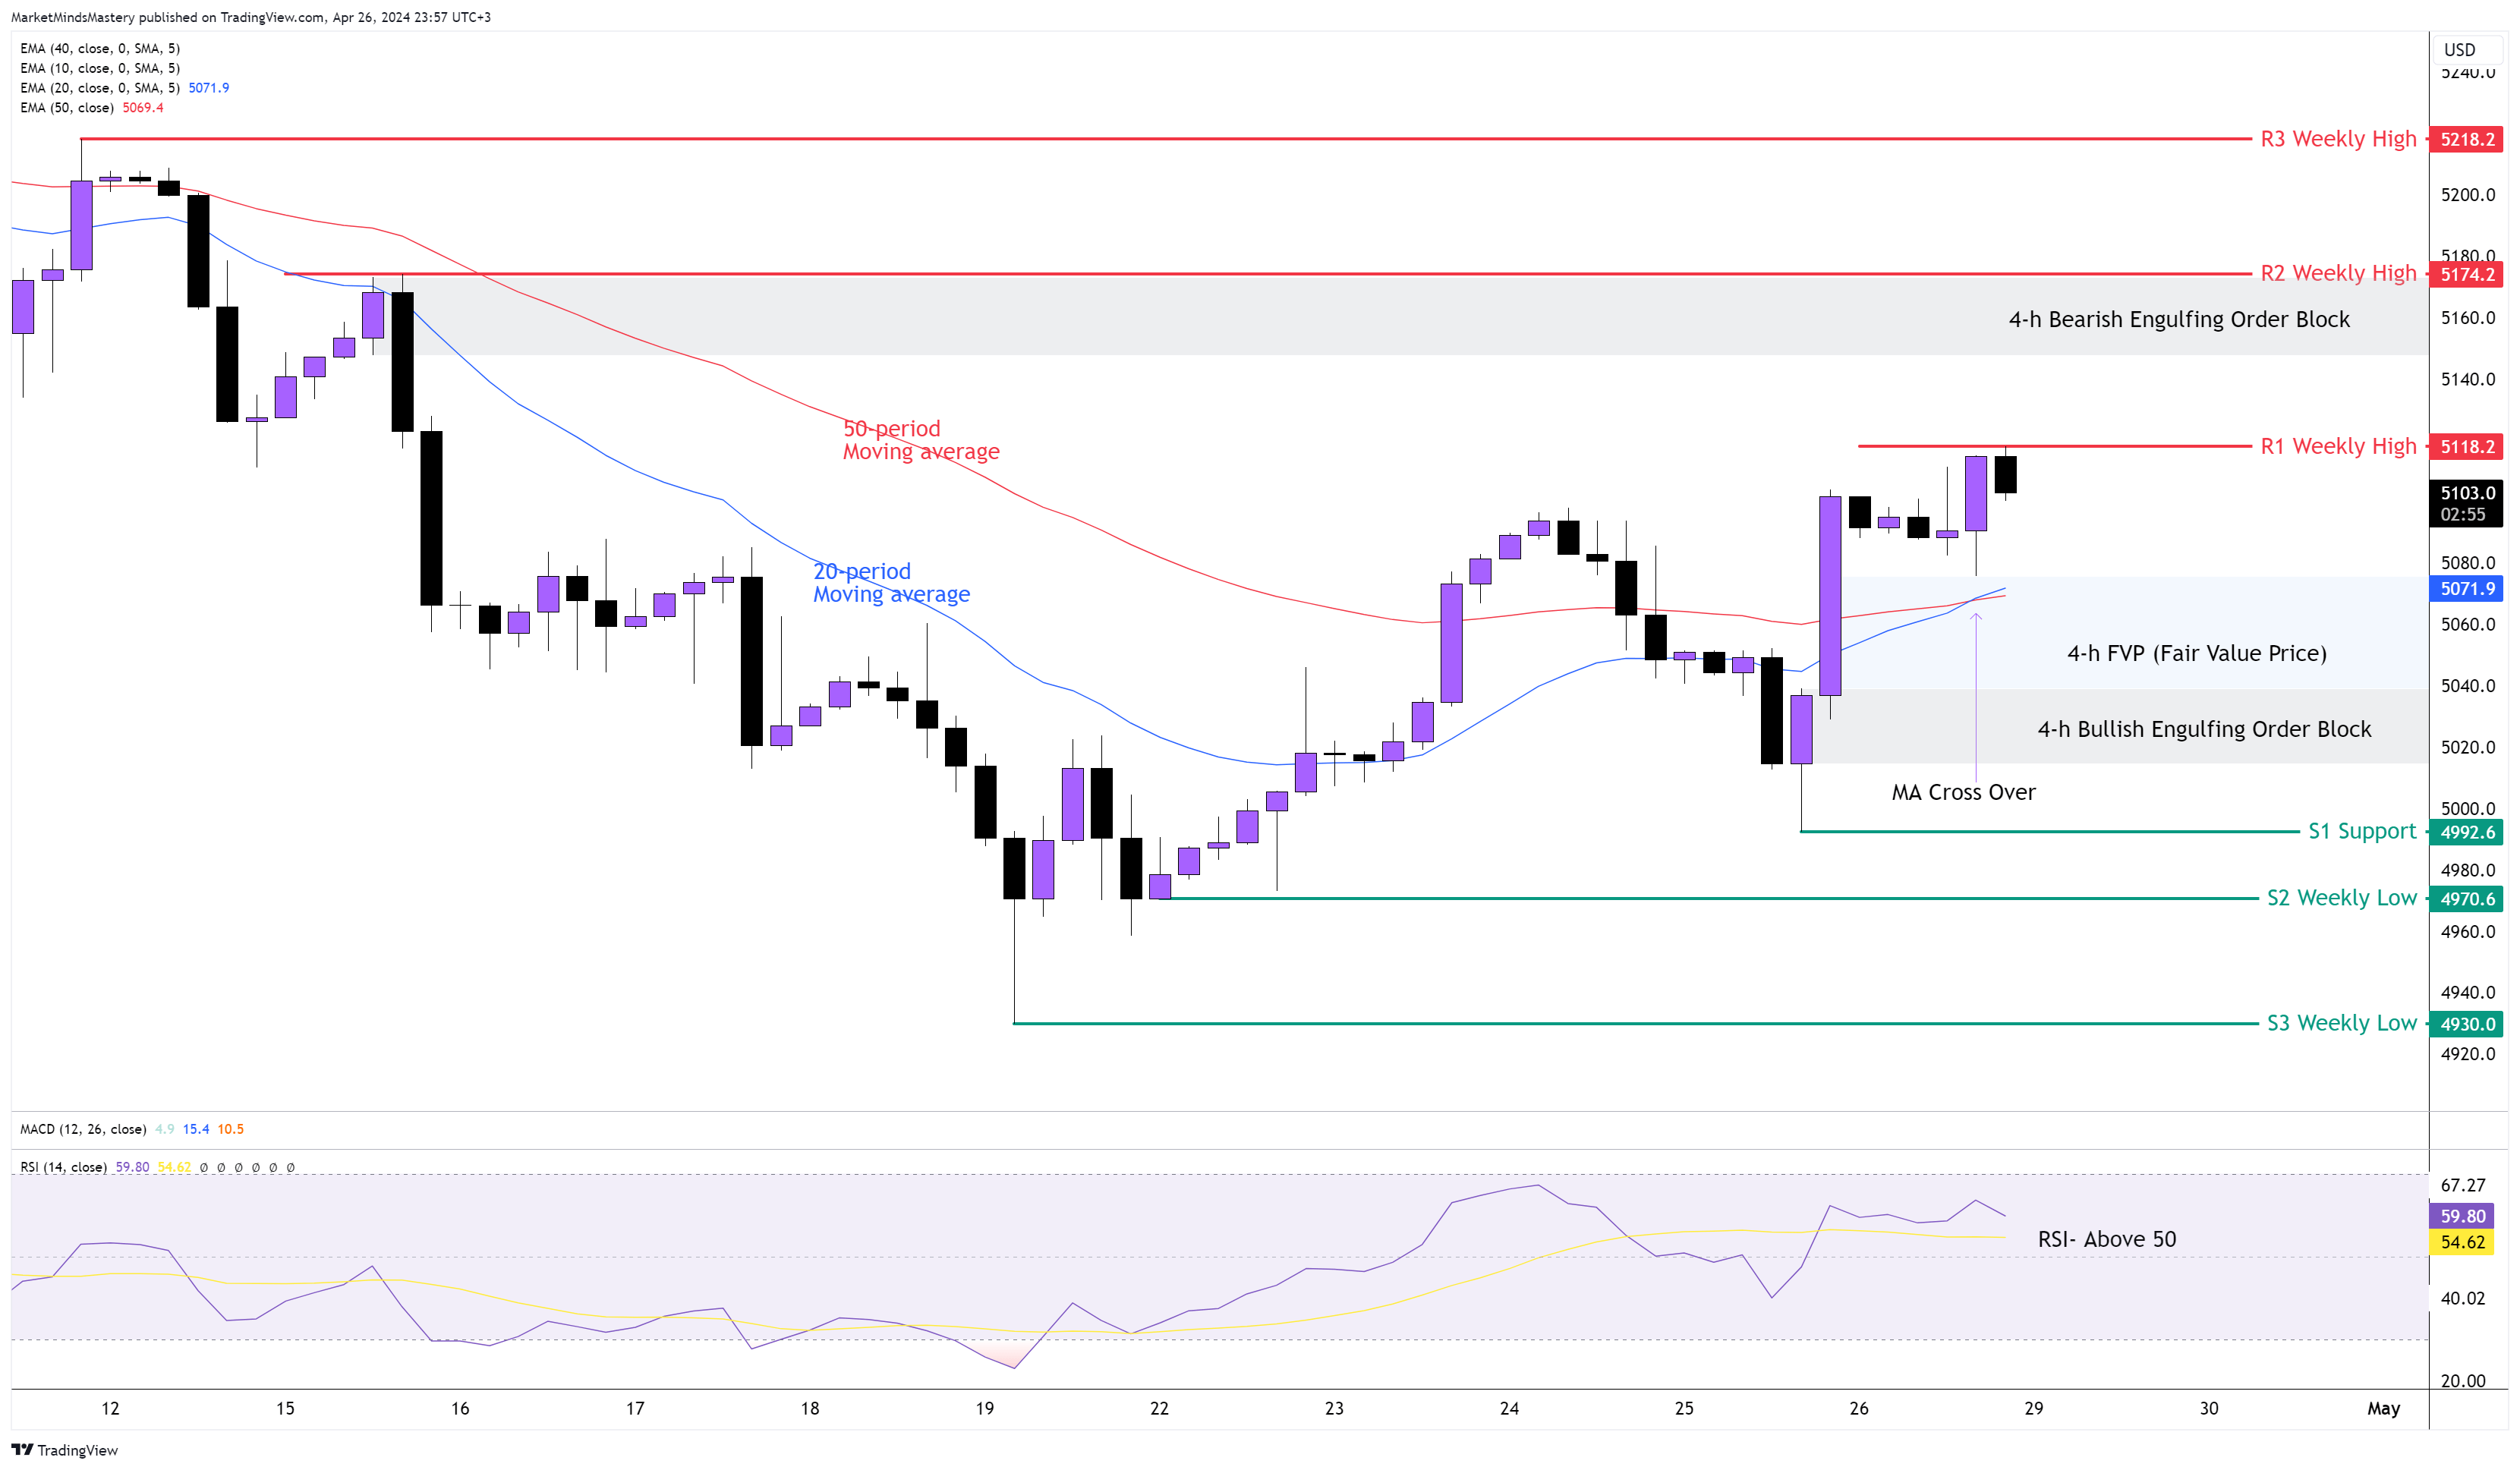
SP 500 4H
Following the lower and lower highs over the last two weeks, the price found support and bounced off, moving upwards, creating the first higher and higher low on the 4-hour chart. Per our previous week’s analysis, this was expected because we ensure every trader understands that the weekly chart is in a strong uptrend. We were happy to trade the 4-hour downtrend, which is the correction of the weekly chart.
Considering the price's higher high and higher low, the RSI is above 50, and the bullish cross-over of the 20-period above the 50-period moving average, If the price continues to increase, the weekly uptrend will resume, and the first resistance area, R1, will be the previous week’s high, around $5118. If the price penetrates the R1 and keeps increasing, the next resistance area, R2, will be $5174. The Bearish Engulfing Order Block formed at R2 can cause a reaction to the price due to accumulative selling orders.
On the other hand, if the price declines, there are few robust supporting price levels. The first is the FVP ( traders also know it by FVG). As the market doesn't Gap, it is more appropriate to use the price word. A decline can find the price supported by the FVP and the Bullish Engulfing Order Block. A 100% retracement will see the first support area, S1, around $5000, a round and significant number for the SP 500. If the price declines more, we will find the following two support areas, S2 and S3, around $4970 and $4930, respectively.
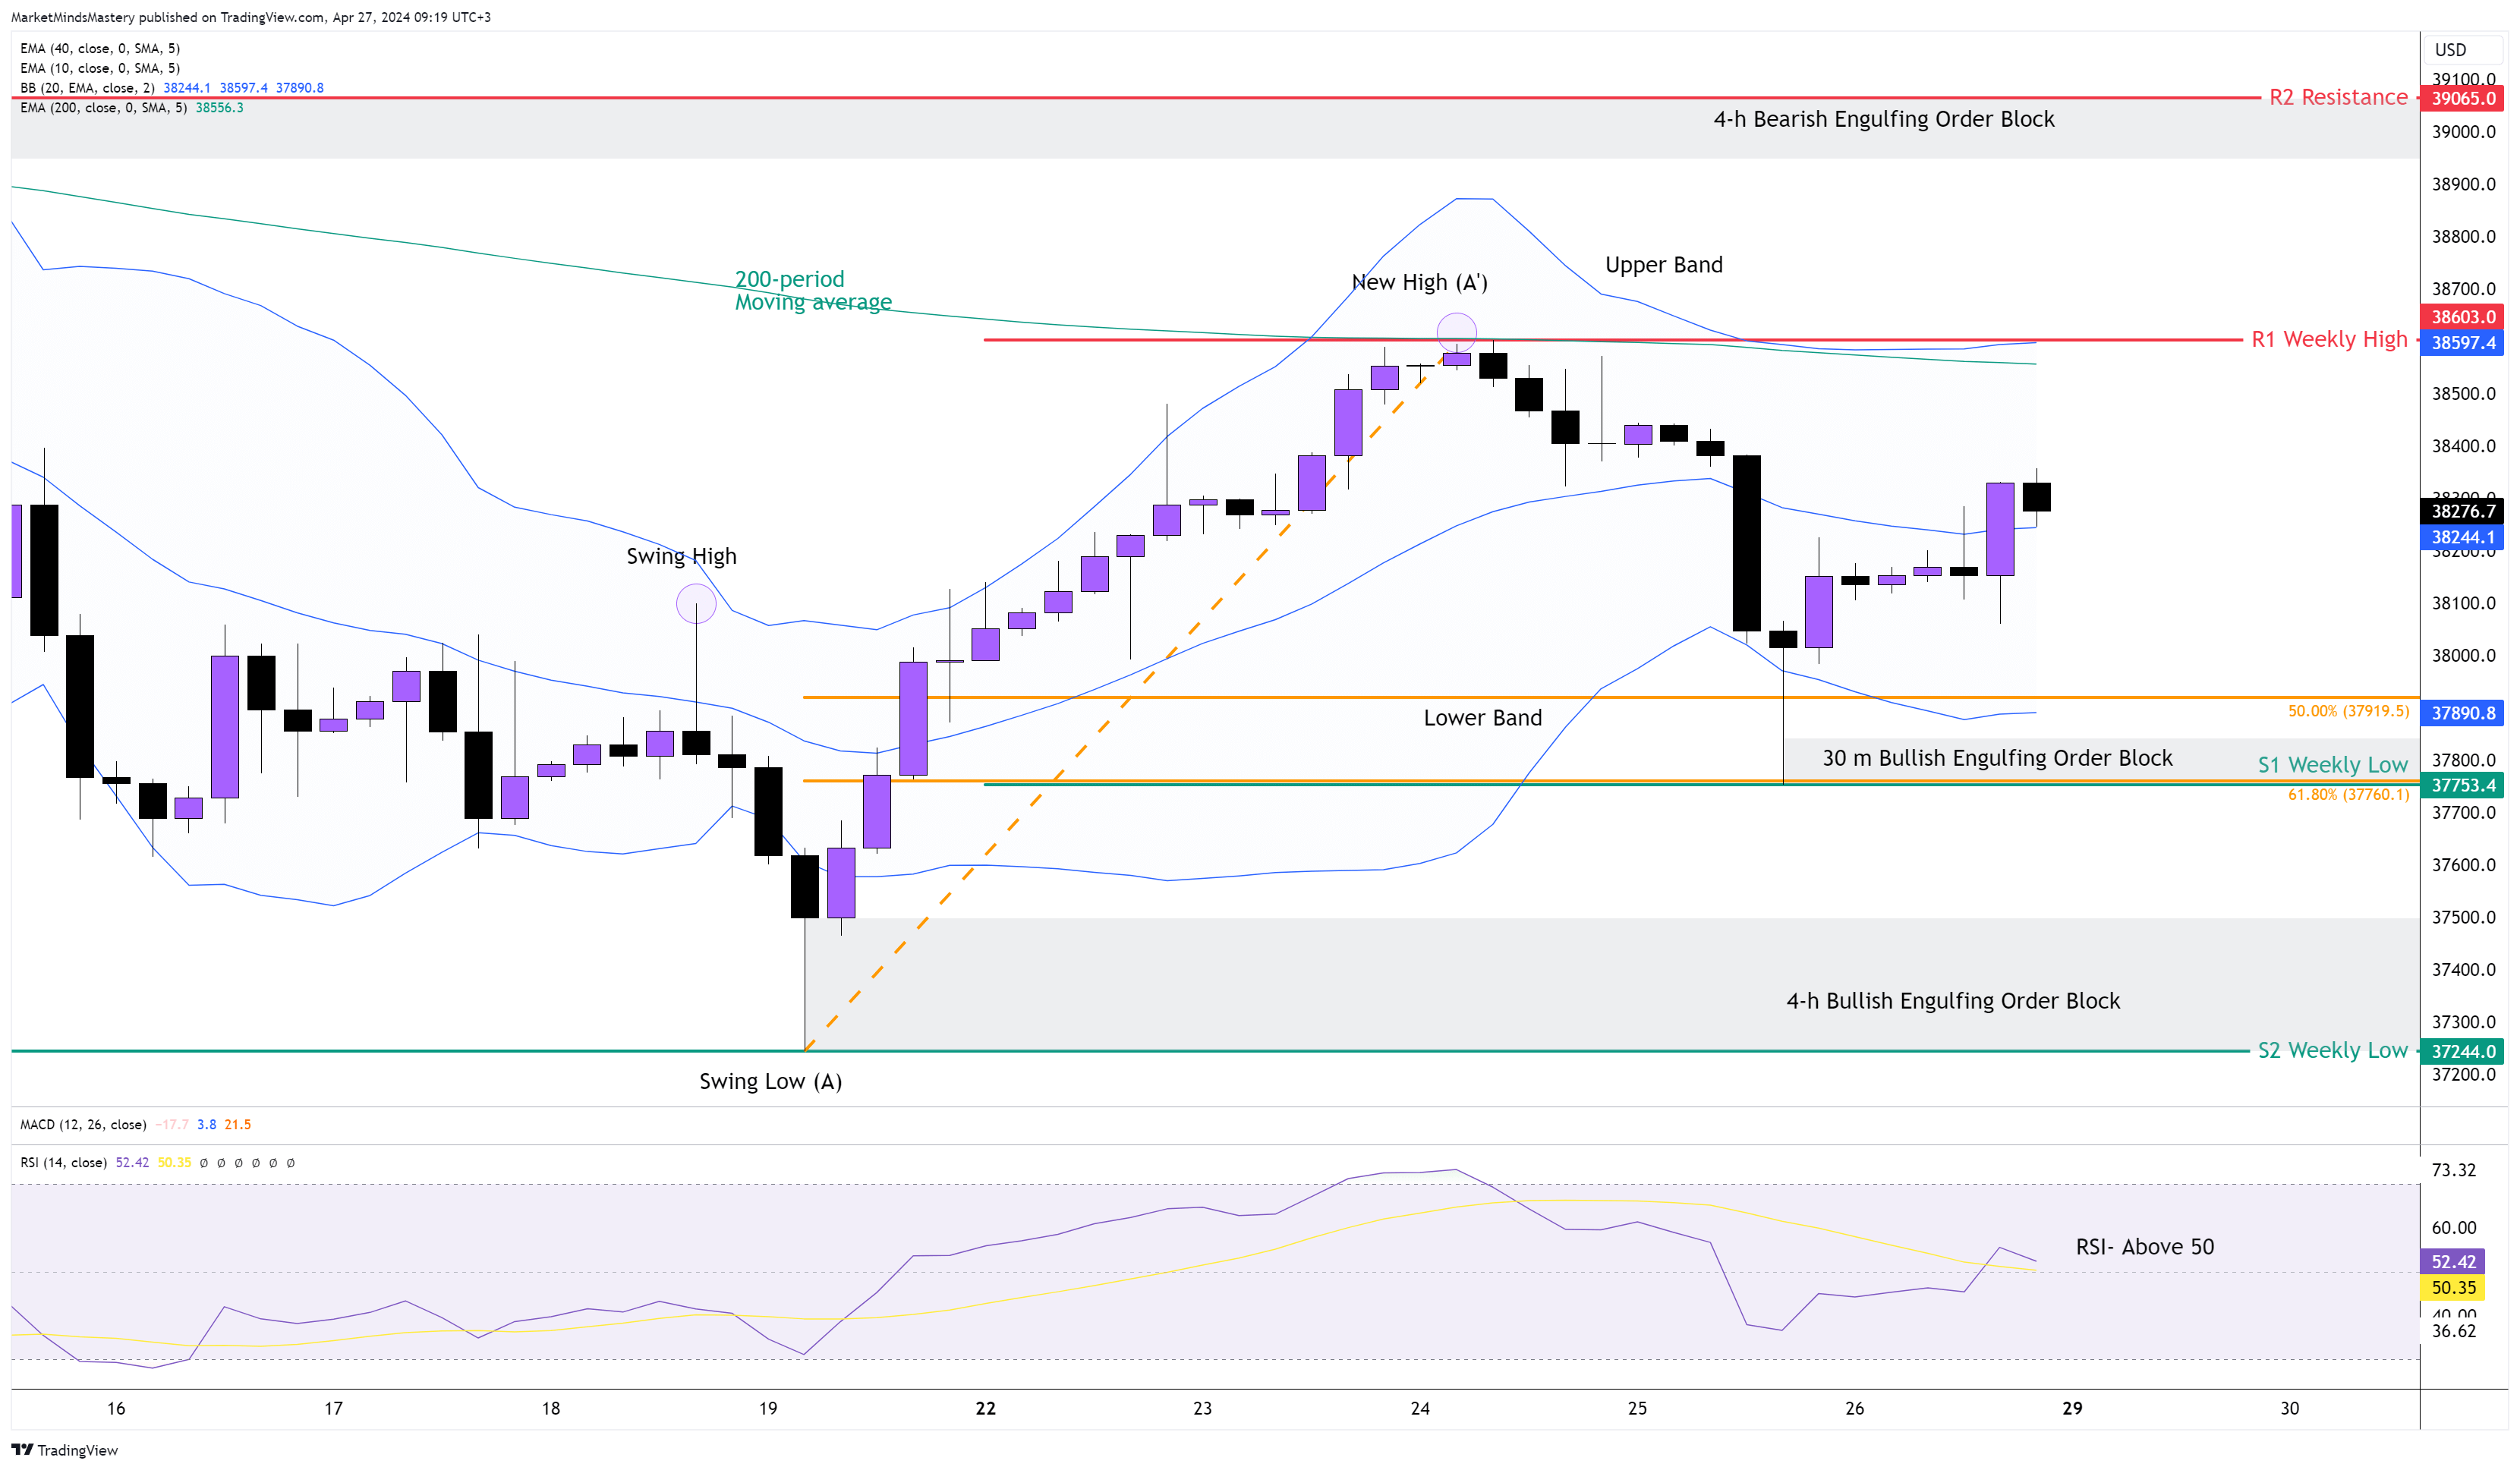
US 30 4H
Following the Positive Divergence during the last downward move, the price didn’t stop at a corrective phase, surpassed the recent Swing High, and created a New High. Measuring the distance between the Swing Low (A) and the Swing High (A’), the price retraced at the Golden Ratio of the Fibonacci numbers, which is 61.8%. A Bullish Engulfing Order Block formed on the intraday charts, and the pierce bounced off and moved upwards.
The RSI is above 50, indicating bullishness. The new Swing High indicates the potential beginning of the new uptrend, the support from the 61.8% Fibonacci retracement and the rejection of the Lower Band indicates an accumulative buying order in the market.
Currently, the price is above the middle of the Bollinger Band. The first resistance area, R1, will be around $38600 if it continues to move upwards. This area is significant because of the 200-period dynamic moving average, the previous week's high, the recent swing high, and the Upper Band of the BB. If the price penetrates through the R1, the next resistance area, R2, will be around $39000.
Oppositely, if the price declines and moves downwards, the first support area, S1, will be low, around $37753. A break and close under the S1 can decrease the price and reach the S2 support area of around $37244.
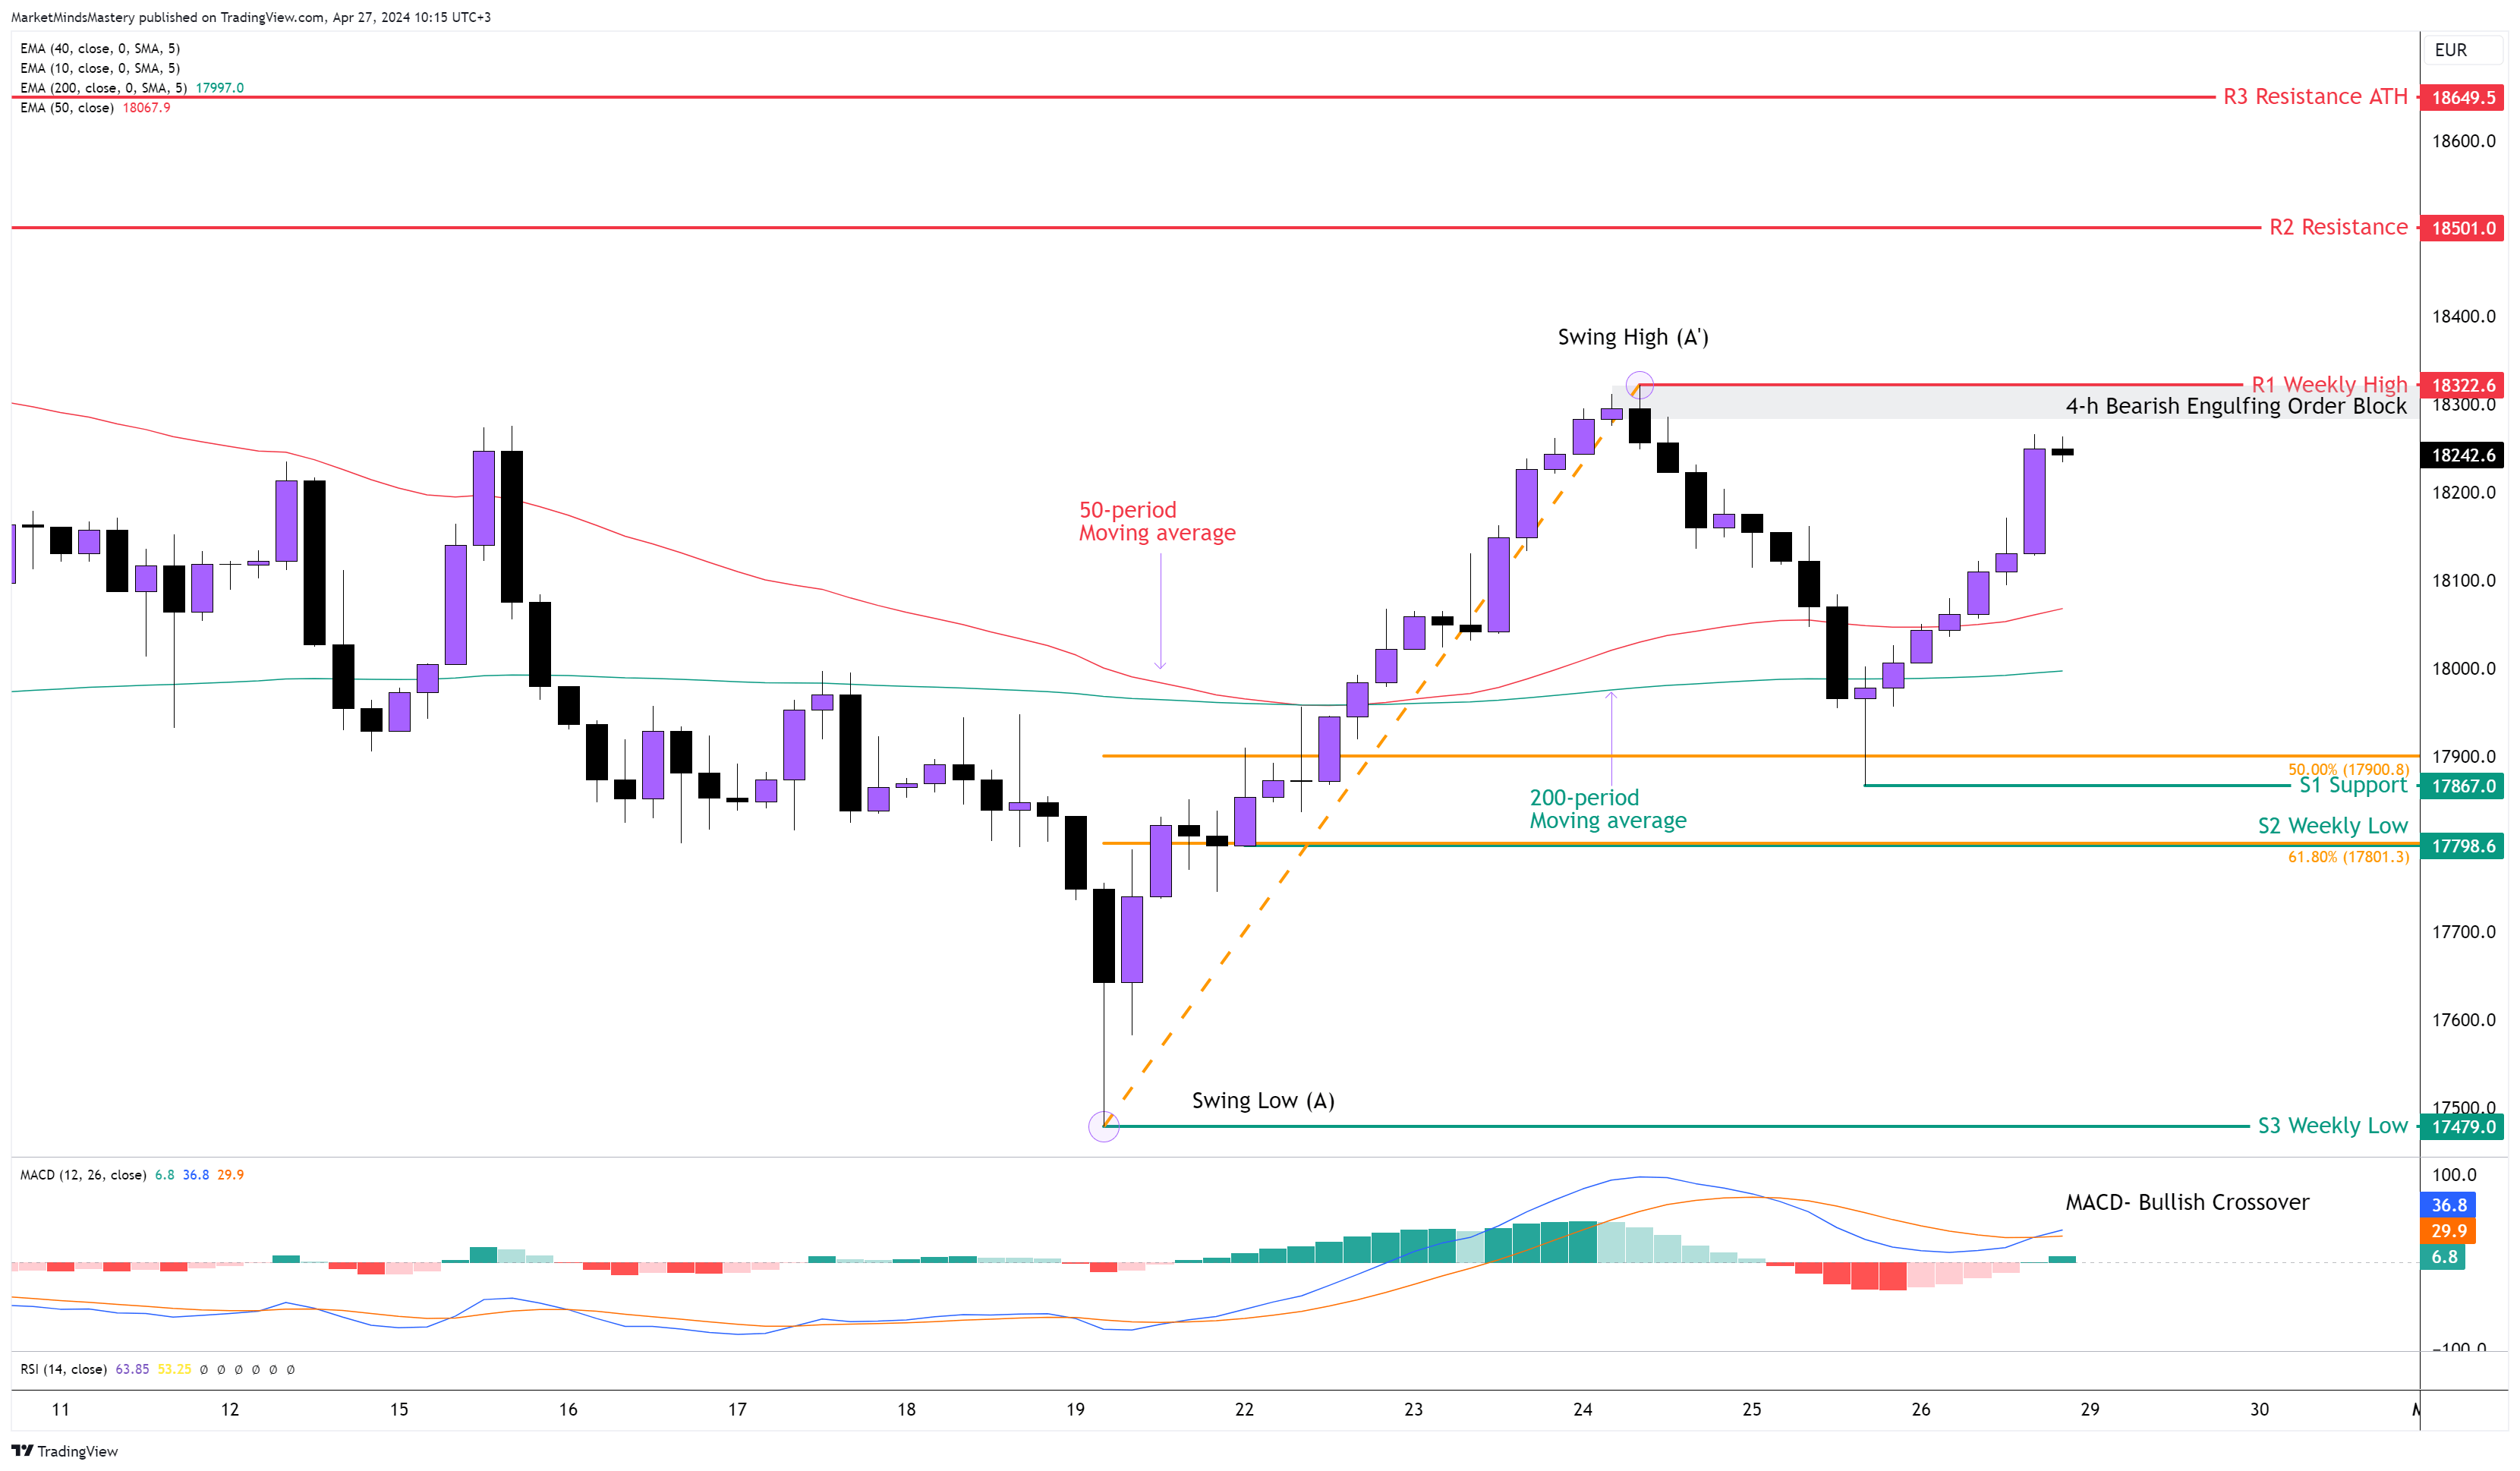
GER 30 4H
The weekly chart shows a strong bullish momentum, which is explained by the higher highs and higher lows. The downtrend of the 4-hour chart ended last Wednesday once the price created the Swing High (A’).
The 50-period moving average is above the 200-period moving average, which is bullish. The MACD indicator shows that both lines above the zero line and the MACD line (blue colour) crossed above the Signal line (orange colour) indicate strong bullishness.
The price was corrected at the 50% Fibonacci retracement, and a Bullish Pin Bar was printed, pushing the price upwards. If the price increases, the first resistance area, R1, will be around 18300. There is a Bearish Engulfing Order Block at this level and a previous week’s high. For the uptrend to continue, the price must break above the R1.
If the price breaks above the R1 and moves upwards, the next resistance area, R2, is approximately 18501. If the price breaks and closes above the R2 and keeps increasing, the next resistance area, R3, will be the All-Time High around 18650. On the other hand, if the price moves downwards, the first and second support areas, S1 and S2, are between 50% and 61.8% Fibonacci retracement, around 17867 and 17800, respectively. The S1 is especially critical because the Bullish Pin bar is low. If the price closes below the S1 and S2 and declines further, the next support area, S3, is around 17479, an old weekly low. Remember, if the price penetrates the Swing Low (A’), the uptrend we expected won't be valid any more.
👉 Click here to check our Challenges
👉 Don’t miss our Free Live Webinars
👉Join us on Discord
Risk Disclosure:
The Trading Pit offers only demo accounts to all users within the Challenges and Signal Provider Agreements (Scaling Plan). All assets and trading activities are purely virtual. Please note that we do not offer CFD (Contract for Difference) challenges to residents of Canada and the United States. All content and information on this website is for informational purposes only and should not be interpreted as financial advice. Also, remember that results achieved in the past are no guarantee of future results. It is essential to understand the risks associated with trading. If you are unsure, always consult an independent financial advisor.