Statistical Arbitrage (Stat Arb) isn’t your average trading strategy. It’s not based on chart patterns, candlestick signals, or gut feelings. Instead, it’s driven by data – and a whole lot of math.
Used by hedge funds and algorithmic traders, statistical arbitrage looks for pricing inefficiencies between related assets. If two assets normally move together, but suddenly don’t, there could be an opportunity; and when the spread returns to normal, you profit.
You don’t have to be a huge fan of math to understand this strategy, let’s break it down.
TL; DR – Stat Arb in One Minute
Statistical Arbitrage Explained
Stat Arb is a quantitative trading strategy that uses mathematical models to spot and exploit short-term mispricing between related financial instruments.
Unlike traditional arbitrage (which looks for price differences across markets), Stat Arb focuses on mean reversion between assets with a strong historical relationship.
The most common setup would be Pairs trading, where you long one asset and short another: If Asset A and Asset B typically move together, and suddenly A spikes while B lags behind, you short A and long B. When the spread narrows back to normal, you close both positions.
In this instance, you’re not betting on direction, but on convergence.
How Does It Work?
Here’s the general process:
Find correlated assets (KO & PEP or EUR/USD & GBP/USD)
Track their price spread over time
Identify variations from the norm (using z-scores or other statistical models)
Open a pairs trade when the spread gets “too wide”
Exit the trade when the spread returns to the mean
Many traders tend to automate this with scripts or algos. However, even without automation, a basic version can be run using tools like TradingView, or platforms with pairs-trading functions.
Techniques Used
Example: Pairs Trade with Coca-Cola and Pepsi
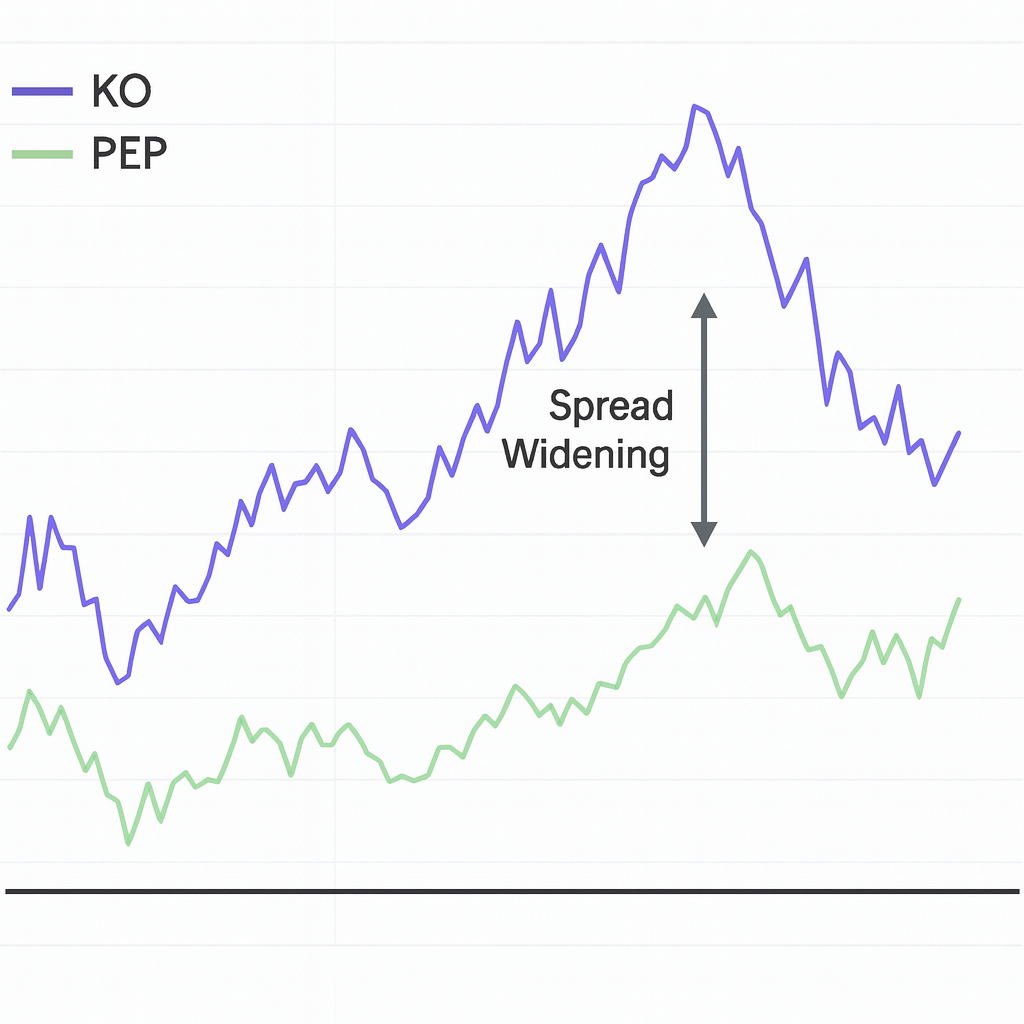
Coca-Cola (KO) and PepsiCo (PEP) are competitors and often move in sync. A Stat Arb model might show that the spread between KO and PEP is historically tight – let's say within $1.50 of each other.
Suddenly, KO rallies hard while PEP lags > the spread jumps to $3.
You short KO and go long PEP, expecting the spread to narrow.
A few days later, KO cools off and PEP catches up > the spread reverts to $1.50.
You close both trades: profit made on convergence, not direction. You didn’t need to know why the move happened. You just needed to know that, historically, these two stocks don’t stay that far apart for long.
Pros & Cons of Stat Arb
Pros | Cons |
Market-neutral | Correlation isn’t forever |
Logic over emotion | Execution risk |
Works across different markets | Relying heavily on historical data that may not hold in live markets |
Can be used by individuals or hedge funds alike | Low-quality or noisy data leading to bad signals |
FAQ Section
Do I need coding or a quant background to use Stat Arb?
Not necessarily. While institutional Stat Arb relies heavily on algorithms, retail traders can still use simple pairs of trading with tools such as z-scores and MAs.
How is it different from regular arbitrage?
Regular arbitrage exploits price differences in the same asset across markets. Stat Arb trades the relationship between two or more correlated assets.
Is it risky?
It can be. If the assets were to diverge further instead of reverting, you could take a loss on both legs. That’s why proper risk management and model validation are essential.